The Usage dashboard provides an interface for monitoring the monthly usage summary of key VSI and DPI metrics, along with a detailed view of the data points for each interval within the selected time range for the specified accounts related to Conviva account billing.
It initially displays,
-
VSI: Total Viewer hours, Video Concurrent Plays
-
DPI: Total Events, User Sessions (Ended), Total Flows, Total Metrics, Peak Events Per Minute, Average Events Per Session
-
API: Realtime API calls, Historical Realtime API calls
However, according to the contract, customers can collaborate with Conviva Customer Support to add or remove metrics.
To access the Usage dashboard,
-
Click the Settings icon.
-
In the Settings menu, click the Usage Dashboard.

Usage Dashboard Widgets
The Usage Dashboard aggregates total viewing hours across all selected accounts, including viewer-specific metrics. It consolidates Conviva-mapped and custom-mapped events, critical user journey durations, cumulative metrics, peak events per minute, and average events per session.
By default, the Usage Dashboard shows the cumulative details of all associated active accounts and also allows to view the usage details of any individual account for usage analysis.
Note: The Usage dashboard displays the readings based on the UTC time zone, not the local time zone.
These are the default metrics that appear on the Usage dashboard. To add or remove metrics, contact Conviva Customer Support.
VSI:
-
Total Viewer Hrs: Total Viewer hours displays the total number of hours of video playback within the specified interval, including the actual playtime + Server Side Ads Hrs and excluding the rebuffering time.
-
Video Concurrent Plays: Concurrent Plays are the maximum number of simultaneously active sessions during a given interval. Active sessions have at least one played video frame, and do not include unsuccessful play attempts or sessions that have ended.
DPI:
-
Total Events: This display shows the total number of events within the specified interval.
-
User Sessions (Ended): A user session refers to a sequence of interactions initiated by a user through their behavior or custom and mapped events. A session starts when the user performs one of these events (not including network requests, page pings, or heartbeats). The user session continues as long as the system receives new events within a five-minute window. If the system does not receive any events for five minutes (including network requests, page pings, or heartbeats), the session ends.
-
Total Flows: Total Flows display the total number of customer-activated self-defined flows.
-
Total Metrics: Total Metrics display the number of activated metrics, both out-of-the-box and self-defined, excluding flow metrics.
-
Peak Events Per Minute: Peak Events Per Minute displays the minute with the highest total events across all sub-accounts, and reports each sub-account’s value in the considered peak minute.
-
Average Events Per Session: This metric displays the average total of events per user session.
API:
-
Realtime API calls: Realtime API calls displays the total number of real time API called within the specified interval.
-
Historical API calls: Historical API calls displays the total number of Historical API called within the specified interval.
Note: This section displays the accounts that have the API credentials and refreshes its content daily at 00:00 UTC.
For detailed metric definitions, see VSI Metrics and DPI Metrics.
Note: The customer list includes only active customer accounts.
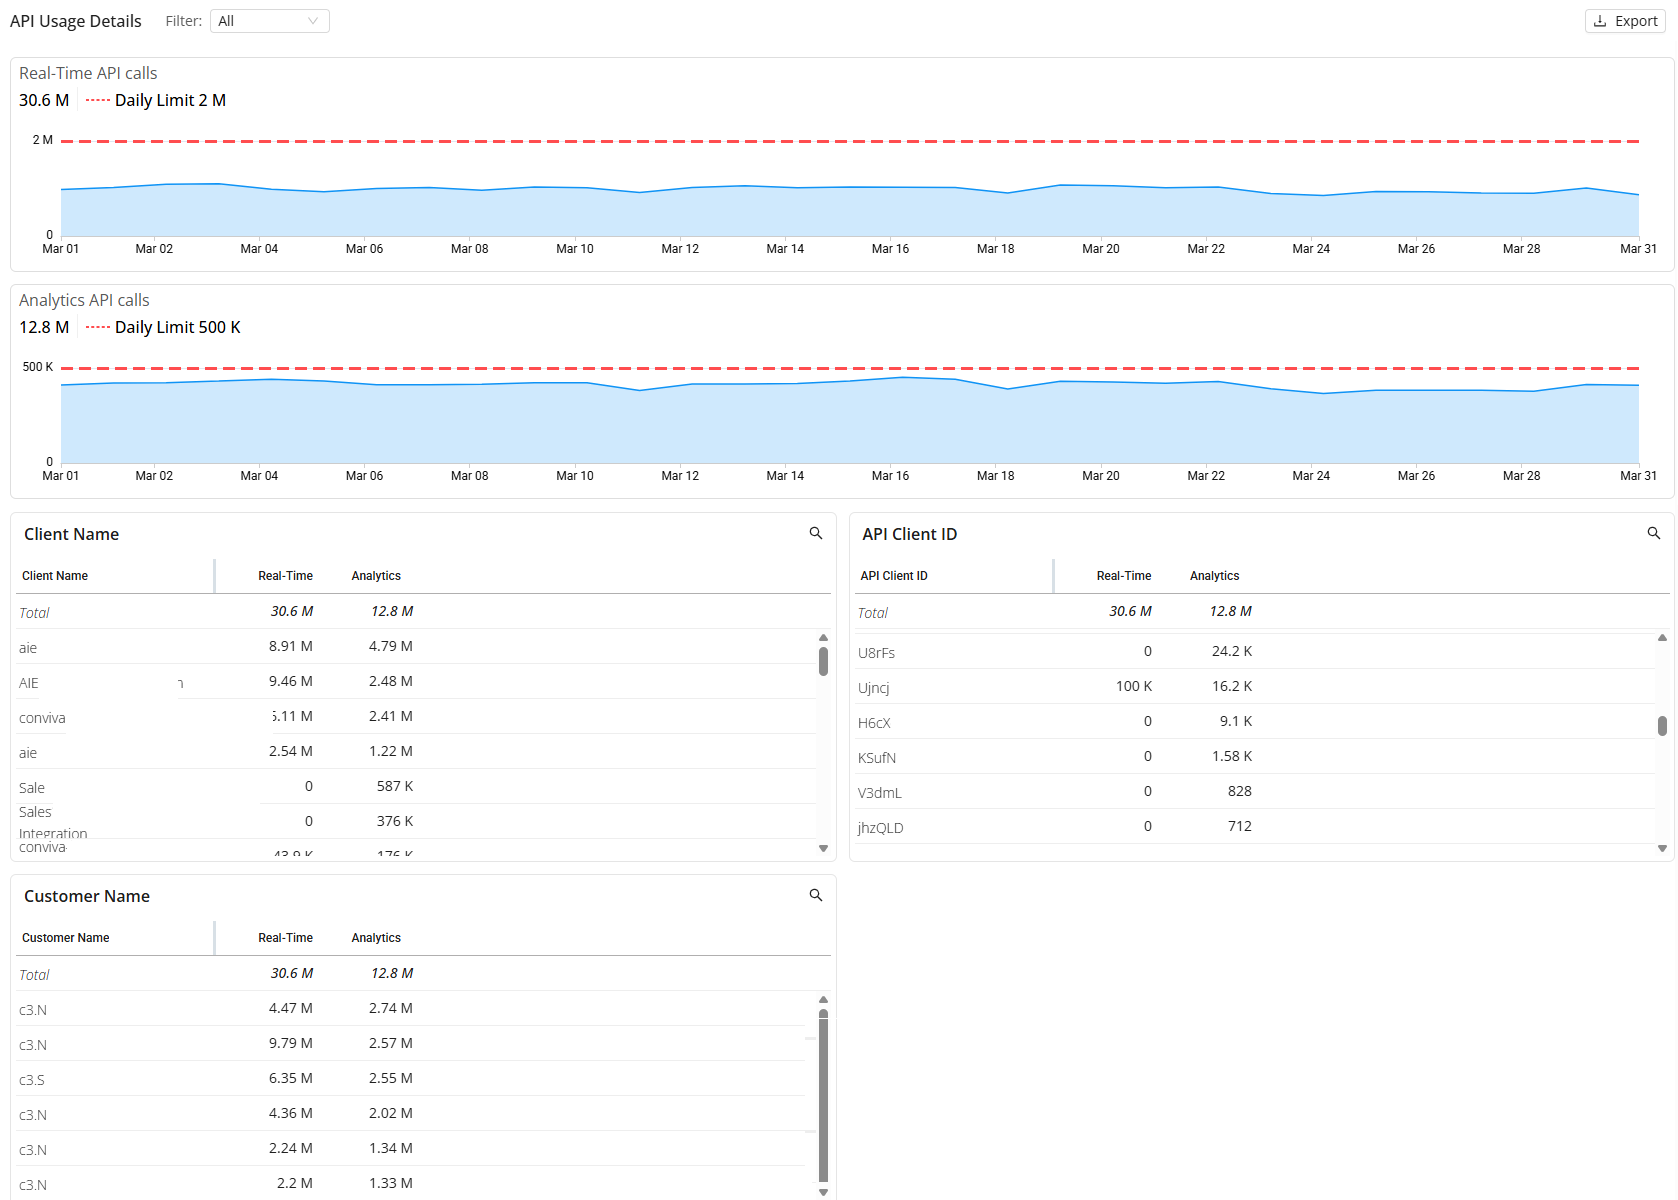
API Usage Breakdown and Application Management
The Usage Dashboard delivers enhanced visibility and control over API consumption across clients, applications, and customers. The dashboard provides a client-level drill-down, call-origin filtering (MCP vs. direct), and improved handling of internal applications and API keys, enhancing observability, control, and security within API usage management. Client-level insights, origin-based filtering, and internal usage controls collectively improve operational clarity and data accuracy while reducing risk exposure.
Filter API Traffic by Call Origin
The Usage Dashboard supports filtering API traffic by call origin, distinguishing between MCP-originated requests and direct API calls. This capability enables precise analysis of how traffic flows through different access paths, helping measure MCP adoption and identify load distribution. The filter also improves troubleshooting by isolating issues specific to either MCP or direct integrations.
To view the API Usage Details screen,
Select the More Info option next to API Usage
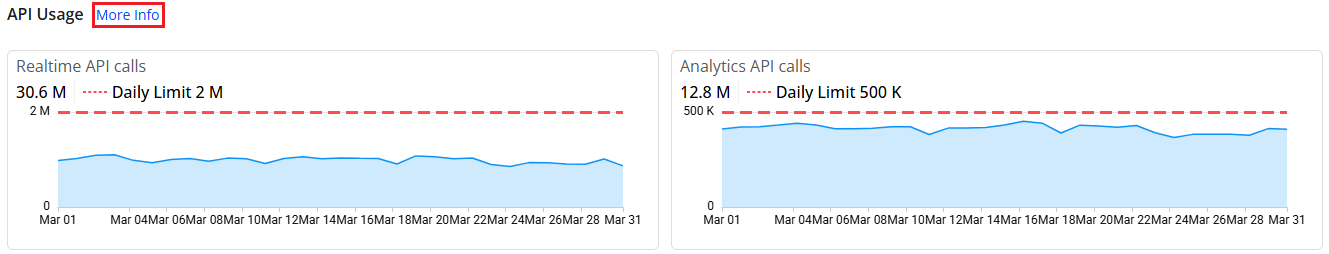
Select the desired view:
-
All (combined)
-
MCP only
-
API only, through the Call Origin filter.
The dashboard updates accordingly to reflect the selected traffic source, providing a detailed breakdown of API usage by:
-
Client Name
-
API client ID
-
Customer Name
This applies to key metrics such as:
-
Realtime API Calls
-
Analytics API Calls
Table View
The Table View toggle in the usage dashboard provides the option to view the data in the tabular column.

Usage dashboard Ended API Usage User Sessions Usage dashboard API Usage Breakdown Application Management Viewer Hours Client Side Total Events Ads Hours Video Concurrent Average Events Per Session Peak Events per API Usage Breakdown Application Management Minute Total FlowsTotal Metrics Plays Ad Concurrent Plays VSI API Usage Breakdown Application Management Usage DPI usage Usage dashboard Realtime API Usage