
Analytics Workbench Dashboard
The Analytics Workbench enables users to build customized visualizations and reports, based on filter settings and a selected set of dimensions and metrics.
Note: The “Viewer Custom Tags” category is available if you have already provided viewer IDs to Conviva using Conviva Sensor, and also submitted subscriber metadata files to Conviva. The “Viewer Custom Tags” category enables you to build more advanced subscriber-related analytics workbench analysis. For more information on the subscriber metadata file requirements and how to create them, contact Conviva representatives.
This dashboard consists of the following areas:
-
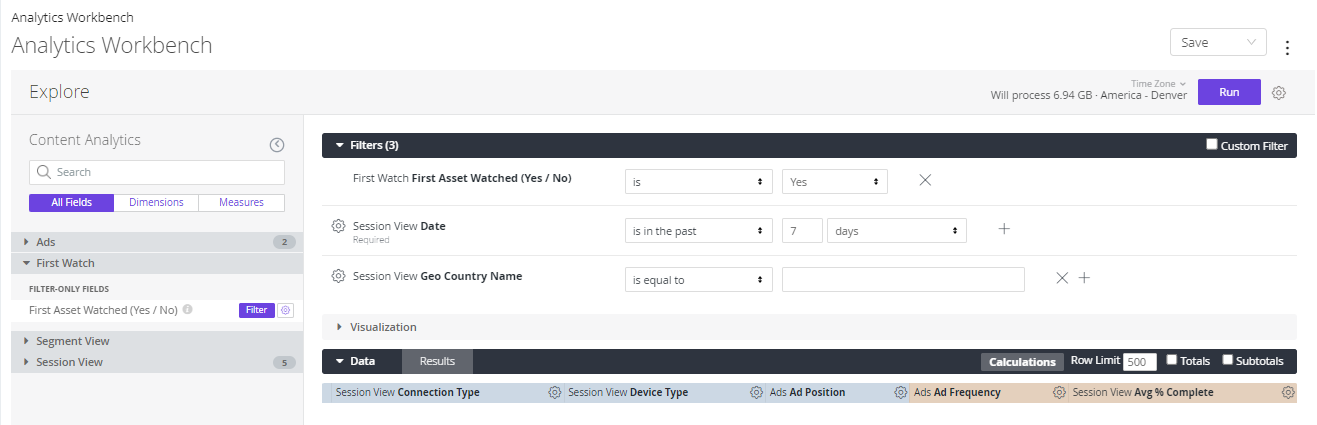
Field Picker: Lists the filter options, dimensions, and measurements (metrics) used to build a custom data set.
Note: If you want to use custom ad dimensions beyond the standard ad dimensions to build more advanced advertising-related analytics workbench analysis, check Filters and Segments for more information.
-
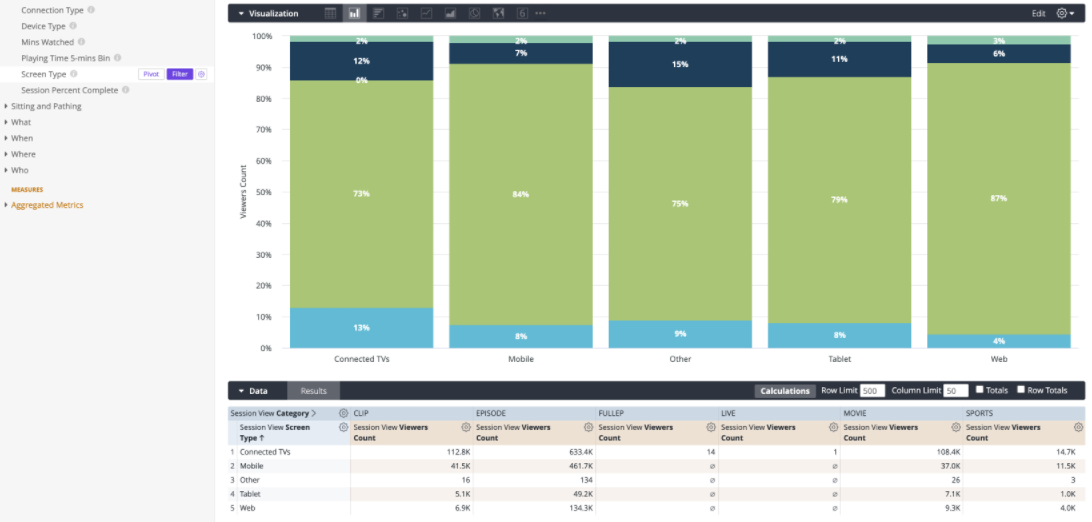
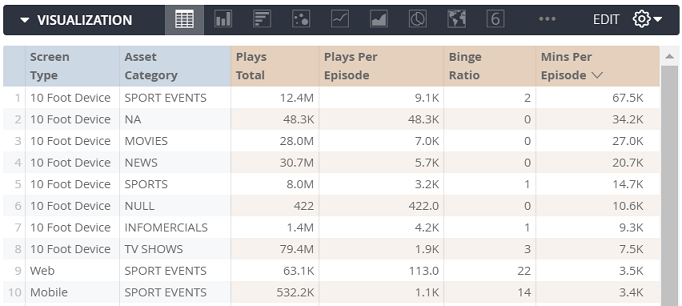
Data Table: After clicking Run, displays the data compile for the specified filter, dimension, and measurement options. The left columns in blue list the dimension values. The right columns in orange show the data values.
-
Visualization: Use the options in the Visualization menu bar to customize the display of the data in the data table.
Commonly Used Terms
| Term | Definition |
|---|---|
| Asset | The content captured as episodic series (For example, Friends or This Is Us). |
| Attributes | The dimensions and measures of session consumption data broken into actionable fields. |
| Calculation or Table Calculation | The function of creating a custom column of manipulated dimensions or measures. |
| Dimensions | The who, what, when, where and how fields of consumption data (For example, name of the series, date and time watched, and so on.). |
| Field | Another term for attribute. |
| Measures | The aggregate metrics calculated from the consumption data (for example, total minutes viewed, count of viewers, and so on.). |
| Pathing | A sequence of up to three, continuously watched content within a single sitting. |
| Segment | A saved collection of viewer households (with ALL of their session data) that have been assembled based on specific consumption criteria (dimension and measure attributes). |
| Series | Synonymous with Asset. |
| Session | The individual viewing of a single content asset (for example, an episode of a series, a movie, or an event). |
| Sitting | An aggregate of all content played by a viewer in succession with no more than 60 minutes (configurable) break between each content played. For more information, see Sitting. |
| Viewer or Viewer Household ID | A deduped viewer map of household or subscriber level content consumption. |
Data Organization
In the Field Picker, the Analytics Workbench organizes the Audience data as All Fields, Dimensions, and Measurements, with Dimensions representing the available metadata and Measurements representing the available metrics.
Note: With the Acquisition category, you can extend the acquisition analysis beyond just the first content session watched. This allows you to do more customized analysis of viewer activity to understand the initial content watched (or any other attribute) to help drive acquisition, retention, and engagement.
For a list of the supported metrics, see Audience Metrics.
| Dimension Category | Example Dimension Values |
|---|---|
| Ads | Ad Position, Ad Sequence within Pod, Advertiser, Campaign, Creative, Placement. |
| Acquisition | Sessions from Acquisition. |
| Segment View | Segment ID, Segment Name. |
| Session View |
Include Unassigned Households (Yes / No). Note: When using the Analytics Workbench to do data analysis on households, be aware that household data often overlaps due to shared conditions. For example, many of the same households may be obtained when using filters for age ranges greater than 18, and less than or equal to 18 because households have members from both age ranges. Additionally, when combining two separate groups of households, the combined total may not reach 100% of the separate household groups due to the variation of demographic attributes across households. |
| Custom Tag | Dimensions passed as custom tags. |
| How | Connection Type, Device Sub Type, Device Type, Playing Time 5-min Bin, and Session Percent Complete. |
| Sitting AND Pathing | Dimensions related to content relative to Sitting and Pathing, such as Sitting Affiliate Current and Sitting Asset Next. |
| What | Ads, Affiliate Name, Brand, Channel Name, Episode Name, Episode Number, Session Number, and Series Name. |
| When | Content Start Time (local time), Date, Day of Week, Day of Week String, Day String, Content Hour (local time), Month, Short Month. |
| Where | DMA, DMA Number, Geo City, Geo City Name, Geo Country, Geo Country Name, Geo DMA Name, Geo State, and Geo State Name. |
| Who | Unique ID and Viewers Completed Content. |
Visualizations and Data Reports
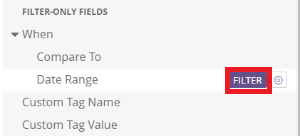
Use the Field Picker to create data tables, visualizations, and reports. Click a dimension or metric name to add it to the data table. Click the Filter icon next to a dimension, metric name, or filter-only field to add and remove filter conditions. The Date Range filter is automatically applied.
The Analytics Workbench applies filtering conditions and data table display options independently, so that the dimensions and metrics can be used as only filters, filters and data table entries, or only data table entries. Click the dimension and metric names to add and remove them to the data table. Click the Filter icon next to the dimension or metric name to add and remove filtering conditions.
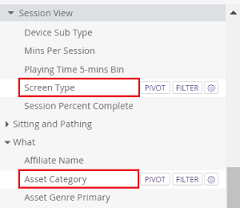
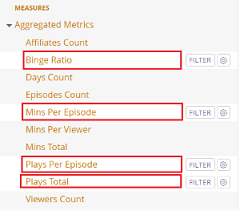
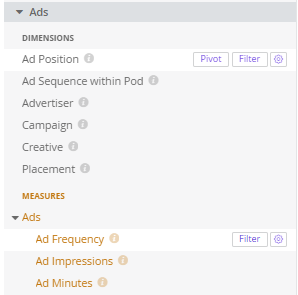
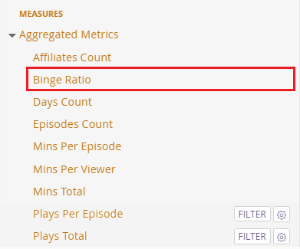
For example to build an analysis of dimensions (screen type, asset category) with metrics (Binge Ratio, Mins Per Episode, Plays Per Episode, and Plays Total), click these options.
Dimensions
Metrics
Ad dimensions and metrics are available in the Ads option.
Click Run to generate this data.

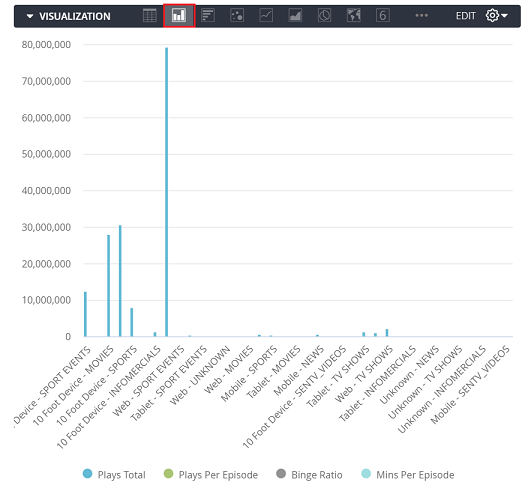
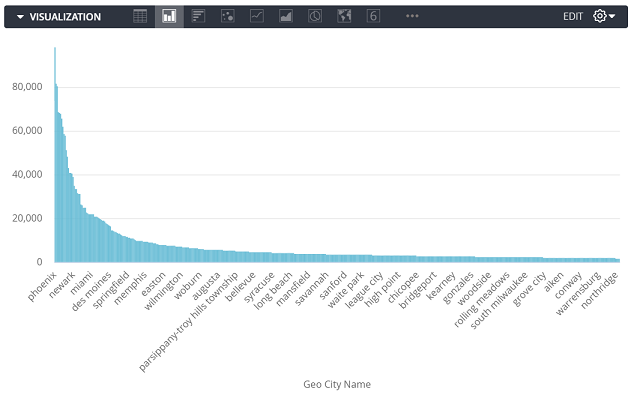
To display the data in another visualization, click a visualization icon, such as the bar chart.
Creating Visualization or Data Report
To create a visualization or data report:
-
In the Field Picker, click Filter icon next to desired filter settings. Filter settings specify the time range and custom tag values.
-
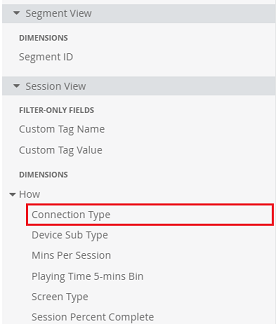
Click the dimension names to add them to the data table. Click the Filter icon next to the desired data dimension add it with filter conditions. Dimensions represent the data categories for which data is displayed. Click a selected dimension name to remove it from the data table.
-
Click the metric names to add them to the data table.
-
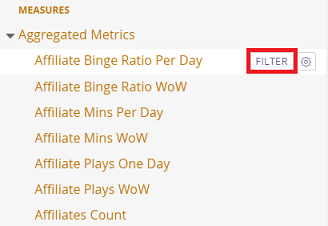
Click the Filter icon next to the metric to add it with filter conditions. Metrics represent the Audience data measures applied to the dimensions.
Tip: To remove a metric name from the data table, select the metric and click it.
-
Click Run to generate the data.
- Data based on the selected filter settings, dimensions, and measurement metrics appear in the data table.
- Use the gear icon to manage the dimensions and data added to the data table.
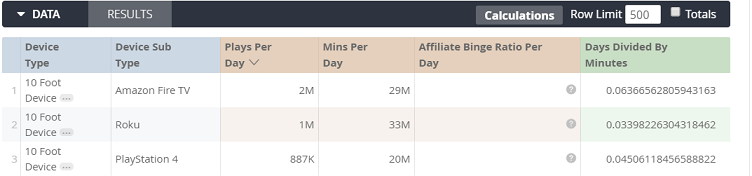
Note: If a dimension that of numeric type has a value of ∅, in general, that means "not available".
-
In the Visualization menu bar, select a visualization option from the following:
- Bar Chart, stacked requires pivot
- Pie Chart, single dimension for pie chart, multi-level
- Bubble Chart
- Line Chart
- Area Chart
- KPI Chart
-
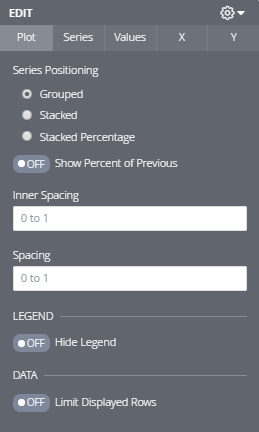
Use Edit in the Visualization menu to customize the visualization settings.
-
To save the generated data, click the Save button and specify a name and description.
The Saved Analysis menu with a list of the saved data files is displayed.
-
To schedule the generation and delivery of reports, hover the mouse over the kebab (3-dot) icon and select Schedule.
-
Enter a schedule name, typically describes the data and report frequency, such US-WeekendShows-Monthy.
- Choose if you wan to send the report as an E-mail or upload to Amazon S3.
- Choose either of the options based on your selection in the previous step.
- If you select the email option, fill out the receiver’s email address and optional text in the email.
- If you select the Amazon S3 option, fill out the S3 details, such as bucket, and optional path.
-
Set the data of format. Currently, only .CSV format is supported.
-
Set the recurring delivery schedule dates and time.
-
Select the time zone for the scheduled dates and time.
-
Choose either of the advanced options.
-
Results in Table: choose this to send the results in the table
-
All results: choose this to send all results including the results that are not in the table
Note: If you created new data columns based on calculations, the All results option is not available. To make the option is available, delete the table calculation from Custom Fields at the left side of the page.
-
-
Click Send Test to generate a sample report, E-mail it, and verify the E-mail delivery.
-
Click Save All to apply the settings.
-

Example Visualizations
This example visualizes these analysis:
Series and Episode Analysis
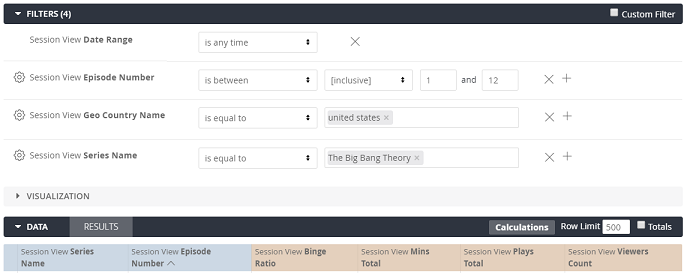
This example shows the settings to generate viewer data that is filtered for a specific series and episode range within the United States.
Filters: Date Range, Episode Number, Geo Country Name, Series Name
Dimensions: Series Name, Episode Number
Metrics: Binge Ratio, Mins Total, Plays Total, Viewers Count
Content Licensing Analysis
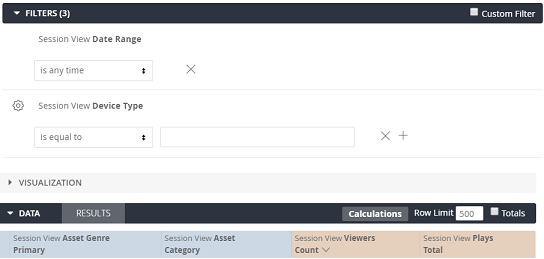
This example shows the settings to generate viewer data filtered by device type to analyze content licensing decisions.
Filters: Date Range, Device Type
Dimensions: Asset Genre Primary, Asset Category
Metrics: Viewers Count, Plays Total
Advanced Display Features
Use these advanced Analytics Workbench features to enhance the data display and correlations:
For a description of the supported functions and operations, see Analytics Workbench Functions and Operations. You can also enter a formula name in the Calculation field.
Pivots
Adding a Pivot to a dimension in the data table segments that data column into separate columns for each of the available dimension values. For example, adding a Pivot to the Day of Week dimension segments that column in the data table in to separate columns for each day of the week.
Data Table Before Pivot (Single Day of Week Column)

Data Table After Pivot Added to Day of Week Dimension (Breakout of Day of Week Column)
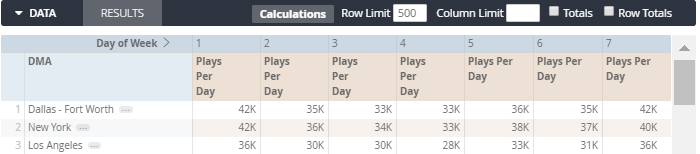
Table Calculations
The Calculations feature enables you to create new data columns based on specified calculations between two or more existing columns.
To create new data columns based on calculations:
-
Click Calculations.

-
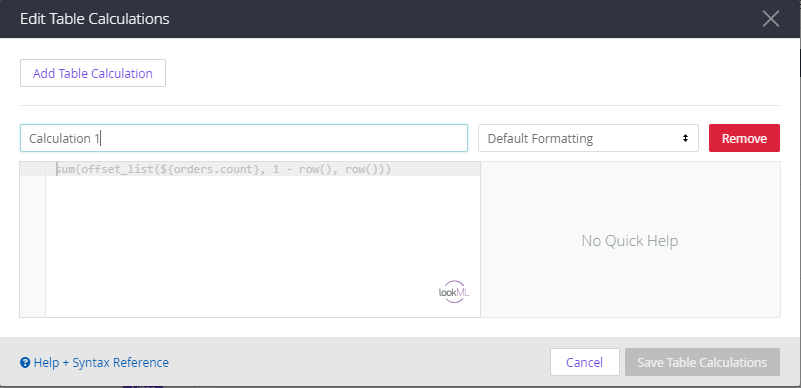
Enter the spreadsheet-like formula. Click in the formula area to scroll through a list of standard formulas. Formulas can be based on strings, mathematical equations, logical equations, and date and time.
This example divides the data in the number of Plays Per Days column by the data in the Min Per Day column.
Note: For more information about formulas, click the Help+Syntax Reference link.
-
Click Save Table Calculations. A column appears with the calculated data.

Note: You can only schedule the generation and delivery of results in the table if you created new data columns based on calculations. To schedule the generation and delivery of all results, delete the table calculation from Custom Fields at the left side of the page, set the schedule configuration, and then do the schedule.
Viewing the Output
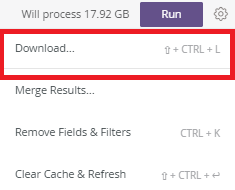
- In the Settings menu, click Download to view the output.
- Select the format option to generate the output as text (tab-separated), Excel spreadsheet, CSV, JSON, HTML, Markdown, PNG (image file).
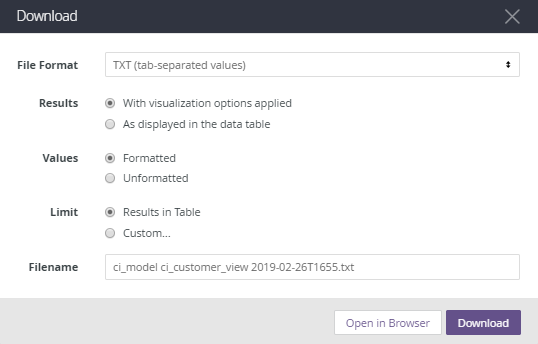
Data can be downloaded or viewed directly in a browser.