
What's New in Audience
Audience
 2023 Releases: Filter and Segment Enhancements, Viewer Analysis, Advertising Capabilities
|
Filter and Segment Enhancements
Viewer Analysis Advertising Capabilities |
2022 Releases: Viewer Analysis (Acquistion/Retention), Audience Module, Advertising Capabilities, Improved Identity Levels
|
Viewer Analysis |
Advertising Capabilities Audience Module |
Analytics Workbench Enhancements UI Updates |
Filter and Segment Enhancements |
January 18, 2024
Rename Viewer Insights
|
|
Feature Update:
Rename Viewer Insights to Audience.
Feature Impact:
Replace all instances of the term Viewer Insights in the UI with Audience.
More Details: Audience Help
November 16, 2023
New Children Age Ranges
|
Feature Update:
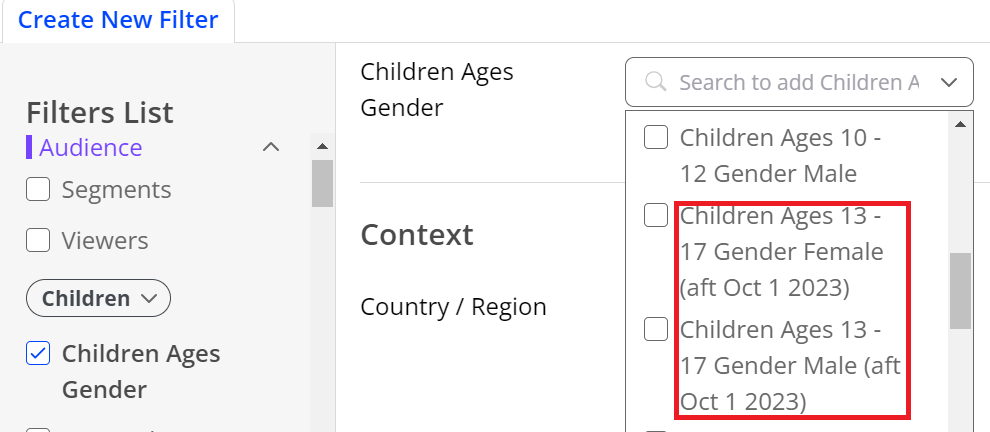
Adds several children age ranges in the Filter Builder, Segment Builder, and Analytics Workbench to keep consistent with the new teenager age definition that is from previous 13-18 to 13-17. This feature enables you to track data related with the teenagers starting from October 1, 2023.
Note: Viewer Insights does not support track the data related with the previous age definition 13-18 from October 1, 2023.
Feature Impact:
Adds these children age ranges:
-
Children Ages 13 - 17 (aft Oct 1 2023), Children Ages 13 - 17 Gender Female (aft Oct 1 2023), and Children Ages 13 - 17 Gender Male (aft Oct 1 2023) to the Children Ages Gender list under Children of the Audience condition in the Filter Builder and Segment Builder.
-
Children Ages 13 - 17, Children Ages 13 - 17 Gender Female, and Children Ages 13 - 17 Gender Male to the Children Ages Gender list under Children of the Audience condition in the Analytics Workbench.
Use Cases:
To analyze details about teenager viewers, such as the top content they watched, and the resident demographics, apply the filter with Children Ages 13 - 17 (aft Oct 1 2023) along with other filter conditions such as the country name.
More Details:
Filters and Segments, Analytics Workbench Dashboard
July 20, 2023 
Server-Side Subscriber Metadata Ingestion
|
Feature Update:
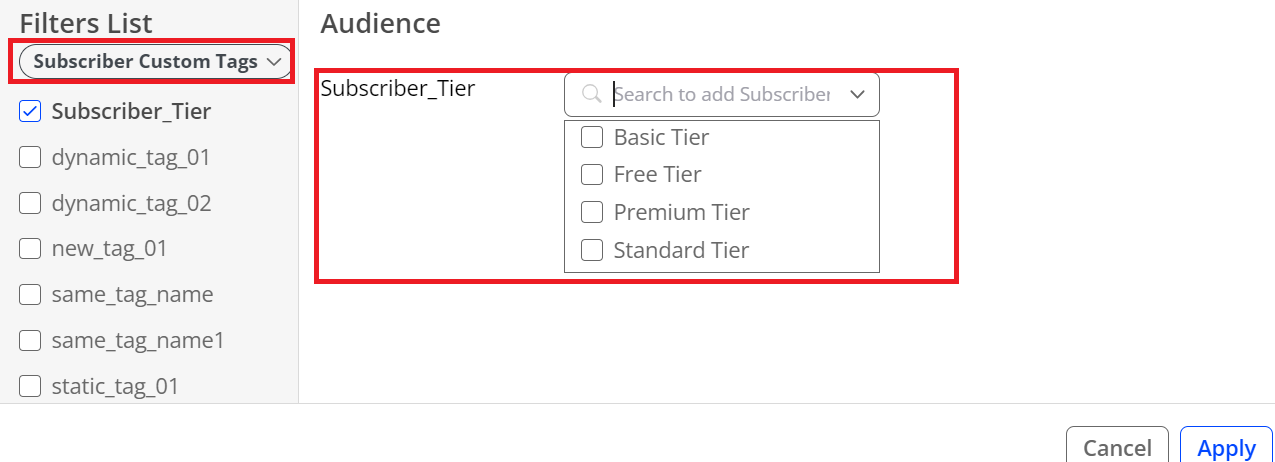
Adds support to ingest server-side subscriber metadata and append the static and dynamic attributes to the subscriber ID, known as the viewer ID. A new category “Viewer Custom Tags” in Filter/Segment Builder and Analytics Workbench displays these attributes and enables deeper analysis toward subscribers.
-
Static attributes: attributes remain unchanged for a given subscriber, such as Traditional Pay TV Younger.
-
Dynamic attributes: attributes change over time. For example, Subscriber Tier, as subscribers can change their tier over time.
Note: Viewer is the configurable label for viewer ID, and by default, the configurable label is subscriber. For configuring a label, contact your Conviva representative.
The subscriber metadata ingestion capability can also be used to ingest Publishers' custom segments into Viewer Insights. Publishers can create a server-side custom attribute to tag subscribers based on established segments, for example, High Income Subscribers. They can then set up the custom tag criteria in the Segment Builder to create the segment in Viewer Insights. This enables Publishers to analyze their own custom list of subscribers within Viewer Insights.
Note: Customers need to contact Conviva representatives for further details on the subscriber metadata ingestion setup process.
Feature Impact:
-
In Filter/Segment Builder, adds a new category “Viewer Custom Tags” to the “Demographic” drop down list under the “Audience” field.
-
In Analytics Workbench, adds a new category “Viewer Custom Tags” to the “Audience” dimension.
Use Cases:
Publishers can now effortlessly pass their server-side subscriber attributes and segments to Viewer Insights without requiring any client-side effort. These subscriber attributes are valuable for various use cases, including driving engagement, acquisition, retention, and monetization. Examples include:
-
Subscriber Lifetime Value: Analyze popular content among high lifetime value subscribers to influence content strategy decisions.
-
Subscriber Cancellation Date: Analyze content watched by subscribers just before cancellation to win them back with relevant content promotions.
More Details:
Filters and Segments, Analytics Workbench Dashboard
June 1, 2023 
Enhanced Ad Impact Analysis with Ad Reach Data on the Ads Detail Page
|
Feature Update:
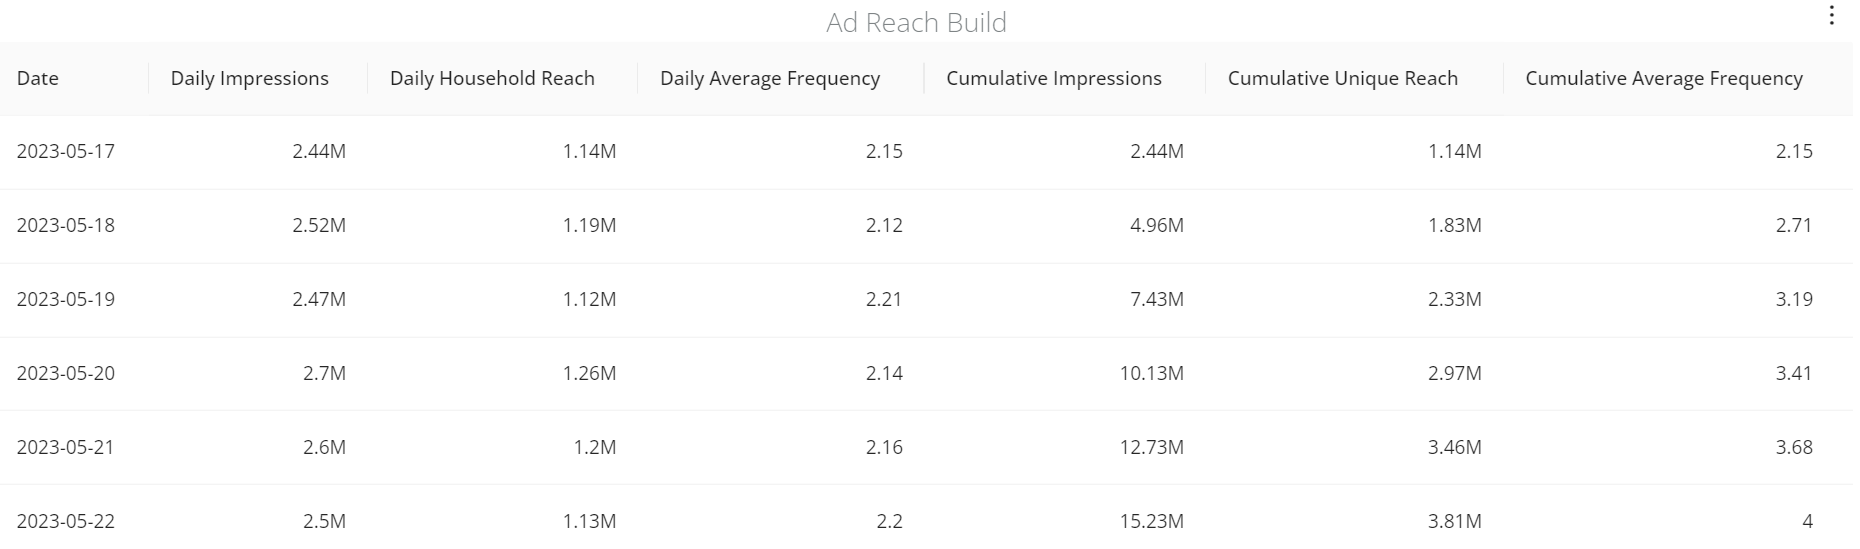
Adds the Ad Reach Build table on Ads Detail Page to display the ad reach data for each day within the specified date interval, such as cumulative impressions and cumulative unique reach. You can download the table as a CSV file for further analysis or reporting in another tool. This feature allows you to easily access cumulative ad reach data broken out by date ranges.
Note: The Ad Reach Build table is limited to displaying a maximum of 31 days of data.
Feature Impact:
Adds the Ad Reach Build table on Ads Detail Page of the Ads dashboard.
Use Cases:
Enables you to quickly access ad reach data so you can report ad reach build metrics to your advertiser clients, such as cumulative impressions, cumulative unique reach and cumulative frequency.
More Details:
May 18, 2023 
Added New Fields to Enhance Viewer Acquisition Analysis in Analytics Workbench
|
Feature Update:
-
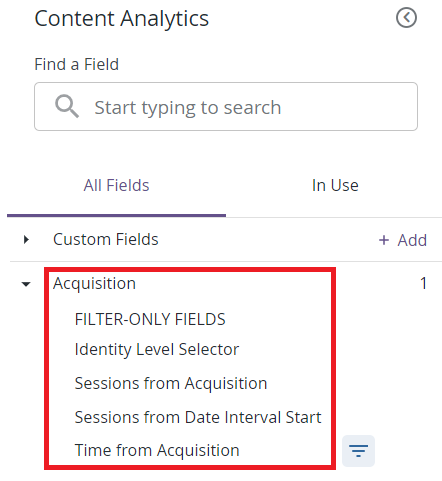
Renames the First Watch section in Analytics Workbench to Acquisition and adds these filter-only fields under the renamed section.
-
Identity Level Selector: This field enables you to apply the selected viewer identity level, such as Household, viewerID, and App, to the other filter-only fields under the Acquisition section. If this filter is not applied, the default viewer identity level used for the other Acquisition fields will be the configured primary ID for the c3 account.
-
Sessions from Acquisition: With this field, you can filter the sessions watched by new viewers based on the number of sessions relative to their acquisition time. This filter cannot be used in combination with any other filter under the Acquisition section other than the Identity Level Selector field.
-
Time from Acquisition: This field allows you to filter sessions watched by new viewers based on the number of minutes relative to their acquisition time. This filter cannot be used in combination with any other filter under the Acquisition section other than the Identity Level Selector field.
-
-
Removes the First Watched field under the Acquisition section in Analytics Workbench because you can achieve the same function using the Sessions from Acquisition field with the expression ‘= 1’ along with the Identity Level Selector field.
-
Renames the First Session in Date Interval field under the Acquisition section in Analytics Workbench to Sessions from Date Interval Start. With this field, you can obtain the sessions watched by viewers based on the number of sessions relative to the start of the selected date interval. This filter cannot be used in combination with any other filter under the Acquisition section other than the Identity Level Selector field.
Feature Impact:
-
Renames the First Watch section in Analytics Workbench to Acquisition and adds three filter-only fields under the renamed section: Identity Level Selector, Sessions from Acquisition, and Time from Acquisition.
-
Removes the First Watched field under the Acquisition section in Analytics Workbench.
-
Renames the First Session in Date Interval field under the Acquisition section in Analytics Workbench to Sessions from Date Interval Start.
Use Cases:
With the enhancement, you can extend the acquisition analysis beyond just the first content session watched. This allows you to do more customized analysis of viewer activity to understand the initial content watched (or any other attribute) to help drive acquisition, retention, and engagement. For example, you can gain insights on:
-
The top content that your subscribers are latching onto in the first 48 hours and broadly promote that content to drive further acquisition of new subscribers or drive engagement and retention of existing subscribers.
-
Each subscriber’s content preference during the initial acquisition period and then activate that data for content recommendations or win-back campaigns.
More Details:
April 20, 2023 
Enhanced Local Time Zone Dimensions
|
Feature Update:
-
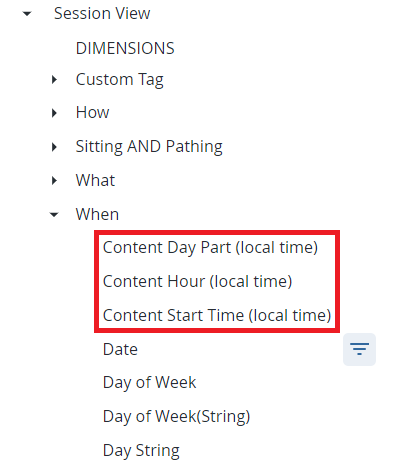
Adds a new Content Hour (local time) dimension under the When category of Session View in Analytics Workbench. The new dimension enables custom analysis of content by the hour of the day. The range of Content Hour (local time) dimension is from 0 to 23. For example, a value of 3 means that the content started between 3 a.m. and 4 a.m. based on the viewer’s device local time.
-
Renames these local time dimensions and adds tooltips for them to clarify the dimension meaning.
-
Day Part to Content Day Part (local time) in Filter Builder, Segment Builder, and Analytics Workbench.
-
Session Start Time to Content Start Time (local time) in Analytics Workbench.
-
Feature Impact:
-
Adds a new Content Hour (local time) dimension under the When category of Session View in Analytics Workbench.
-
Renames Day Part to Content Day Part (local time) in Filter Builder, Segment Builder, and Analytics Workbench.
-
Updates Session Start Time to Content Start Time (local time) in Analytics Workbench.
Use Cases:
-
Understand the VOD content consumed at different hours of the day to help drive live program scheduling decisions in a way that optimizes engagement.
-
For multi-hour live events, especially tentpole sporting events with pre-game and post-game content, understand the audience reach each hour by households, subscribers, devices and/or apps to help plan ad inventory for future similar live events and/or report back measurement to advertisers.
More Details:
Basics, Filters and Segments, Analytics Workbench Dashboard
New Behavioral Segments to Analyze Password Sharing

|
Feature Update:
Adds two new pre-configured behavior segments, All Shared Subscription HHs and Non-Primary Shared Subscription HHs, to support password sharing analysis for Audience Module customers.
Feature Impact:
Adds new pre-configured behavior segments to the Segment Builder and Segment Management to analyze password sharing.
Use Cases:
Publishers with a subscription service can now measure the size and behavior of high probability, active password sharing households. With this data they can decide on potential actions to convert password sharers to paying customers. The subscriber IDs associated with the password sharing households can furthermore be exported to target corrective actions.
More Details:
April 6, 2023 
Enhanced Viewer Acquisition Analysis in Analytics Workbench
|
Feature Update:
-
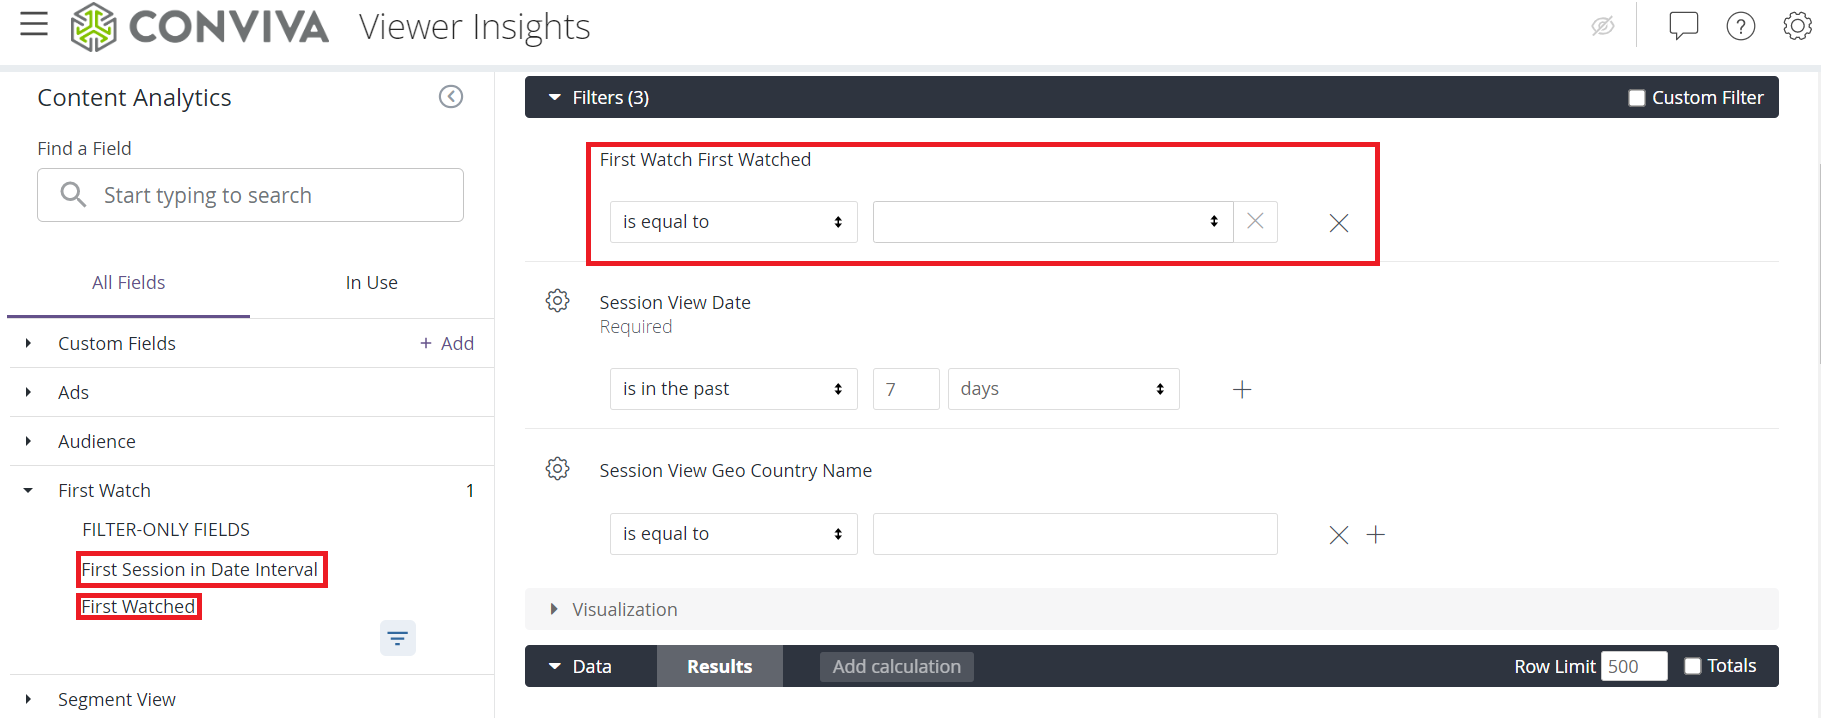
Adds a new First Watched field in Analytics Workbench to filter the very first session watched by a viewer, taking into account the full set of historical data which is typically maximum of 13 months, provided that the very first watched session occurred during the selected date interval. First Watched can filter viewer-level data when viewers' very first watched sessions occurred in the specified period. When applying this filter, you may select the type of viewer from the available viewer identity levels: Household (Stream ID, Subscriber (Viewer ID) or App (Client ID).
-
Renames the First Asset Watched (Yes / No) field to First Session in Date Interval in Analytics Workbench to clarify the selected data. The First Session in Date Interval field enables you to select the first sessions watched by viewers in the selected date interval. The First Session in Date Interval field filters session-level data within the specified period.
Feature Impact:
-
Adds a new First Watched field in Analytics Workbench.
-
Renames the First Asset Watched (Yes / No) field to First Session in Date Interval in Analytics Workbench.
Use Cases:
The First Watched field enables custom analysis on the behavior and attributes of new viewers in order to help drive further acquisition. Some examples of custom viewer acquisition analysis from the Workbench that are not possible from the Viewer Acquisition page are:
-
Understand the top shows first watched by new viewers within a custom time range such as the last 10 days to gauge the effectiveness of a promotion that ran within that specific period.
-
Identify the shows driving the least acquisition by listing all shows first watched by new viewers and sorting in descending order based on number of subscribers.
More Details:
Configurable Label for Viewer ID Identity and Metrics
|
New Feature:
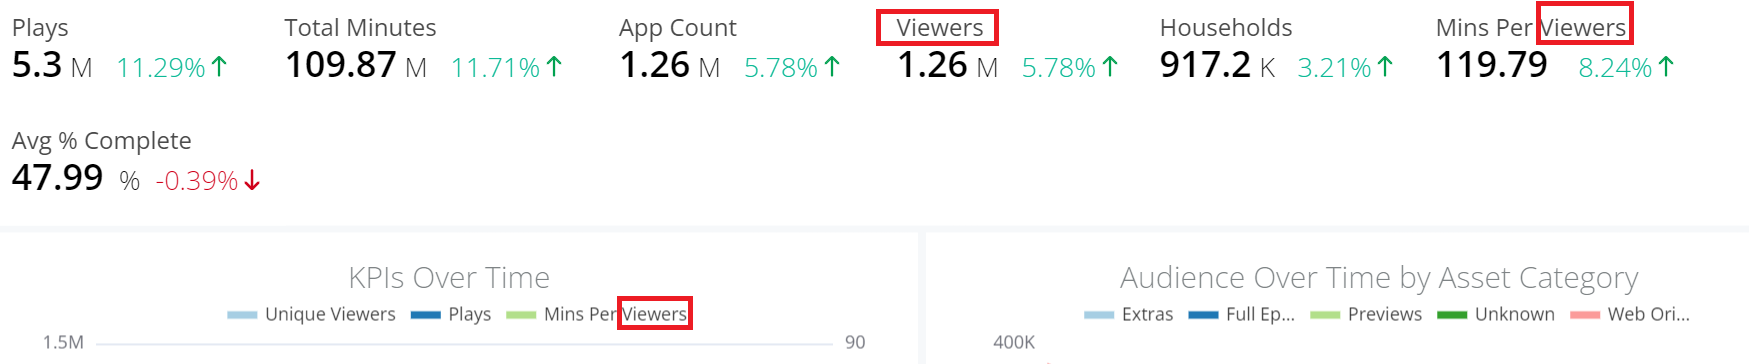
Adds support to configure a label for the Viewer ID identity and related metrics at the c3 account level. The default value for the label is Subscriber but you can configure it to any desired label, up to a maximum of 12 characters.
Note: For configuring a label, contact your Conviva representative.
Feature Impact:
After configuring the label Subscribers, for example, change Subscribers to Viewers, the label for the subscriber level metrics as well as the label for the identity level for viewer IDs used by subscribers is Viewers on all Viewer Insights pages and Analytics Workbench.
Use Cases:
In some companies, the subscriber count is considered a sensitive metric with different connotations hence that label may lead to significant confusion. Configure the label to prevent the confusion, for example, configure the label to Viewers.
More Details:
March 9, 2023 
Enhanced Ads Dashboard
|
|
Feature Update:
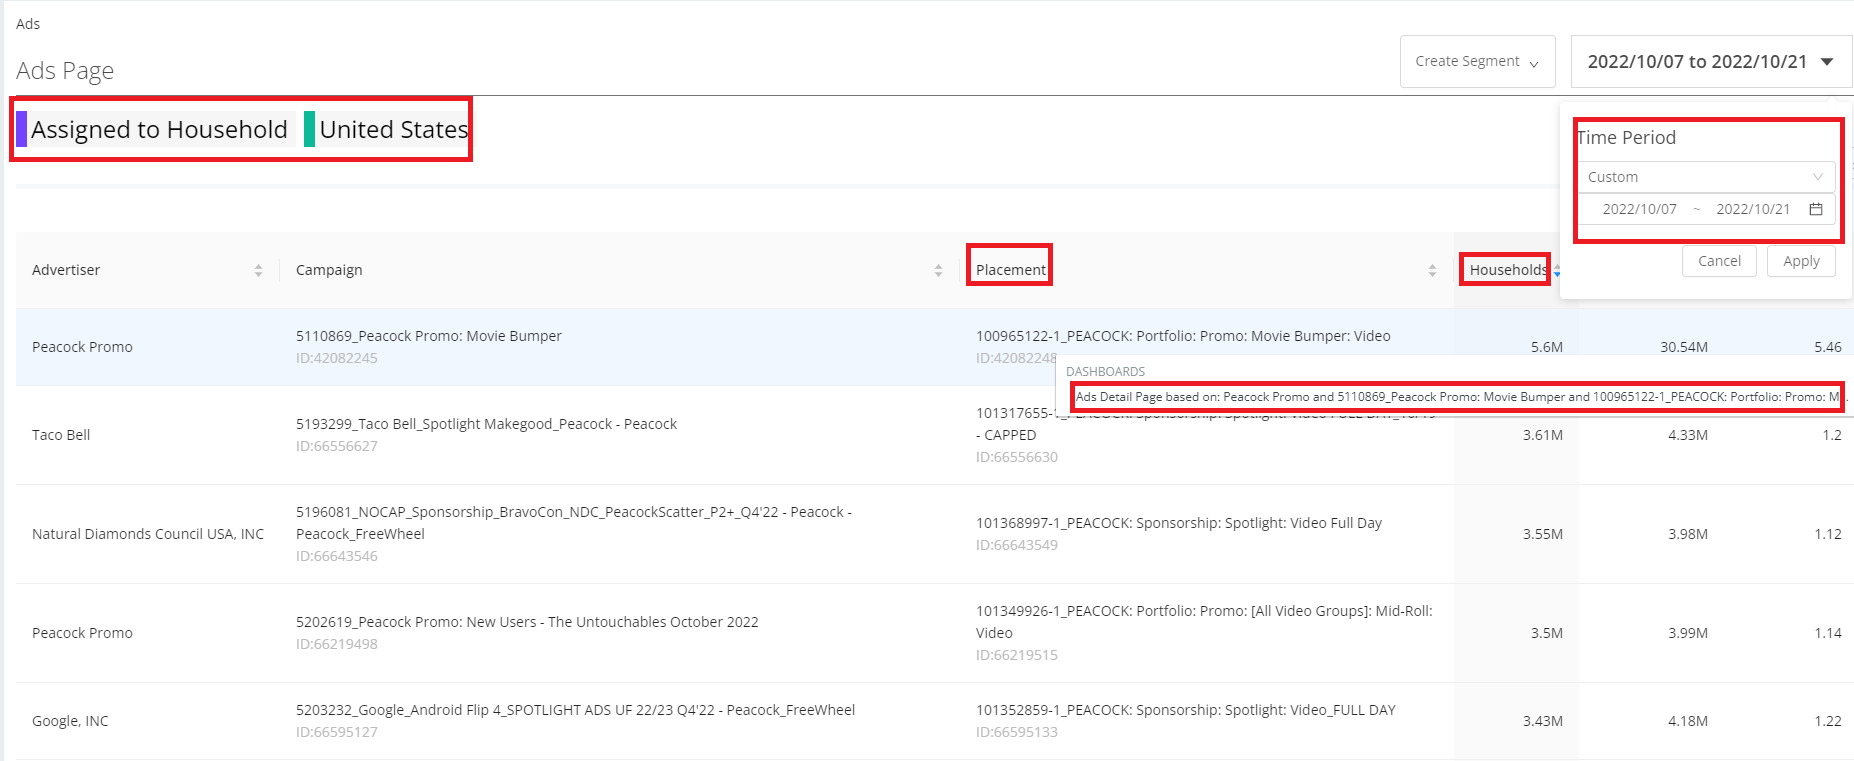
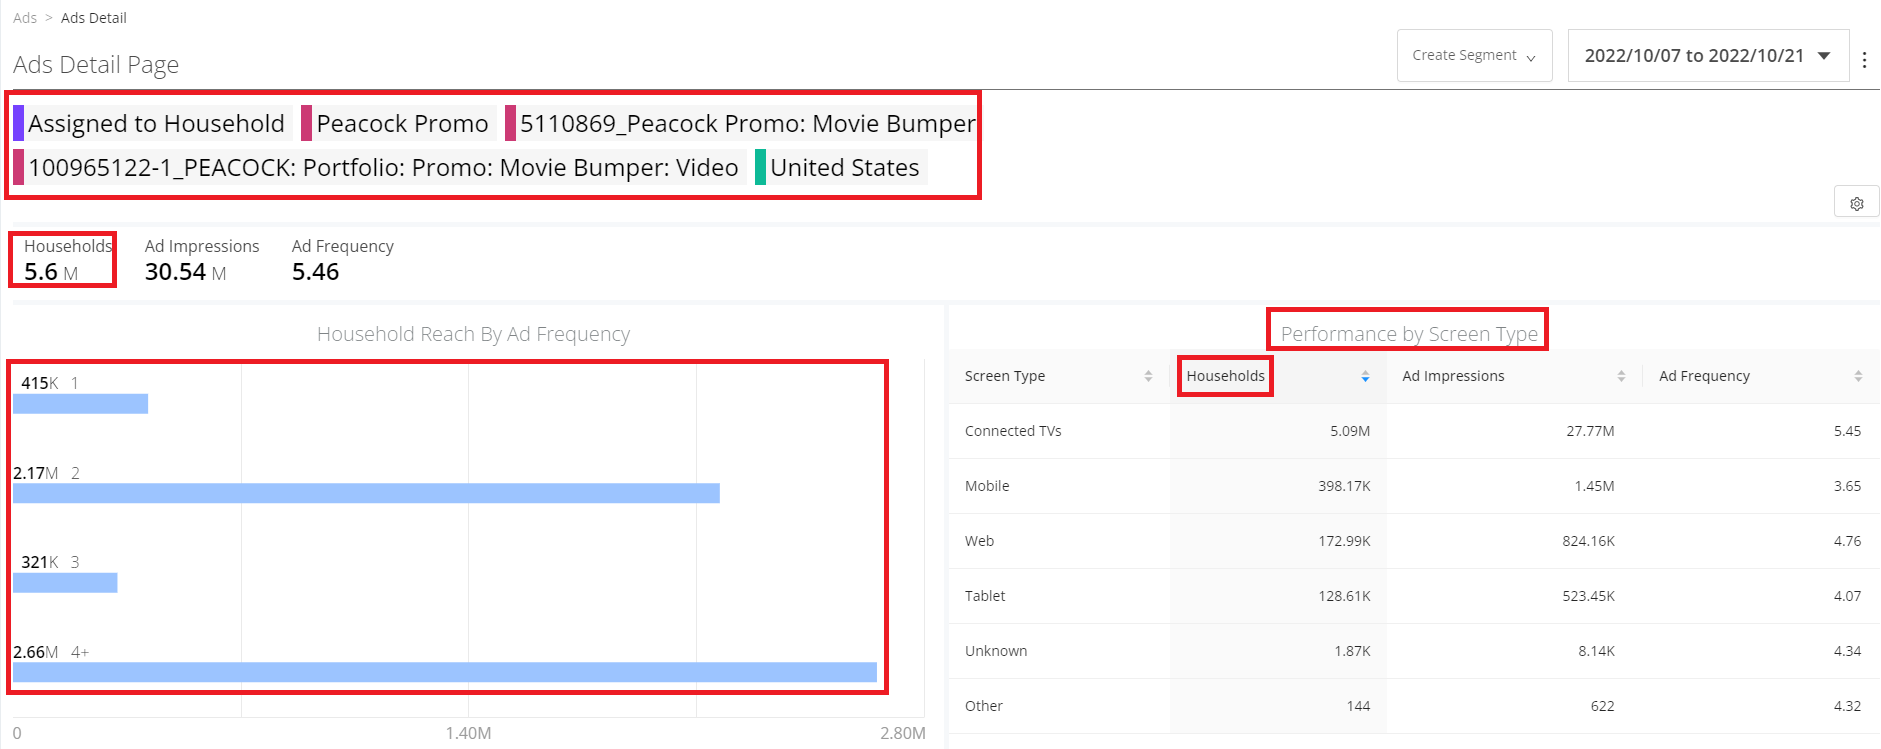
Adds new features to the Ads page and the Ads Details page so you can more effectively determine the overall effectiveness of the delivered ad placements and measure target audience reach.
-
Filter consistency with other VI pages.
-
More Date Picker options, such as Last Month and Custom.
-
Downloads, sends, and schedules page exports.
-
Sorts table columns in ascending or descending order.
-
Modifies the reach metric to either households, subscribers or apps based on the primary ID configuration.
-
For the Ads page, renames to Ads Campaigns page to Ads page; renames the Line Item column to Placement; supports row drill down from advertiser, campaign, and placement.
-
For the Ads Details page, supports drill-downs from the Ads page and adds the drill-down source to the current filter; renames Campaign Performance by Screen Type option to Performance by Screen Type, and moves the title to above the related table; updates the Household Reach by Frequency widget display to include frequency distributions in rows 1, 2, 3, and 4+; and moves the Household Demographics widget to the right of the Resident Demographics widget.
Feature Impact:
For both the Ads page and the Ads Details page:
-
Improves the effectiveness of ad analysis with metrics by specific identity level, enhances filter options, clarifies field naming, and other updates.
Use Cases:
With the enhanced Ads dashboard, you can quickly get the required data that helps you determine the overall effectiveness of the delivered ad placements and measure target audience reach across identity levels. For example, from the Ads page, drill-down from an ad campaign to quickly analysis campaign performance in the Ads Details page.
More Details:
Ads Dashboard, Ad Details Page
Default Audience Category
|
Feature Update:
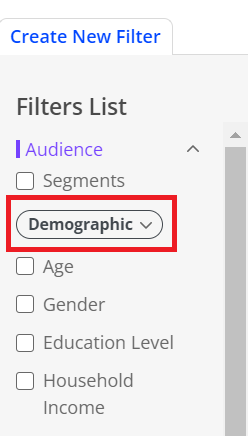
Changes the default Filter and Segment category of Audience attributes to Demographic.
Feature Impact:
Updates the default category selection of Audience attributes to Demographic in the Filter Builder and Segment Builder.
Use Cases:
With this enhancement, you can quickly apply Demographic attributes to filters and segments.
More Details:
Increase the Maximum Number of Cohorts
|
Feature Update:
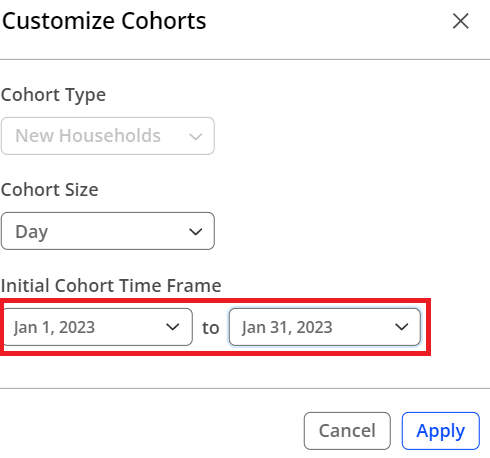
In the Viewer Acquisition page, increases the maximum number of cohorts from 25 to 31.
Feature Impact:
Expands the limit of maximum number of cohorts to 31 in the Viewer Acquisition page.
Use Cases:
With this enhancement, you can check viewer acquisition data of all days within a 31-day month.
More Details:
February 13, 2023 
New Metric and Enhanced KPI Bar

|
New Features:
-
Adds the new Daily Average Frequency metric to Segment Builder, so you can analyze the impact of ad frequency on viewer experiences.
-
On hover, displays the full unrounded metric values in each KPI bar.
-
Updates the Overview dashboard KPI bar to display the Ad Minutes metric.
Feature Impacts:
-
Adds Daily Average Frequency as a metric to the Ad Impact tab of Segment Builder.
-
Updates the UI so hovering over a metric value displays the full unrounded value in each KPI bar.
-
Updates the Overview dashboard KPI bar to display the Ad Minutes metric.
Use Cases:
To analyze the impact of ad frequency on viewer experiences, create a segment using the Daily Average Frequency metric along with other metrics, such as Ad Load, in Segment Builder.
More Details:
Metrics, Advertising Capabilities in Viewer Insights
January 17, 2023 
Does not Contain Advanced Filter Setting
|
New Feature:
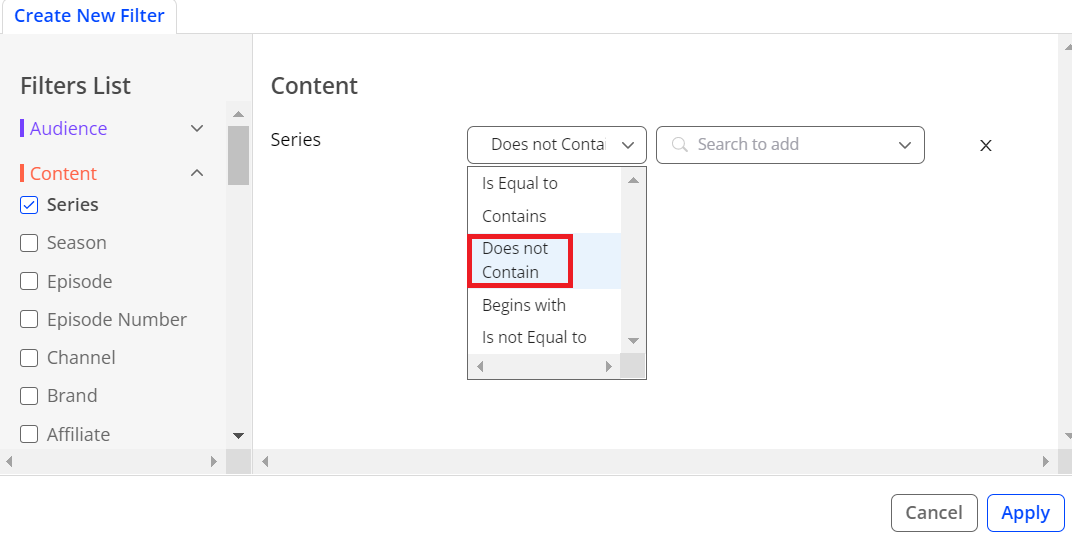
Enhances the advanced setting of filters with a new comparison called Does not Contain when creating new filters.
Feature Impact:
Adds a new comparison called Does not Contain in the drop down list when setting filters in the advanced mode.
Use Cases:
With this feature, you have more ability to control the content filtering. For example, you can use Does not Contain item to remove trailers from the contents when you only want to analyze the feature films.
More Details:
Percent Range for Demographic Attributes within Households in Filter/Segment Builder
|
New Feature:
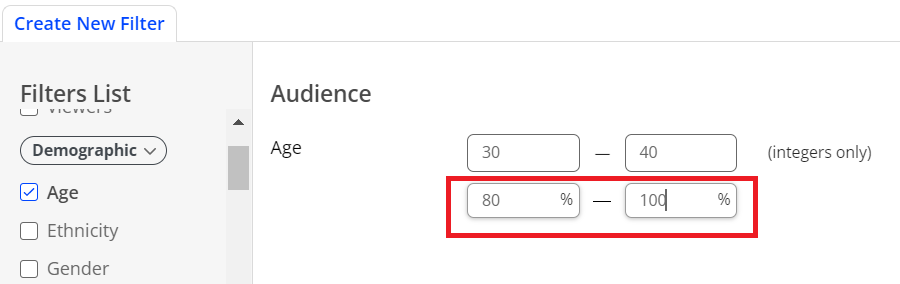
Adds the percentage composition range to enhance the filter and segment settings for demographic attributes within households when creating new filters and segments.
You can use the percentage composition range for individual resident-level demographic attributes such as Age, Gender, Education Level, and Marital Status.
Feature Impact:
Adds the percentage composition range for values of demographic attributes within households when creating new filters and segments.
Use Cases:
With this feature, you can set percentage composition ranges for values of demographic attributes to get more specific data and do deeper data analysis based on the data. For example, set the percentage composition range for bachelor's degrees as 100% to 100% to focus viewer analysis on viewers who are from a household where all people own bachelor's degrees.
More Details:
2022 Releases
December 15, 2022 
Residential Devices Metric and Dimension
New Metric in the KPI Bar

|
New Dimension in the Analytics Workbench
|
New Feature:
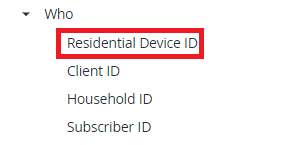
Adds the Residential Devices metric to the KPI tool bar and Analytics Workbench, as well as adds the Residential Device ID dimension to the Analytics Workbench.
The new metric Residential Devices helps you understand the deduplicated count of unique devices used in the current data. For deduplicated count, only devices associated with residential households are included in the count. Devices not associated with residential households, for example, devices that have been purely on cellular or commercial properties, are not be included in the Residential Device count.
In the Analytics Workbench, use the Residential Devices metric and the Residential Device ID dimension to build analytics workbench analysis related to residential devices.
Feature Impact:
-
Adds a new metric Residential Devices to the KPI bar, so you can more easily view the number devices used by the audience along with the percentage change of device use.
-
Adds the Residential Devices metric to the Aggregated Metrics list and a new dimension Residential Device ID to the Session View list in the Analytics Workbench.
Use Cases:
With this feature, you can check the deduplicated count of unique devices used in the current data from the KPI bar and do deeper data analysis based on the data.
More Details:
Download Viewer Retention Data
|
New Feature:
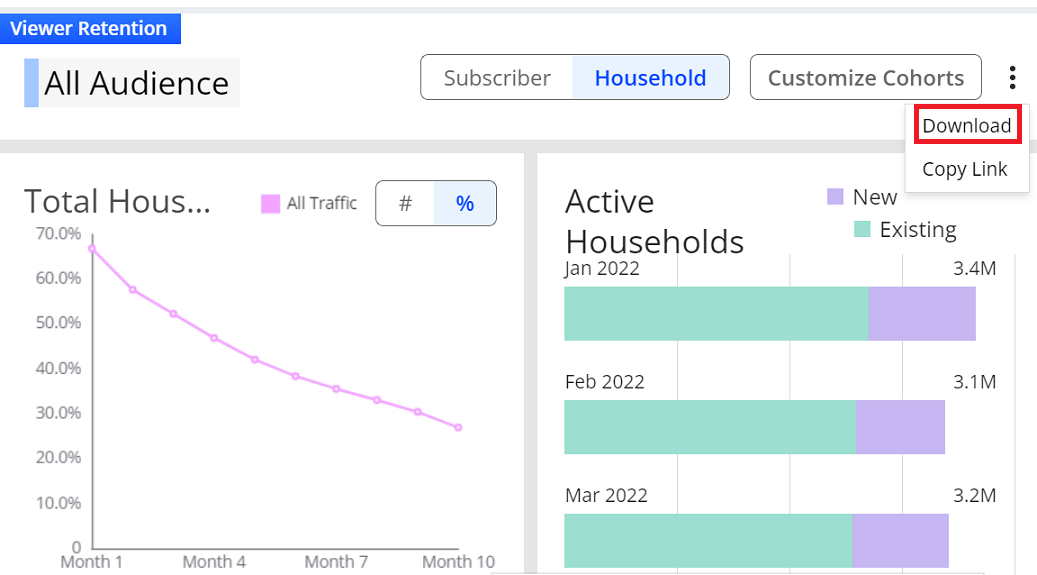
Adds support to download data from the Viewer Retention dashboard. You can click Download from the kebab icon to get the Viewer Retention dashboard data.
Feature Impact:
Adds the Download option to the kebab icon.
Use Cases:
With this feature, you can download data from the Viewer Retention dashboard for ingestion into other systems, such as marketing tools, or sharing with other stakeholders.
More Details:
November 17, 2022 
Subscriber and Household Identity Levels in Dashboards and Filters
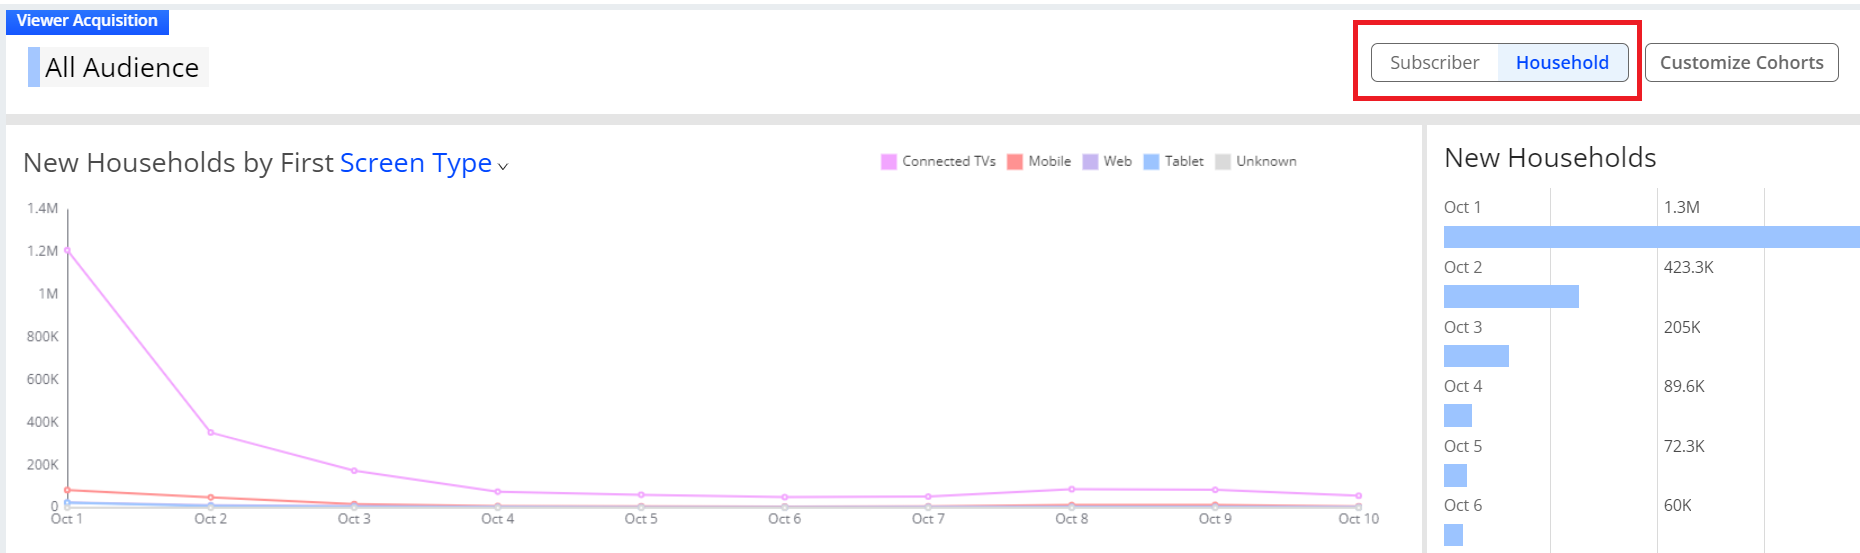
|
New Feature:
-
Adds a Subscriber-Household toggle to the Viewer Acquisition and Viewer Retention dashboards. This new toggle expands the analysis options of viewer acquisition and retention patterns to both subscribers and households.
-
Adds a Subscriber-Household toggle to the First Stream filter. This new toggle expands the options of the First Stream filter to both individual subscribers and entire households.
Feature Impact:
Enhances the Viewer Acquisition dashboard and the Viewer Retention dashboard by providing options to select Subscriber or Household identity level. Also adds these identity options to the First Stream filter.
Use Cases:
With this feature, you can get more relevant data by switching the identity levels between subscriber and household in the Viewer Acquisition dashboard and the Viewer Retention dashboard based on your scenario. For example, if you are from advertisement team, you can select the household identity level to get more relevant data.
More Details:
Viewer Acquisition, View Retention
November 3, 2022
Custom Ad Dimensions
|
New Feature:
Adds support to include ad server data as custom ad dimensions that appear in the Filter, Segment, and Analytics Workbench.
Note:
Filters in these dashboards do not support custom ad dimensions:
Viewer Insights Dashboard
Ads Dashboard
Viewer Acquisition Dashboard
Viewer Retention Dashboard
Feature Impact:
Expands the available ad dimensions to include custom ad server data when creating new filters, segments, and analytics workbench analysis.
Note: Contact your Conviva representative to get started with custom ad dimensions. Your Conviva representative will guide you through the requirements and setup.
Use Cases:
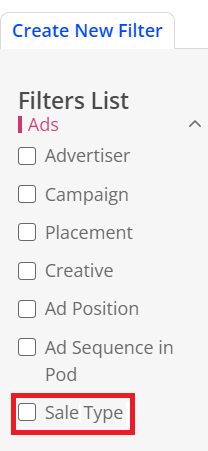
With custom ad dimensions, you can build more advanced advertising-related filters, segments, and analytics workbench analysis, for example, add the Sale Type dimension to filter sessions that played either direct sold ads or programmatic ads, and analyze the performances of the ad types.
More Details:
Filters and Segments, Analytics Workbench Dashboard, Advertising Capabilities in Viewer Insights
October 20, 2022
Enhanced Age Range Selection with Age Bands and Custom Filter/Segment Settings
Updated Filter Ad Range
 |
Updated Demographics with Age Range Breakout
|
Feature Update:
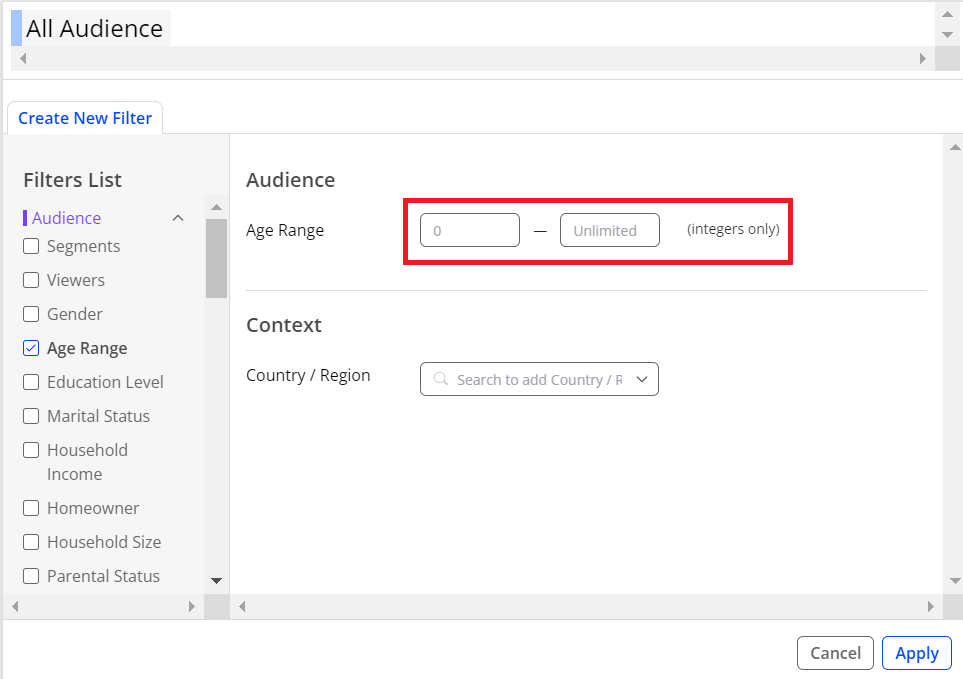
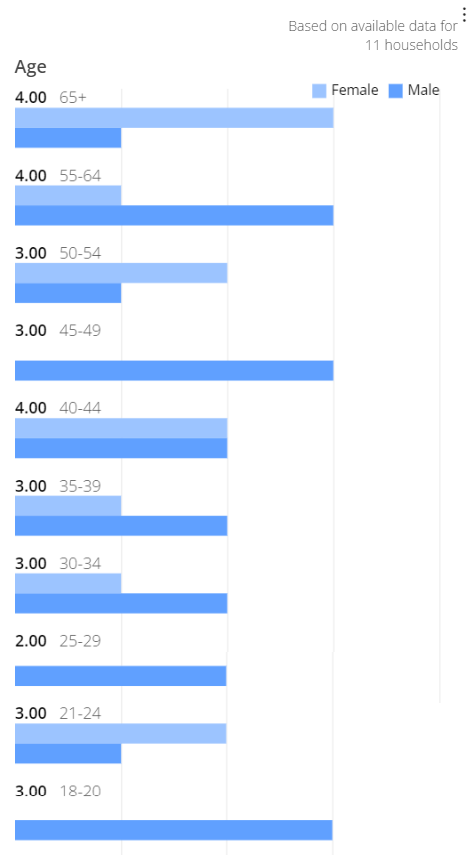
Enhances the age range selection with a custom age range when creating new filters and segments, along with industry-standard age bands in demographics.
Feature Impact:
-
Adds custom age range selection in the Age Range in the Filters List and Segment Builder.
-
Adds industry-standard age bands for demographic analysis: 18-20, 21-24, 25-29, 30-34, 35-39, 40-44, 45-49, 50-54, 55-64, 65+.
Use Cases:
With the enhancement, advertising teams can have improved control over ad planning, activation, and measurement by age range.
More Details:
Filters and Segments, Demographic Widgets
September 2022
Ad Dimensions in Filter Builder
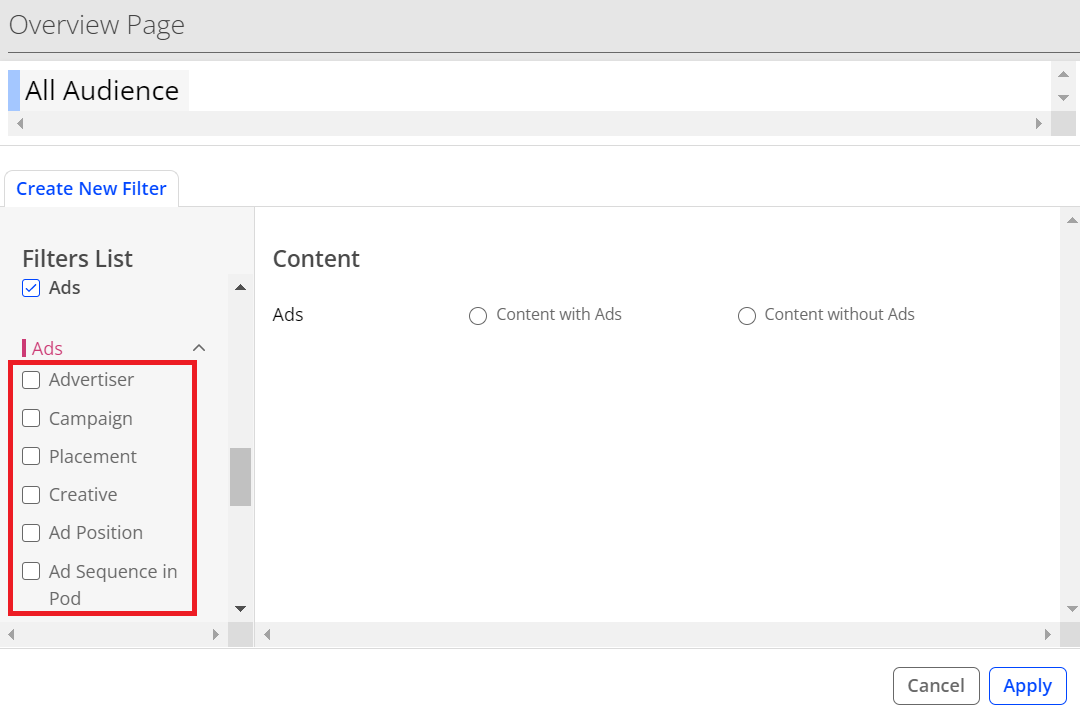
New Feature
This release adds the following ad dimensions in the Filter Builder under the Ads category:
-
Advertiser*
-
Campaign*
-
Placement*
-
Creative*
-
Ad Position (pre/mid/post-roll)
-
Ad Sequence in Pod
Note: *Dimensions for Advertiser, Campaign, Placement and Creative are for customers with Audience Module only and require ingestion of ad server metadata.
Feature Impact
Ad dimensions enable session filtering to highlight sessions associated with specific ad behaviors and metadata. The ad dimension filter settings appear on all pages that support creating filters, except the following pages:
-
Dashboard
-
Ads
-
Viewer Acquisition
-
Viewer Retention
More Details
For more details, see Filters and Segments.
Ad Dimensions in Segment Builder
To further support Ad Teams, this release adds ad dimensions in the Segment Builder under the Ads category:
-
Advertiser*
-
Campaign*
-
Placement*
-
Creative*
-
Ad Position (pre/mid/post-roll)
-
Ad Sequence in Pod
Note: *Dimensions for Advertiser, Campaign, Placement and Creative are for customers with Audience Module only and require ingestion of ad server metadata.
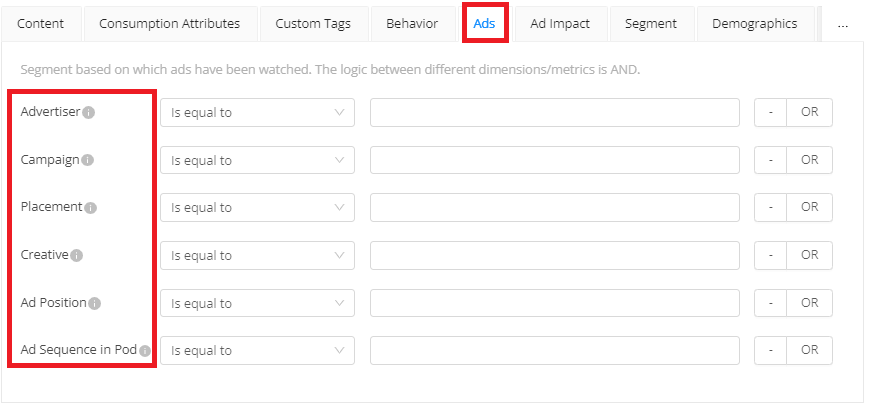
Feature Impact:
All pages supporting segments.
Use Cases:
Marketers can create segments that watched their promotional ads and intersect that with viewers who watched the content being promoted to understand attribution and conversion.
For more details, see Filters and Segments.
Ad Metrics in Segment Builder
Along with Ad Impressions, the Segment Builder now offers a new category to segment viewers by Ad Impact, the percentage of ad play time in the overall play time.
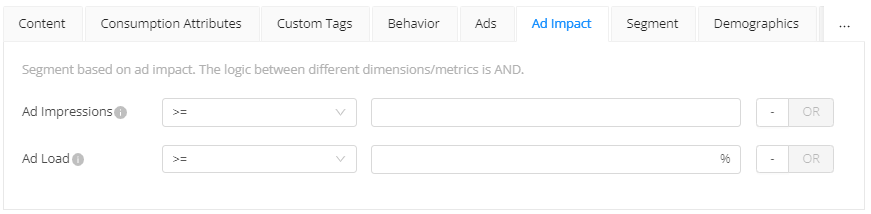
Feature Impact:
All pages support segment creation and management.
Use Cases:
Publishers can create a segment that experienced high ad load and compare their engagement and retention with segments of viewers that had low ad load or no ads.
For more details, see Filters and Segments.
Clarified Labels for Viewers Unit
This release replaces the Viewer label when viewer is used as a unit of measurement in a metric. The new label appears as either of the following units to show how the primary ID is configured for the account.
-
App
-
Subscriber
-
Household
The following picture shows an example with the Viewer unit as Household.
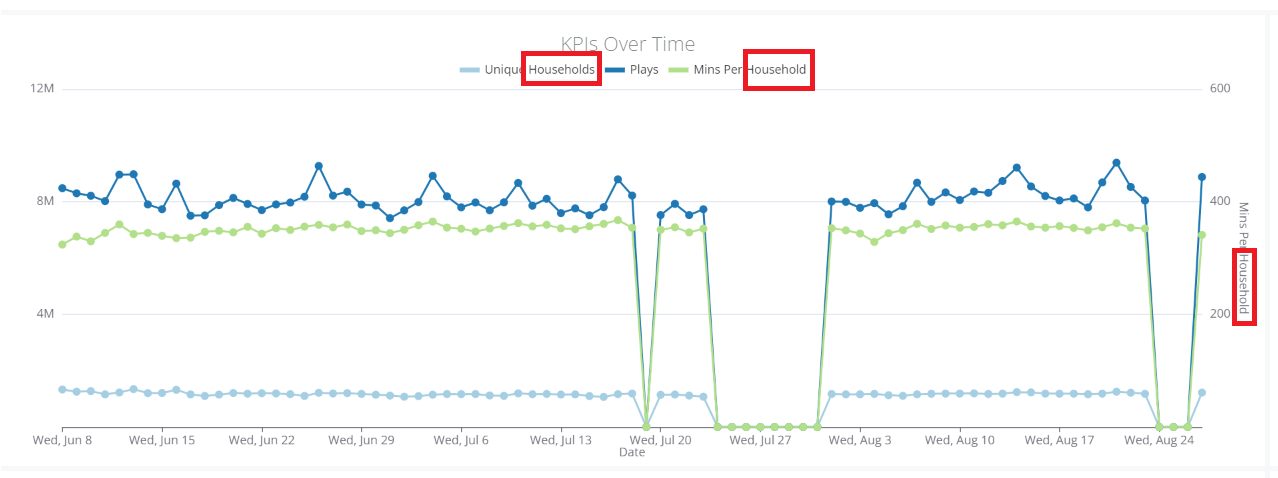
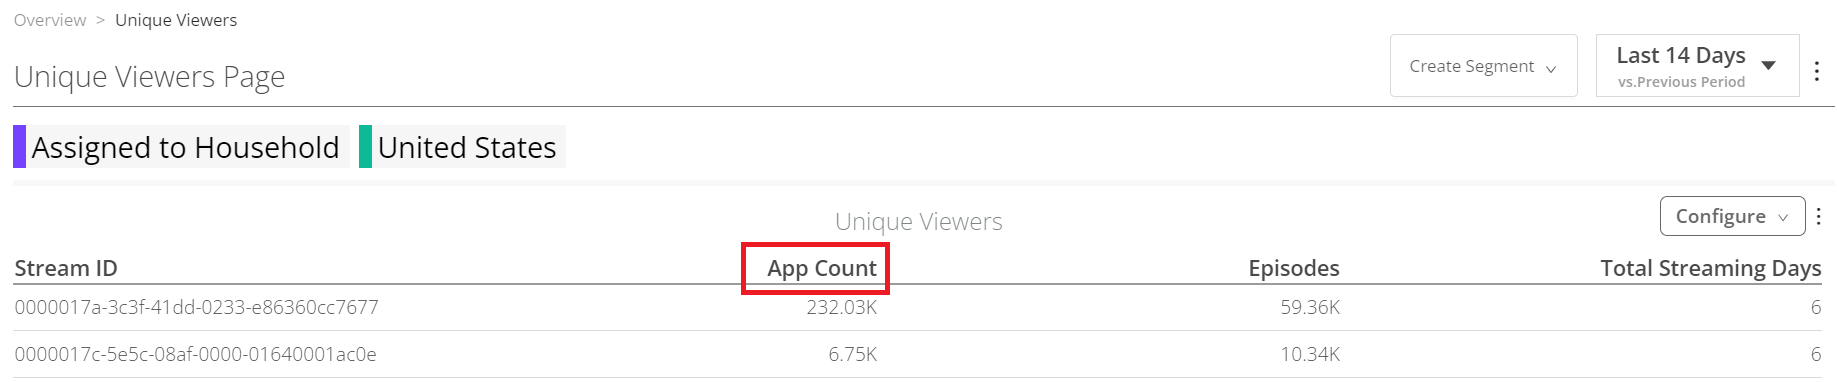
Device Count Renamed to App Count
This release renames the UI display name for device counts to App Count.
For example, the UI display name Total Devices on the Unique Viewers page is now renamed to App Count.
This update also appears in Analytics Workbench and other pages, such as Unique Viewers Page.
Removed the Total Devices Metric
This release removes the Total Devices metric in the Content Consumption by Device Type widget.
Support for Copying Existing Segments
This release adds support to copy an existing segment, so you can easily duplicate segment attributes.
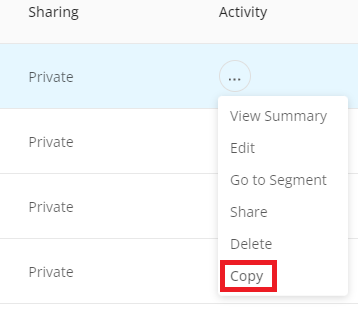
For more details, see Copying an Existing Segment.
August 2022
Reach at Multiple Identity Levels
The unique viewer metrics in the KPI bar now show reach across multiple identity levels:
-
App Count – count of unique client IDs (this is automatically assigned by the sensor and will change when the app is reinstalled)
-
Subscribers – count of unique subscriber IDs (requires customer to pass in an appropriate subscriber ID)
-
Households – count of unique household IDs (requires Audience Module add-on)

Users can click on either the Subscribers or Households KPI to drill into the Unique Viewers page.
Feature Impact:
These new reach metrics appear in the KPI bar on the Overview page and other detail pages, such as Series and Channel detail pages, and replace the Unique Viewers metric.
Use Cases:
Previously, the Unique Viewers KPI represented either the app count, subscriber count or household count based on how the primary ID was configured for the account. The new multiple identity metrics more clearly show reach at all the available identity levels.
Super Binger Behavior Segment
The Conviva-defined Super Binger behavior segment now replaces the Addict segment. To qualify as a Super Binger, viewing must be in the top 50% of playing time over a period, typically seven days, and watched over multiple series with less than 10 minutes of interruption.
For more details, see Audience Segments.
July 2022
Ad Dimensions and Metrics Added to Analytics Workbench
The Analytics Workbench now supports ad dimensions and metrics, such as Ad Frequency, Ad Impression, and Ad Minutes, for enhanced analysis of content and ad viewership.
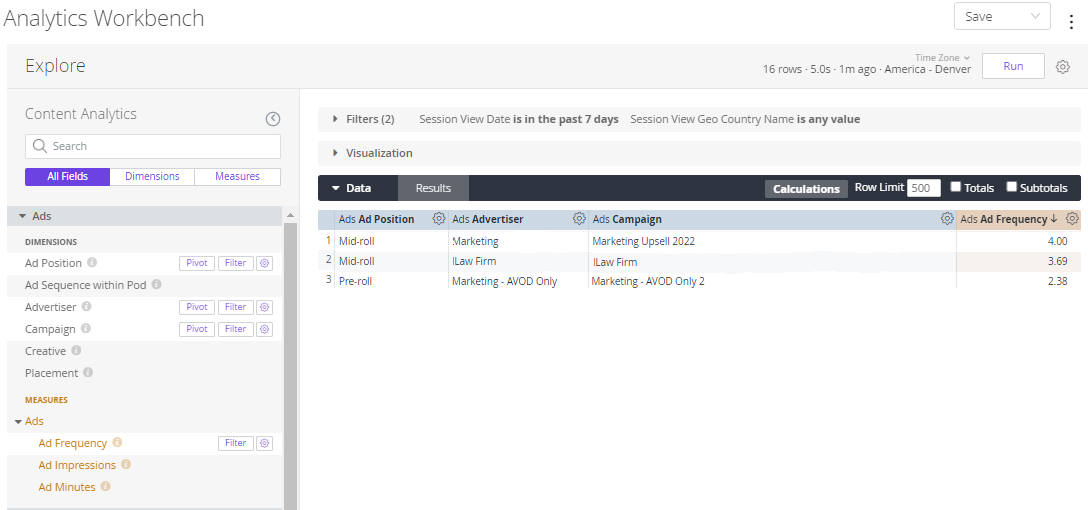
For more details, see Analytics Workbench.
June 2022
Filter and Segment Support for Content Sessions With and Without Ads
Filter and segment settings include options for content sessions with and without ads. This enables the analysis of the impact ads on viewer activities and content performance.
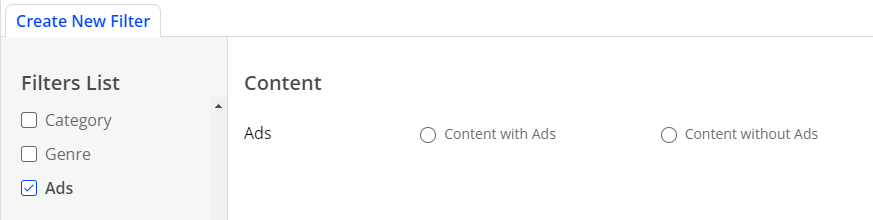
For more details, see Using Filters and Segment Management.
Analytics Workbench Support for Content Sessions With and Without Ads
The Analytics Workbench supports adding dimensional analysis for sessions with and without ads.
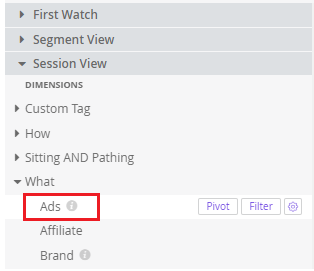
Toggle Between Number Values and Percentages in Viewer Acquisition Dashboard.
The Viewer Acquisition dashboard supports toggling between number values and percentages in the New Viewers by First widget to improve analysis of cohort activities.
Introduces Ad Metrics and Ad Dashboards
This release adds the Ad Impressions metric to most dashboards to display the sum of ad sessions that successfully started in the selected interval so you can correlate viewership and ad performance.

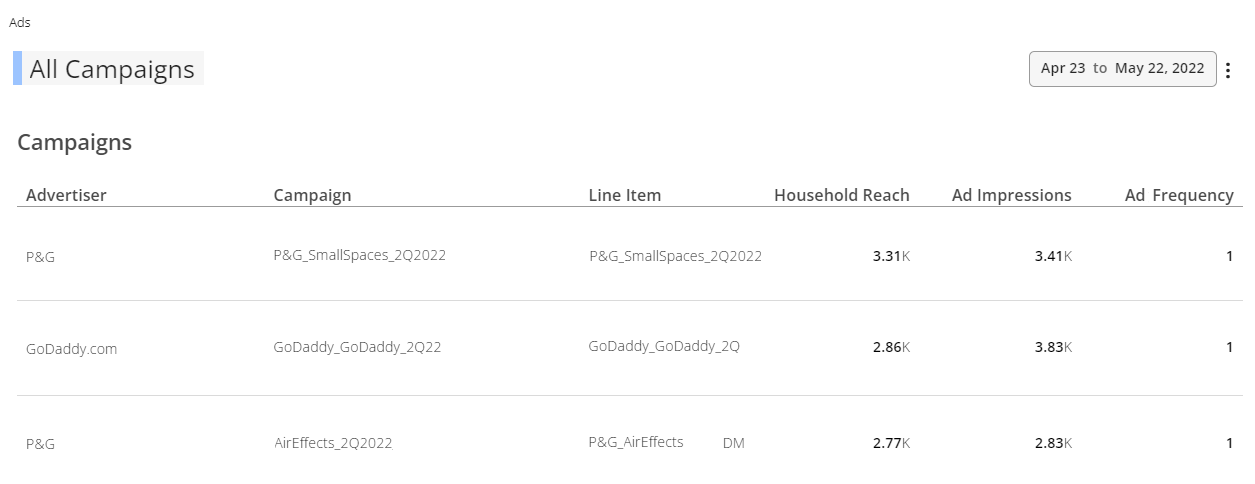
Ad data support also includes the Ads and Ad Details dashboards with a list of ad placements (line items) delivered in the selected period along with the corresponding metadata, such as advertiser and campaign, and metrics, such as household reach, ad impressions, and average frequency. The Ads Dashboard helps you quickly determine the overall effectiveness of the delivered ad placements. The Ad Detail dashboard displays a high-level view of your ad's reach, frequency, and impression delivery across device, content, and audience demographics.
May 2022
Enhancements to Analytics Workbench
This release consists of the following updates:
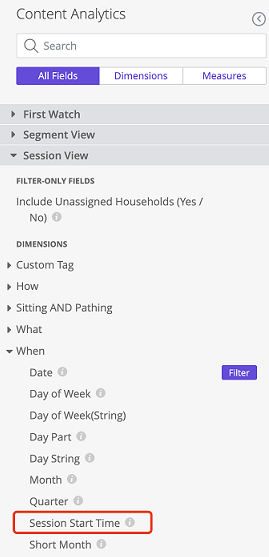
- A new dimension, Session Start Time, is introduced to Analytics Workbench.
It is defined as - The time, in local time zone, when viewers started watching content. It accepts integer and decimal values. To convert decimal value to minutes, multiply the decimal value by 60. For example, 8.3 converts to 8:18 AM.
This dimension is located in Analytics Workbench > Dimension > Session View > When.
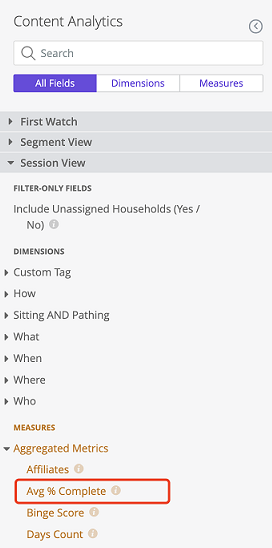
- A new metric, Average % Complete, is introduced to Analytics Workbench.
It is defined as - The amount of viewed content compared with the total length of the content, aggregated across the selected dimensions. For example, 35.8 indicates 35.8% of the content was watched in a single session.
This metric is located in Analytics Workbench > Measures > Aggregated Measures.
Enhancements to Viewer Acquisition
This release includes the following updates:
- The Viewer Acquisition widgets now support drill-down capability to other dashboards such as the Overview dashboard and Viewer Retention page. Drilling down from these widgets enables you to track viewer activity from acquisition to retention and content engagement. For more information, see Viewer Acquisition.
- Viewer Insights now supports a new type of filter called First Stream. This new filter type allows you to analyze data based on attributes of the viewer’s first video streamed such Screen Type and Series. You can customize the attributes for this filter based on your analytical requirements. For more information, see Using Filters.
April 2022
Viewer Retention
Viewer Retention, a feature that enables streaming content publishers to analyze viewer retention and engagement patterns, is introduced to Viewer Insights. By analyzing viewer retention data, you can better understand content performance and optimize viewer retention strategies. For more information, refer to Viewer Retention.
March 2022
Session Duration Filter
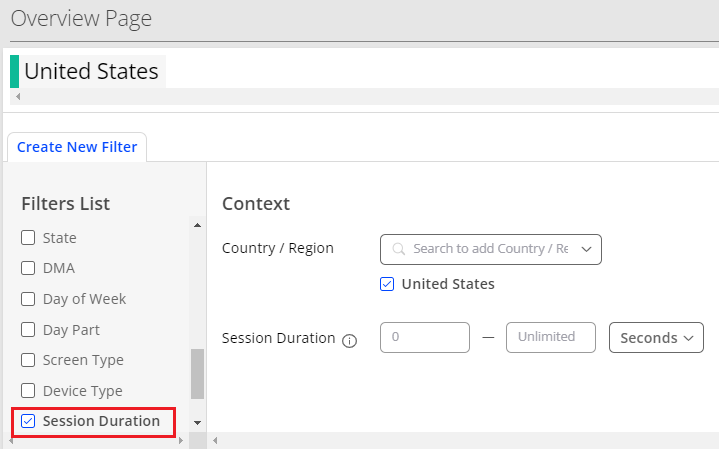
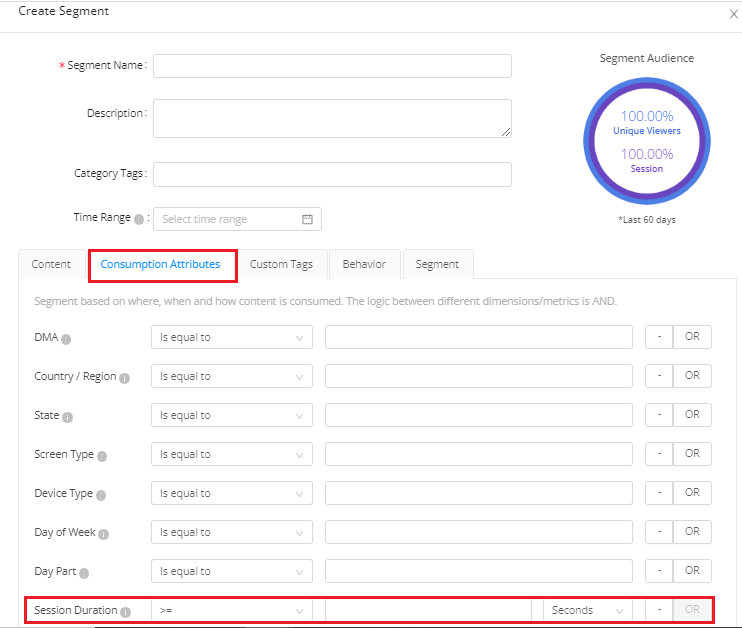
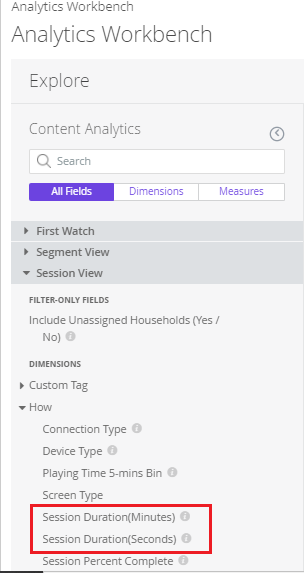
The Mins Watched filter is renamed to Session Duration which enables you to analyze sessions by seconds and minutes. This update gives you the ability to refine your analytical data by filtering sessions that last only a few seconds.
You can use this updated filter option in:
- Dashboard filter
- Segment Builder
- Analytics Workbench
Filter Support for the Viewer Acquisition Dashboard
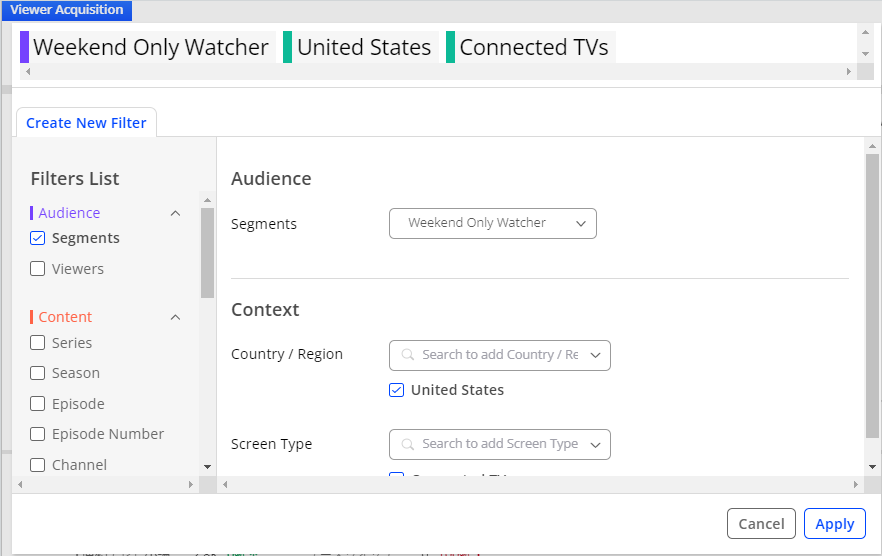
We are excited to add filtering support to the Viewer Acquisition dashboard, so you can easily drill into curated subsets of data. For example, you can set filters to perform acquisition analysis on only a segment of viewers that have watched a recent tent-pole event in a specific country or region. For more information, see Viewer Acquisition Dashboard.
Unique Viewers Page Enhancements
The Unique Viewers page now displays Stream and Subscriber IDs along with the corresponding viewer-level metrics. In addition, you can customize the page display settings to show only those columns which contain the data that is most valuable to your analysis. For more information, see Unique Viewers Page.

2021 Releases
December 2021
Viewer Acquisition Dashboard
A new dashboard, Viewer Acquisition dashboard, is introduced to Viewer Insights. This dashboard enables streaming content publishers to analyze their viewers acquisition patterns to better understand the factors that drive new viewer engagement. For more information, refer to Viewer Acquisition Dashboard.
October 2021
Affiliate Filter
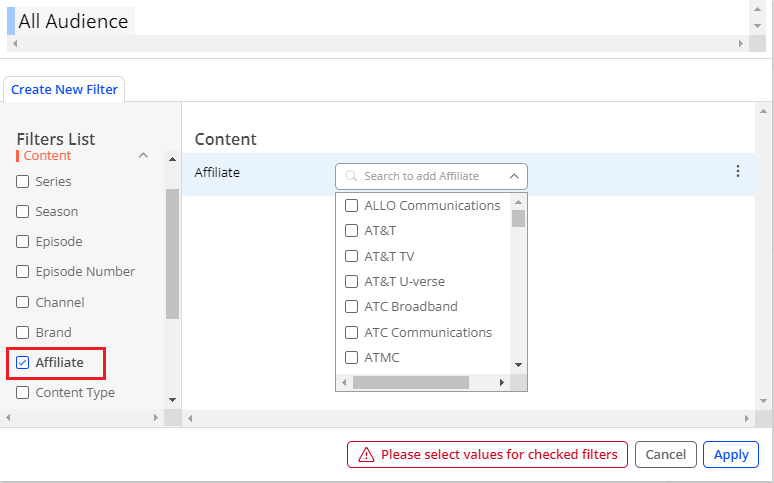
A new filter dimension, Affiliate, is now available for use in Viewer Insights. Using this filter can help you measure the impact of affiliate programming decisions as well as monitor trends in content consumption across your affiliates.
Demographics Filter
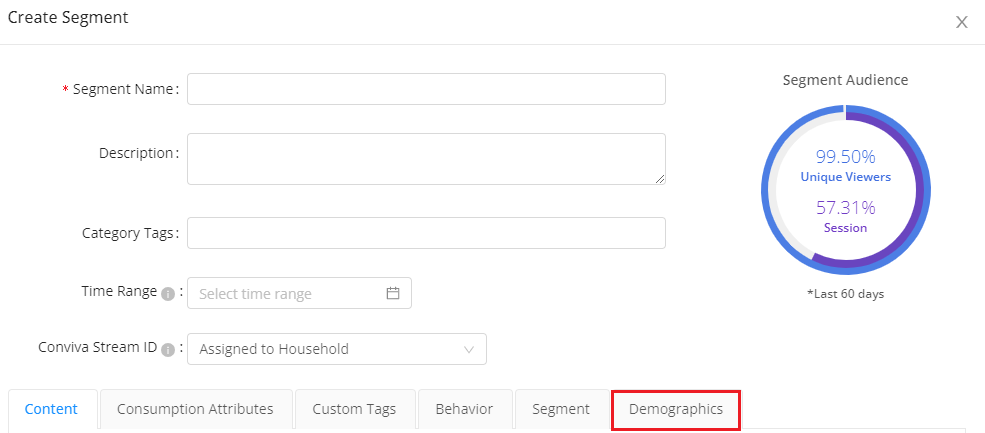
A new set of Demographic filters is available for use in Segmentation. Demographics provide additional insightful data about your viewers such as gender, age, education, and interests which enables you to better tailor your content, marketing, messaging, and advertising to the requirements of your viewers.
August 2021
Mins Watched Widget
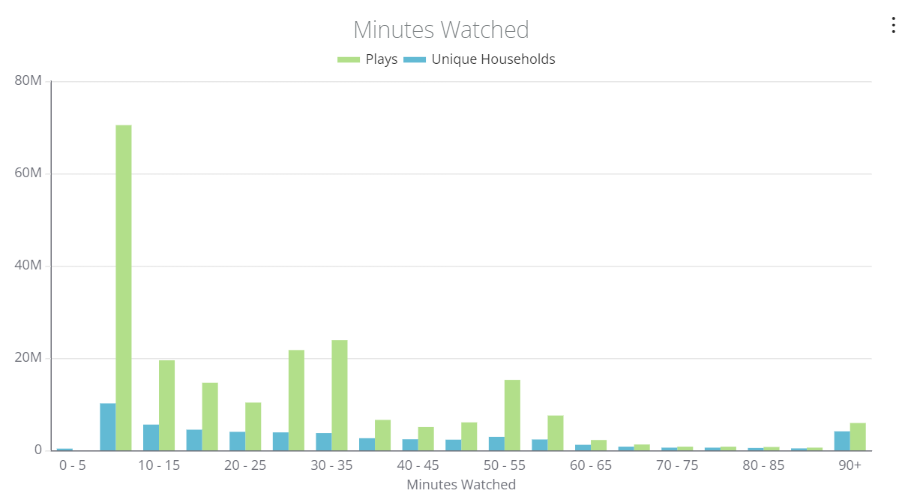
The Viewership Over the Show widget is now redesigned and called Mins Watched. This widget offers a more refined view of the duration of asset plays. For more information, refer to Content Page.
July 2021
Usability Enhancements to Analytics Workbench
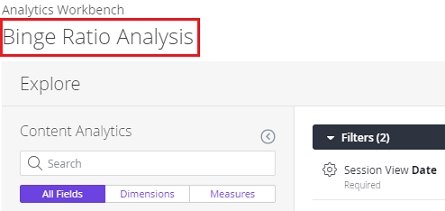
While working on a saved analysis in the Analytics Workbench, the name assigned to the analysis is now displayed in the top-left of the Analytics Workbench dashboard.
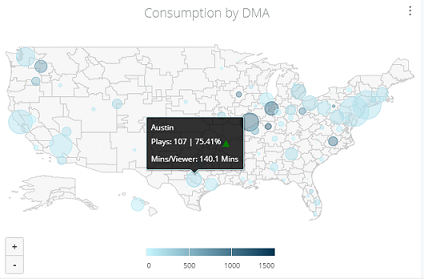
Updates to the US Map
The DMA widget now displays Alaska and Hawaii in the US map.
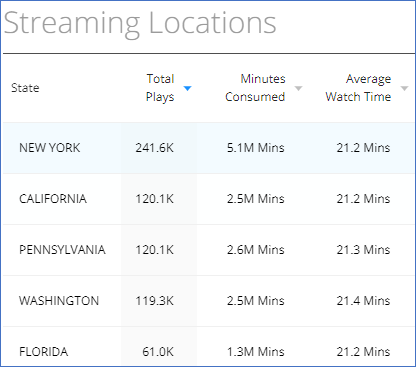
Updates to Names of US States and Countries
Complete name of US states and countries are displayed instead of abbreviations.
June 2021
Apply Segment as Filter
In the Viewer Insights dashboard, you can now filter streaming traffic by viewer segment. After applying the segment as a filter, you can drill-down from any streaming widget to the detailed page, such as Device Overview, with the specified filter settings applied seamlessly.
For more information, see Viewer Insights Quick Guide.
Enhanced Segment Management
Several fields in the Segment Management page have been modified for ease-of-use:
Total number of segments created and segment limit.
Segment search and sorting.
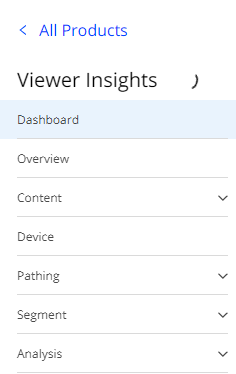
Single App Integration
With the Single App integration, Viewer Insights now shares the same look and feel of navigation and user experience of accessing apps in Pulse. An enhanced Viewer Insights menu now contains a dashboard option for the Viewer Insights dashboard along with menu options for Content Analytics features when supported.
Customers with multiple products can now customize their landing application using the default application setting in the Settings > My Profile > Application menu.
March 2021
This release adds support for widget drill-downs to quickly navigate from widget analysis to detailed analytics in Content Analytics. Also, adds support for shared filters.
2020 Releases
January 28, 2020 Release
The initial release includes the feature launch and bug fixes for Viewer Insights.