Audience Scenario—Discover Content Drivers
Starting from the Audience Overview dashboard, you can quickly access overall trends throughout your viewership and consumption, and then drill-down for a more focused analysis on potential content drivers. Overview data is aggregated based on TV industry concepts, such a series, episodes, channels, and affiliates. Clicking data points in the overview dashboard opens drill-down data filtered by the clicked data point. For example, clicking on a data point in the Content Plays by Device Type graph opens the detailed data page for the clicked device subtype.
Data representations are built around the cyclicality of content consumption, so when you select a week as the time period of interest Audience automatically presents comparative data for the previous week.
Scenario—Discover Content Drivers
This scenario covers:
- Analysis and Correlations.
- Overall Viewership Changes and Individual Viewing Patterns.
- Overview Page.
- Unique Viewers Page.
- Viewership Trends and Preferences.
- Asset Categories Most Widely Viewed.
- Consumption by DMA.
- DMA Page.
- Device-Specific Viewership and Subtypes .
- Device Viewership.
- Device Page.
- Viewership by Day and DayPart .
- Viewership by Day, DayPart, and Day of the Week.
- DayPart Page.
Analysis and Correlations
Overall Viewership Changes and Individual Viewing Patterns
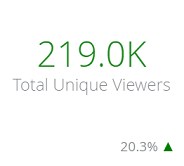
Determine overall viewership changes from the previous period. In this example, viewership (total unique viewers) increased by 20%.
- Click the Total Unique Viewers metric to open the Unique Viewers page.
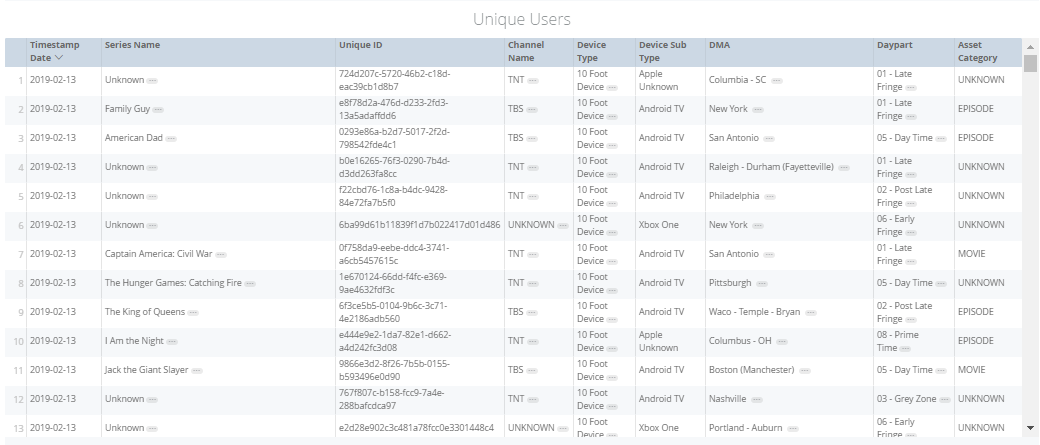
- Sort viewers by unique viewing ID to track individual viewing patterns and usage characteristics, such as channel, device type, and asset names.
Overview Page
Total Unique Viewers.
-
Click this metric and select Unique Viewers page.

Unique Viewers Page
Viewership Trends and Preferences
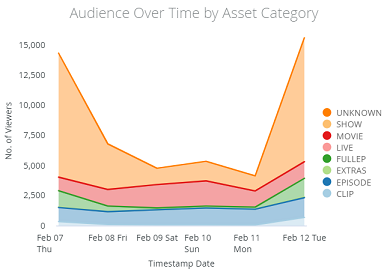
Analyze the viewership levels for each asset categories to determine viewership trends and preferences. In this example, SHOW assets received the most views during the week but dipped dramatic during the weekend, while LIVE and CLIP assets were also popular over the weekend.
Asset Categories Most Widely Viewed
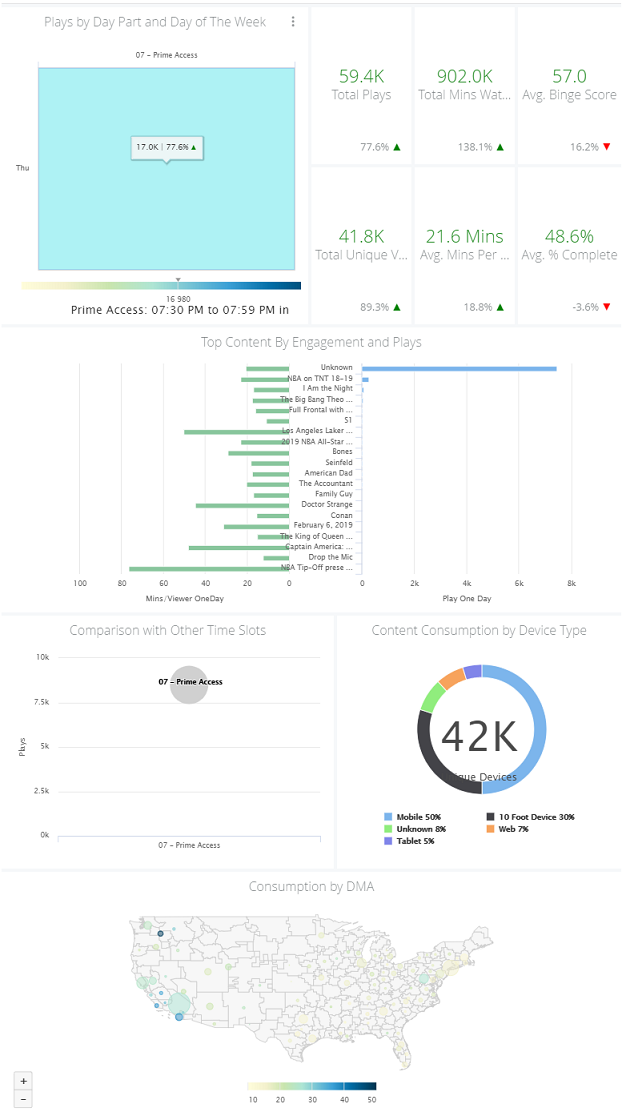
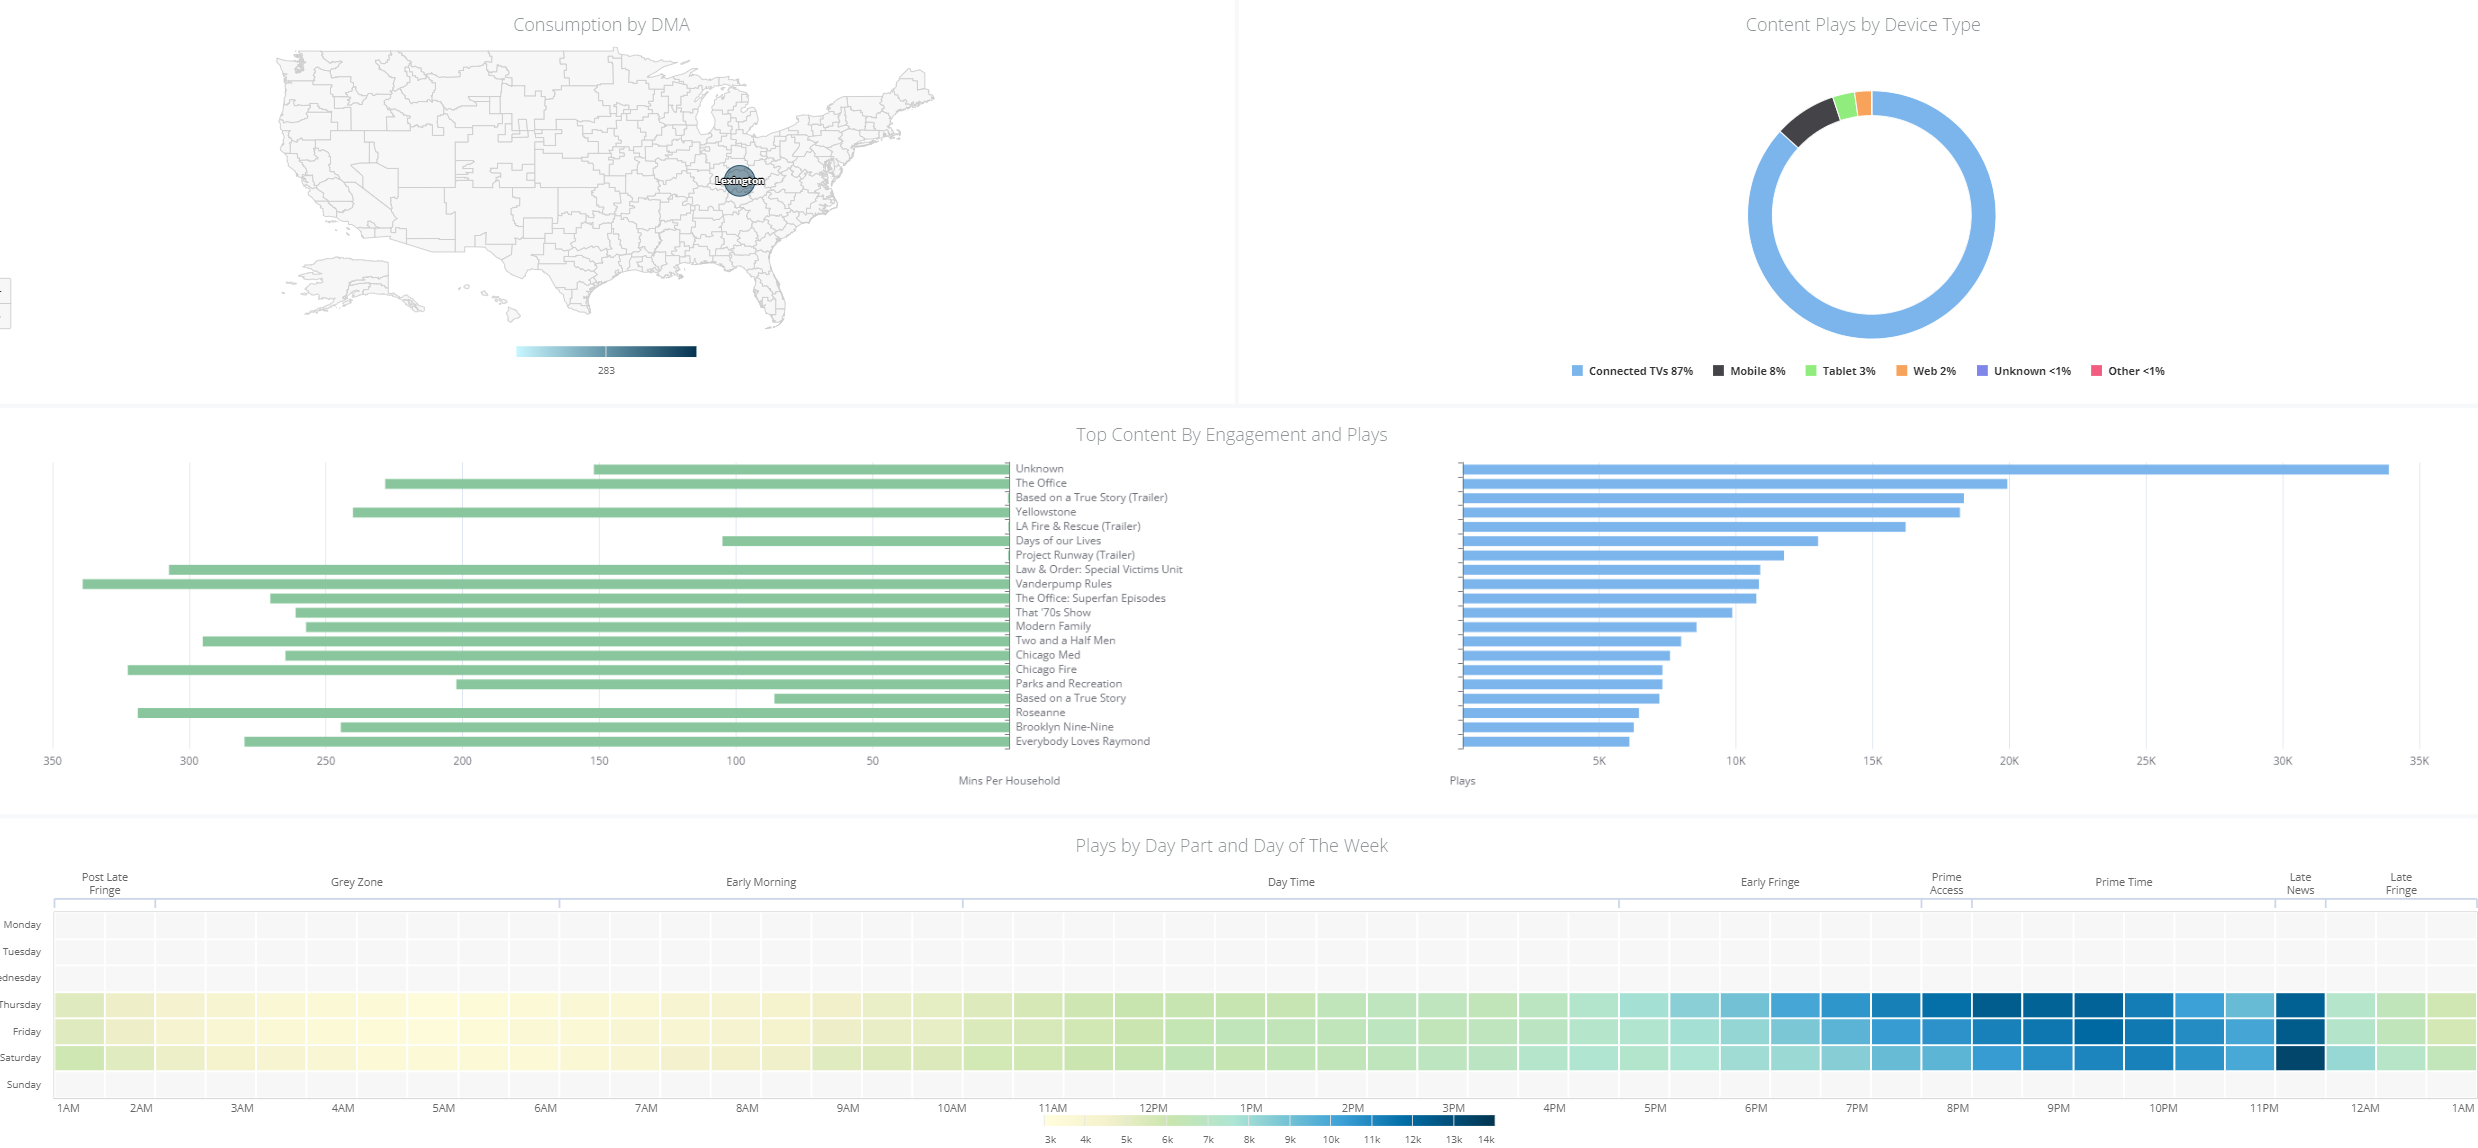
Determine content and viewership patterns across selected DMAs:
- Viewership metrics.
- Top content by engagement and plays.
- Drill-down to specific content titles.
- Content plays by device.
- Drill-down to device subtype data.
- Consumption compared to other DMAs.
- Plays by day part and day of the week.
- Drill-down to day part viewership details.
Consumption by DMA
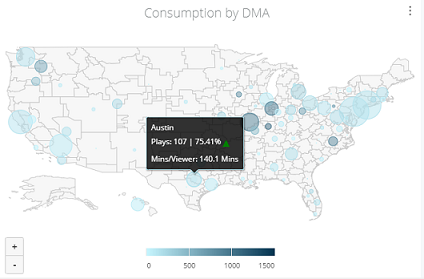
Click a data point and click the page to drill-down.
DMA Page
Device-Specific Viewership and Subtypes
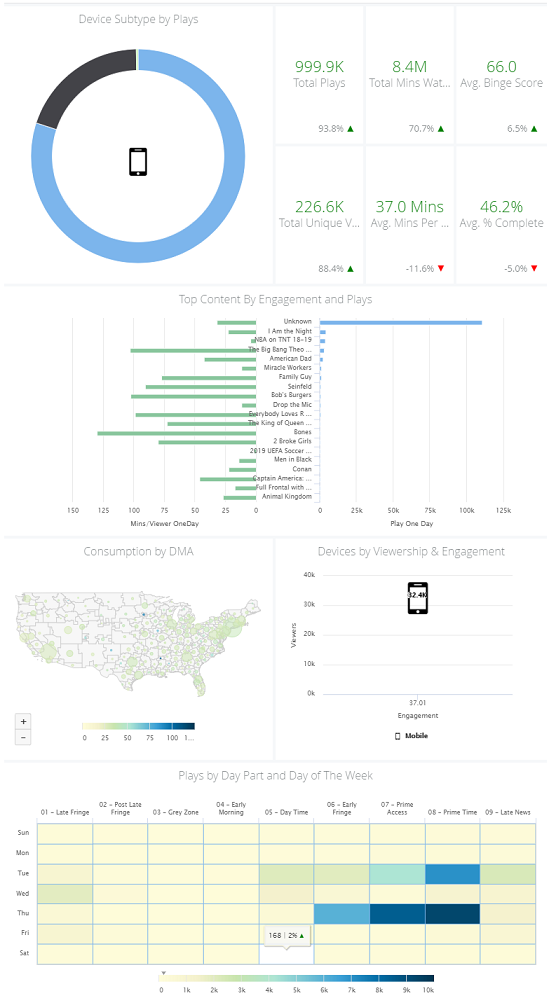
Determine content and viewership patterns within a selected device type:
- Viewership metrics for device subtypes.
- Top content by engagement and plays.
- Drill-down to specific content titles.
- Content plays by device.
- Drill-down to device subtype data.
- Consumption compared to other DMAs.
- Plays by day part and day of the week.
- Drill-down to day part viewership details.
Device Viewership
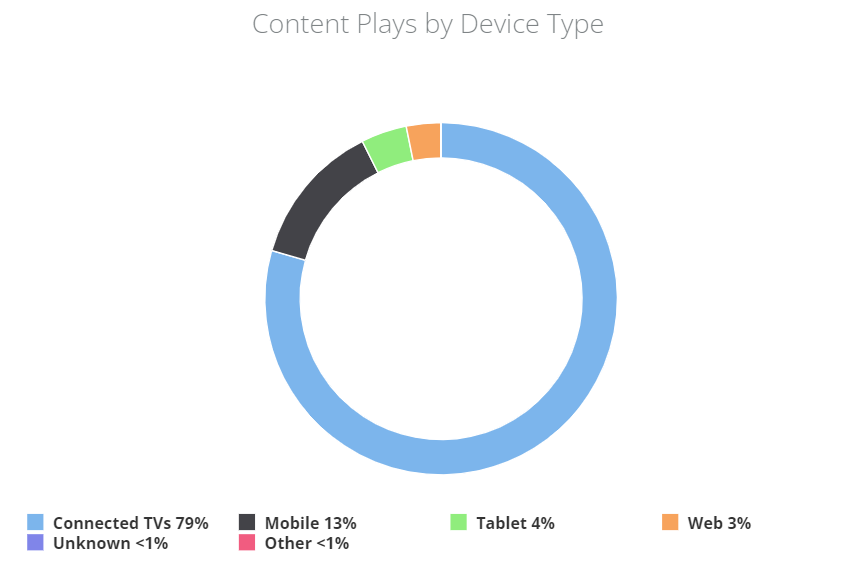
Click a device type and select:

Device Page
Viewership by Day and DayPart
Determine content and viewership patterns within a selected device type:
- Viewership metrics for device subtypes.
- Top content by engagement and plays.
- Drill-down to specific content titles.
- Content plays by device.
- Drill-down to device subtype data.
- Consumption compared to other DMAs.
- Plays by day part and day of the week.
- Drill-down to day part viewership details.
Viewership by Day, DayPart, and Day of the Week
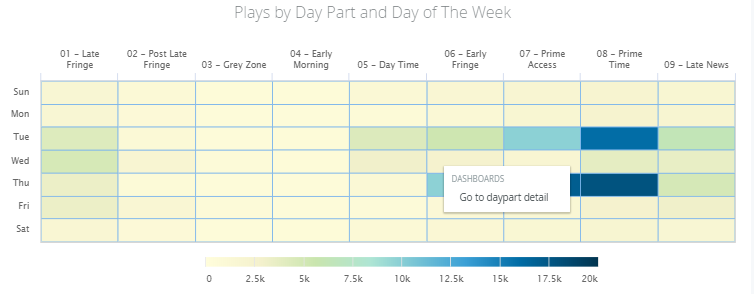
Click a time box and select:

DayPart Page