User Management: Viewer Access and MCP Access Permissions
Settings > User Management > Modify User > Permissions.
Feature Update: Two per-user permissions are now set from User Management. Viewer Access controls individual viewer- and user-level data — the Viewer module, viewers, sessions, timelines, and Impacted Viewers across all Video and App dashboards. MCP Access controls whether the user can reach Conviva through the Model Context Protocol (MCP) with their Conviva sign-in; access through API credentials continues to be governed by API Management. Both permissions are granted for all existing users, so nothing changes on release day, and both are cleared by default on the Invite User screen, so an admin grants them explicitly for a new user. A change takes effect the next time the user signs in, including an admin changing their own permission.
Use Case: Restrict individual viewer data to the teams that need it, and decide per user who can query Conviva from an MCP client — without creating a separate role.
User Management: Edit a Permission in Bulk Across Users and Accounts
Settings > User Management > Edit Permissions.
Feature Update: Every permission is now its own sortable, filterable column in the User Management grid. Filter to the users you want, select them, and click Edit Permissions to set one permission to one value across several accounts in a single action. Accounts where you cannot grant that permission are disabled, a single action is limited to 50 operations (selected users × selected accounts), and a review step returns a per-user, per-account success or failure summary.
Use Case: Roll a permission out — or take it away — for a whole team across the accounts they work in, instead of opening each user one at a time.
User Management: Block Invitations to Non-Federated Domains
Feature Update: On an account with this control enabled, Conviva validates the email domain of every invitation at User Management > Invite User against the account's configured SSO domain list and rejects invitations to any other domain. The approved-domain list is maintained by Conviva rather than exposed in the UI. Existing users on other domains are unaffected — only new invitations are blocked. The control is not self-serve; request it through Conviva Support.
Use Case: Keep account access inside your federated identity provider, so every new user arrives through SSO instead of a personal or third-party email address.
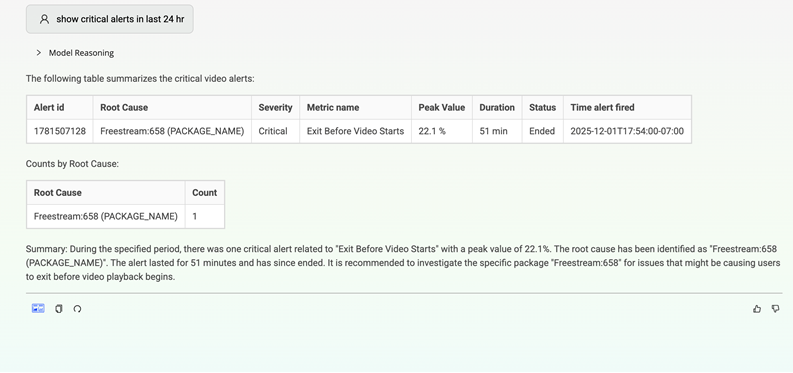
AI Alerts: Ad Playback Failures Added to Ads AI Alerts
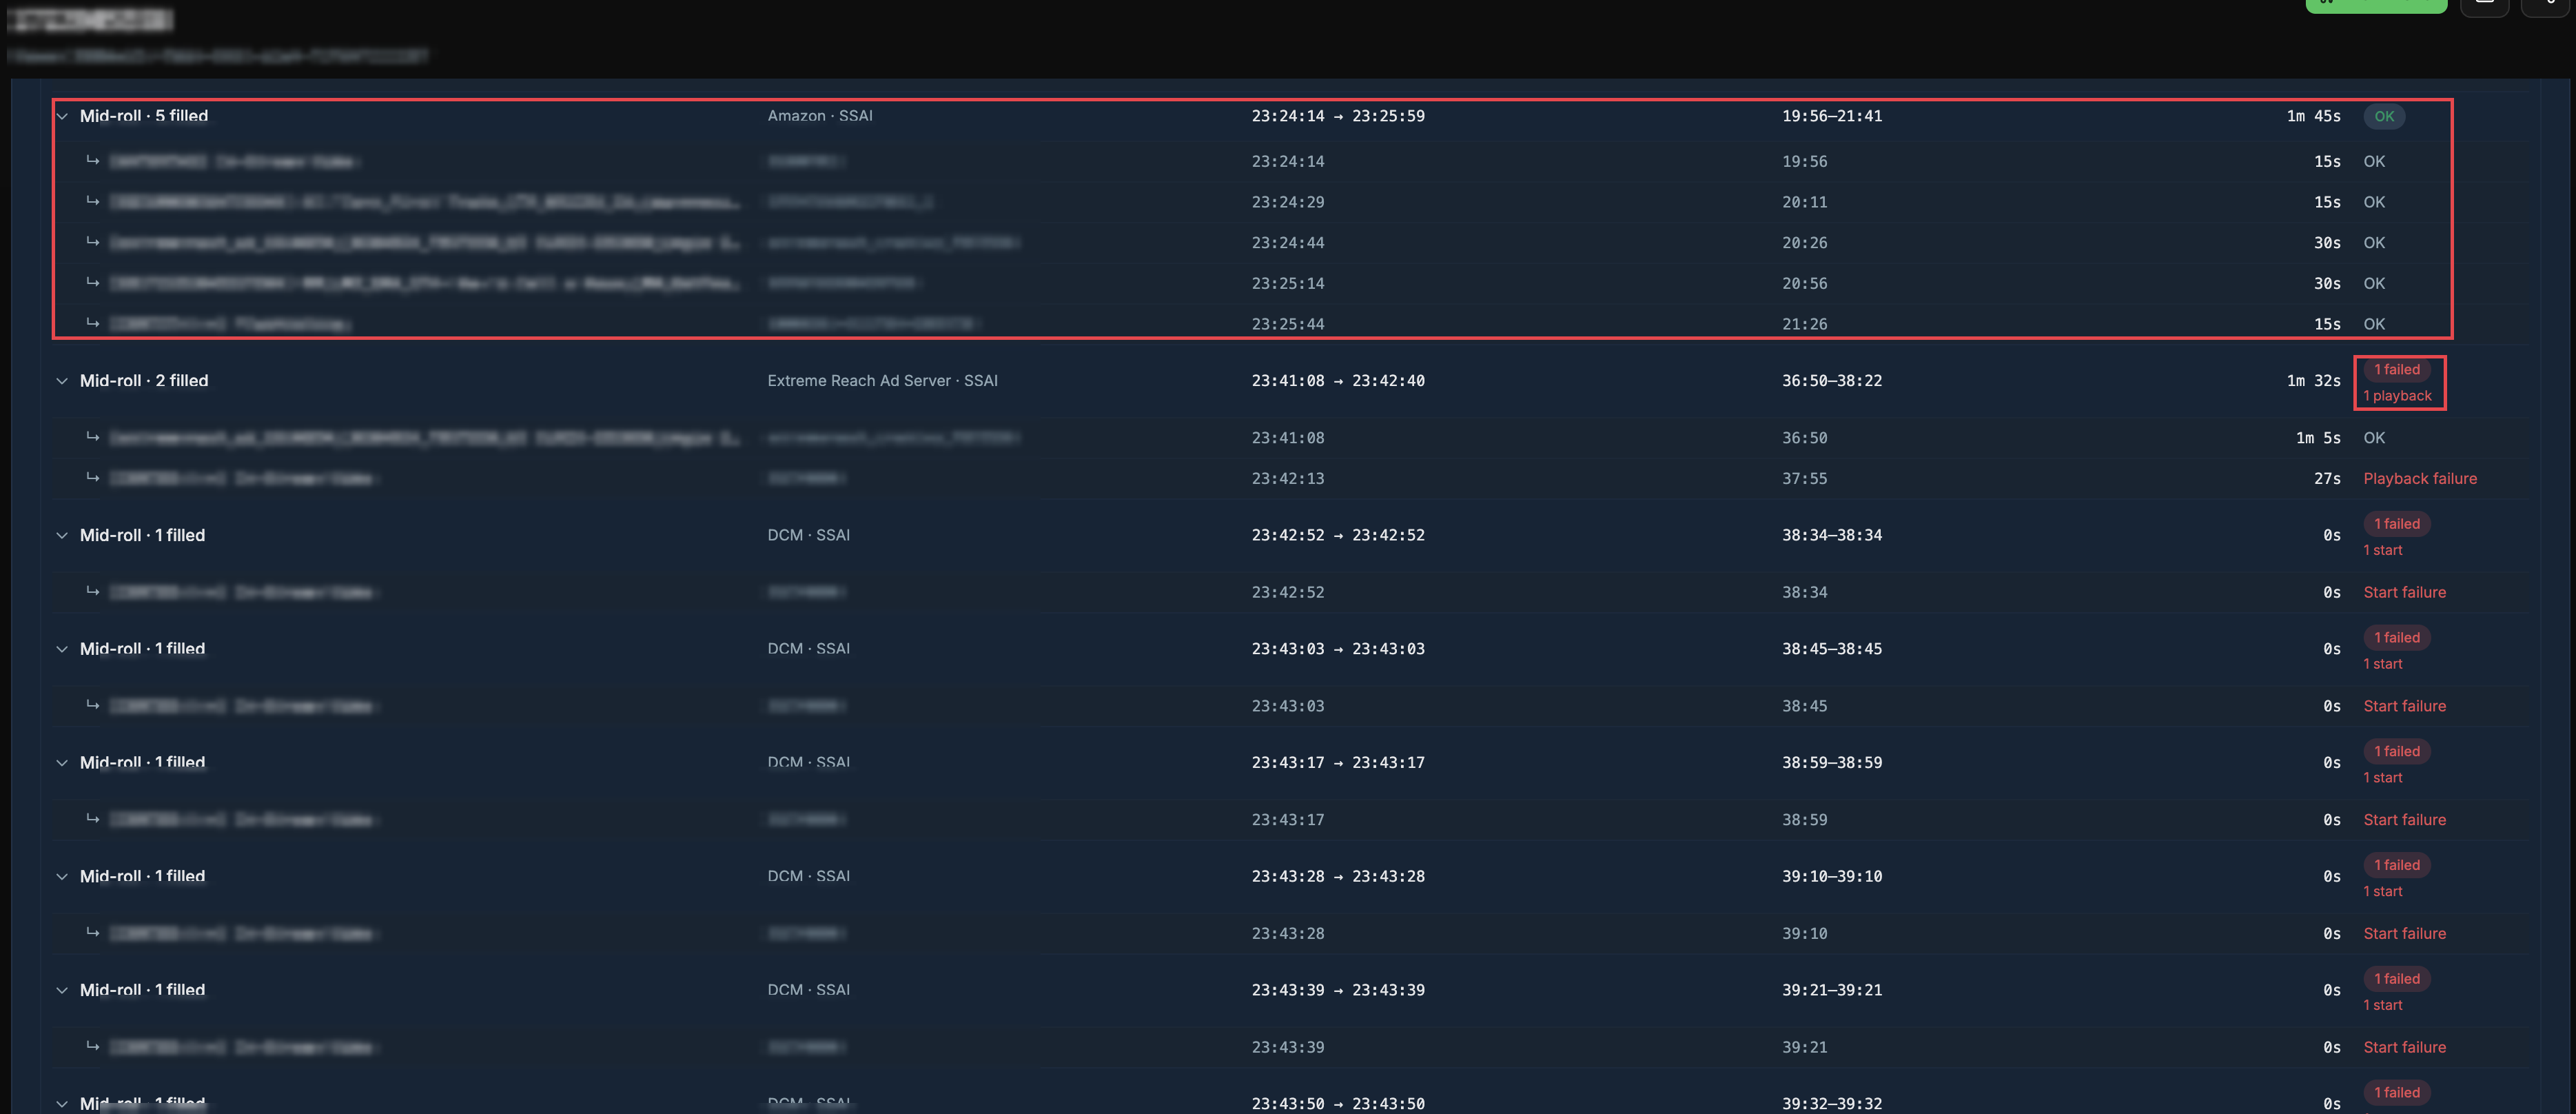
Feature Update:Ad Playback Failures is now a supported Ads AI Alerts metric. Ads AI Alerts previously covered the start of the ad only, so an ad that started cleanly and then broke mid-roll surfaced in next-day reporting rather than in real-time. The metric is added by default with a default sensitivity for all Ad customers, is tunable like any other ad metric under AI Alerts > Alert Config > Ad, and participates in the standard diagnostics and root-cause flow. Existing ad alert configurations are unaffected.
Use Case: Catch failures inside the ad break while the break is still running, instead of reconciling lost impressions the next day.
AI Alerts: KPI-based Metrics (Beta) for SPI Improvement Opportunity Metrics Beta
Video > AI Alerts Config > KPI-based Metrics (Beta).
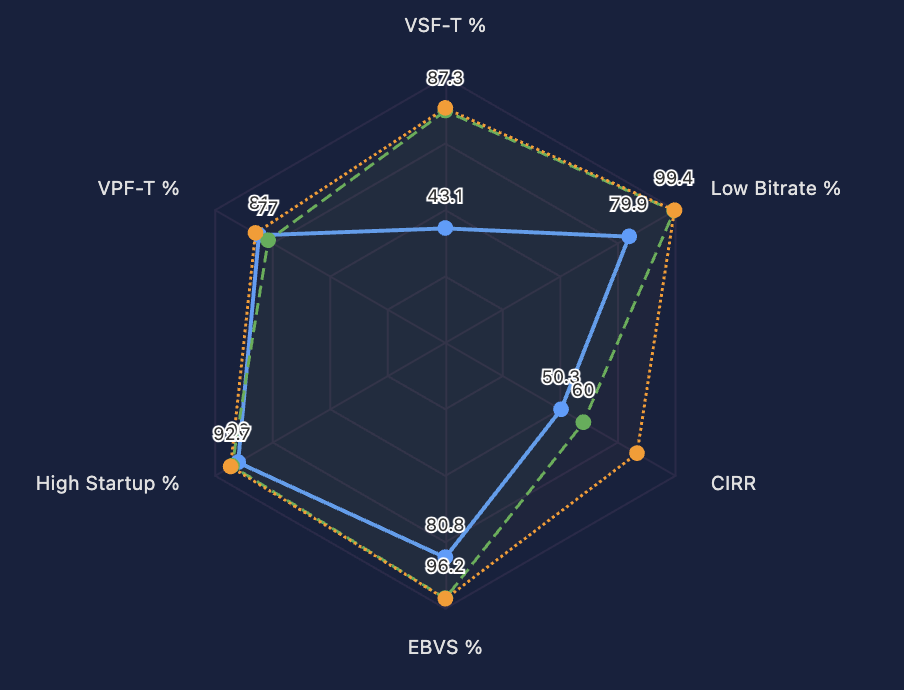
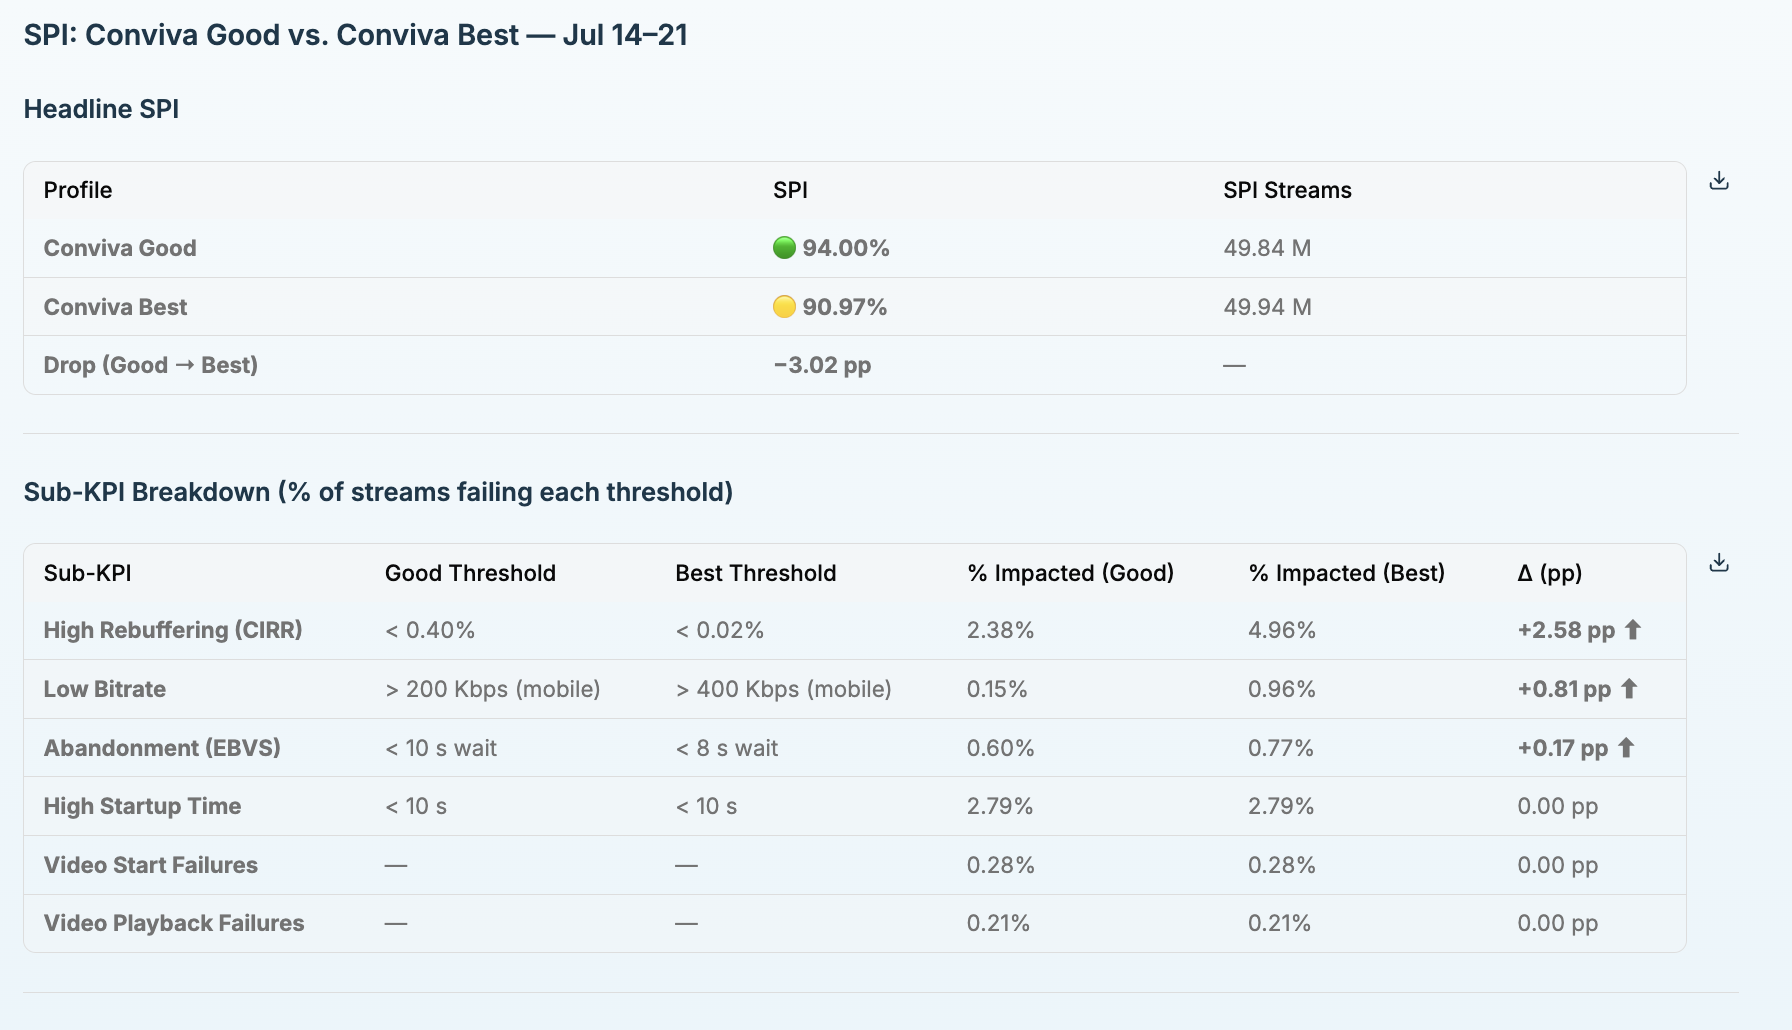
Feature Update: The four Streaming Performance Index (SPI) Improvement Opportunity metrics — Abandonment, High Startup Time, High Rebuffering and Low Bitrate — can now be configured as AI Alerts. Previously these metrics were only observable in the SPI workflow. Configure them in the new KPI-based Metrics (Beta) panel under Video > AI Alerts Config: select the KPI, check the Improvement Opportunity metrics to alert on, and set thresholds per severity (Info, Warning, Critical) across three conditions — Persistence exceeds, Total Impacted Devices exceeds and % Impacted Devices of Root Cause exceeds. The metrics are off by default and opt-in. One KPI's Improvement Opportunities can be added to alerting in this release, and you can switch from Conviva Good to Conviva Best after the initial enablement. Alerts fire into the existing AI Alerts workflow, use the same root-cause dimensions as the default metrics, and reach the same notification channels.
Use Case: SPI is the number you manage experience against, and the Improvement Opportunity metrics explain why it moves. Alerting on them flags a sudden deviation while sessions are still recoverable, rather than after SPI has already moved.
Feature Update: The default AI Alert metrics are no longer fixed. Metrics such as Video Start Time and Exits Before Video Start can be cleared from alerting when they are not the most actionable signal for your team, which makes the Improvement Opportunity metrics a replacement rather than an addition. Note that removing a metric or changing KPI/SPI settings does not auto-resolve existing alerts — any alert already active for that metric or KPI stays active.
Use Case: Enable Abandonment and, if it proves more actionable, clear the default Exits Before Video Start metric; or replace Video Start Time with High Startup Time. The result is one alert per failure mode instead of two describing the same event, which cuts triage noise.
Notifications: Mute Rules (Beta) for Condition-Based Alert Muting
Feature Update: Mute Rules let you suppress AI Alert notifications for a defined time window based on dimension and/or metric conditions, across one or more notification channels. Choose Mute Specific to silence the alerts that match a condition, or Mute everything except to silence everything else. Rules are defined once, attached to the channels they apply to, and listed by Active, Scheduled, or Expired status. Available in Video, Ads, and App.
Use Case: During a known incident or maintenance window, mute just the noisy slice — a single device OS, a specific metric, one webhook target — so on-call teams keep seeing the alerts that matter. Alerts still appear on the Alert Listing page; only the notifications are suppressed.
Documentation: Pulse help links now open docs.conviva.ai
Feature Update: Help links inside Conviva Pulse now open documentation on docs.conviva.ai. Selecting the help control in the Pulse header takes you to the documentation for the surface you are working in.
Use Case: Get to the right reference from inside your workflow — no separate search, and always the current version of the page.
Navigation: Pulse product surfaces renamed to Video and App
Pulse left navigation — Video and App now carry the product-surface names used across VSI.
Feature Update: The Pulse navigation labels now match the VSI product-surface model: DPI is renamed to App, and Video Streaming Insights is renamed to Video. Ads is unchanged. This is a labelling change only — no dashboards, metrics, filters, saved views, permissions, or API behavior changed, and no action is required.
Use Case: Consistent, customer-facing names across Video, App, and Ads make it clear which surface you are in and which product a given capability belongs to.
Documentation: docs.conviva.ai is now the home for all documentation
Feature Update:docs.conviva.ai is now the single home for all Pulse documentation, with a major search upgrade. It fully replaces the in-Pulse Learning Center, which will be retired soon — all the latest documentation now lives on docs.conviva.ai. Note that Pulse help links still point to the old Learning Center; they will be updated in the next release.
Notifications: Global Mute (Beta) for All Alert Notifications
Feature Update: Mute all AI Alert and manual alert notifications across every channel for a set window (up to 24 hours) — useful for maintenance windows or known low-traffic periods.
Use Case: During a maintenance window or a known low-traffic period, mute notifications so non-actionable alerts don't reach your team, while the alerts themselves stay visible on the Alert Listing page.
New API Management Permission at User Level: API Management is now a per-user permission (Hide, View, or Edit) set in User Management, with a separate API Admin permission that controls who can grant access to others. Learn more
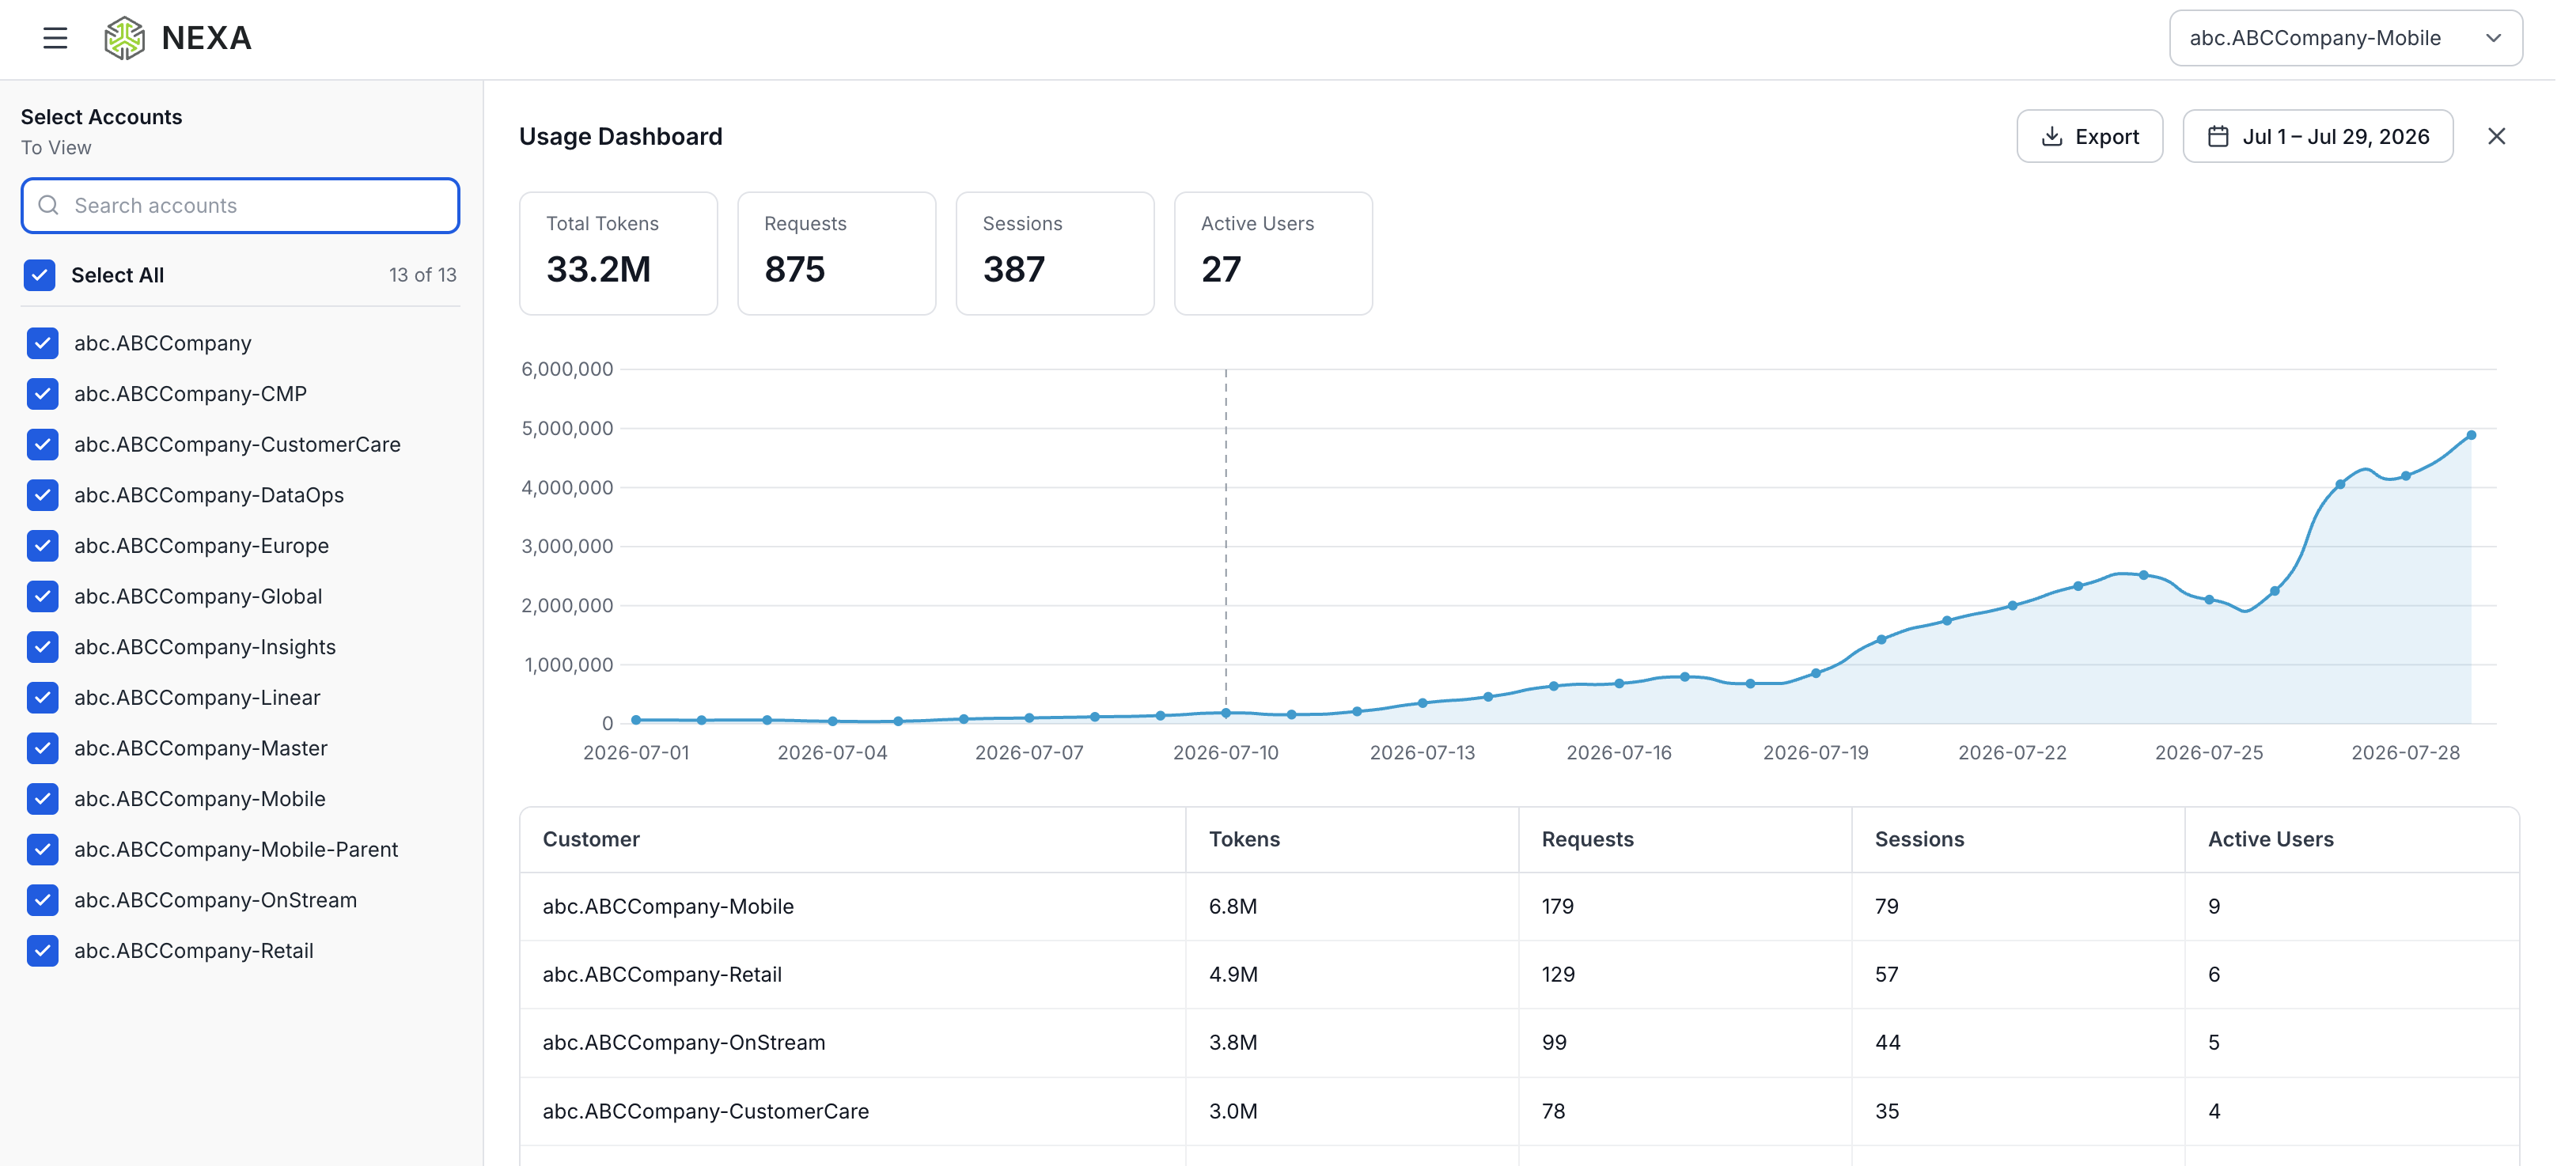
Usage Dashboard — Table View Export: Export now produces a single download that combines the time-series data with a per-account table breakdown, and the export header lists all selected c3 accounts. Learn more
May 14, 2026
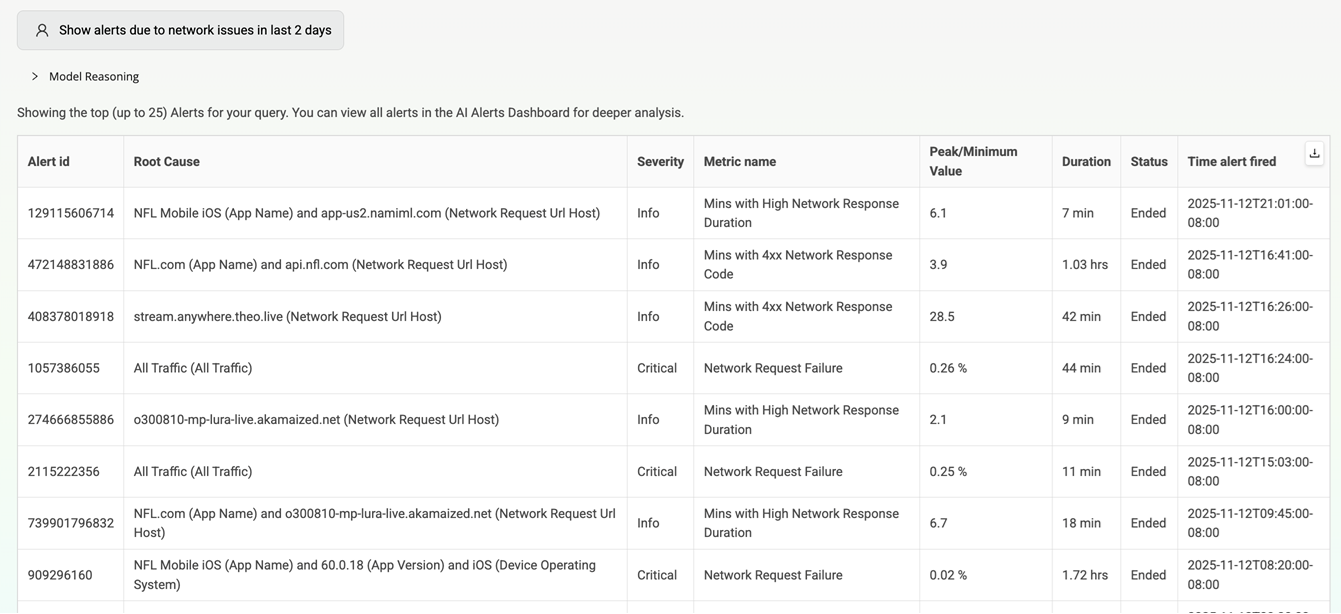
AI Alerts: Reinstate AI Alerts Support for Ad Metrics
Feature Update: Resumes AI Alerts support for Ad metrics. This dashboard provides focused monitoring of video and ad-related alerts and streamlined reporting of alert data. It improves root cause visibility and enhances analysis of issue impacts. (AI Alerts for Ads will be enabled in phases starting May 14, 2026, through end of May 2026.)
Click to expand the image:
Use Case: Use the AI Alerts dashboard to identify key anomalies, then jump to detailed anomaly analysis through the Root Cause Leads link. In this example, the Root Cause Leads link for the selected alert (Ad Rebuffering Ratio) opens the AI Alert Diagnostics page for quick access to the impacted dimensions in the dimension tables. Also, see the peak value details to identify the metric's highest value, which helps analyze the issue's impacts.
Feature Update: Refreshes the ASN display names for approximately 40,000 ASNs to align with the latest authoritative source data. Changes include major ownership renames and minor normalizations such as country code corrections. This update affects only the ASN dimension — the ISP dimension remains unchanged and accurate. A recurring refresh process is now in place to ensure ASN names remain up to date going forward.
May 7, 2026
Settings: New API Usage Dashboard Menu Item
Feature Update: Simplifies API Usage Dashboard access with a direct link in the Settings menu, eliminating multi-step navigation.
Click to expand the image:
Use Case: Quickly access API usage and determine the API traffic distribution across MCP-originated and direct Pulse data calls. Monitor MCP traffic usage to build efficient agentic data models for VSI and DPI data access.
Usage Dashboard: Improved API Usage Visibility in the Usage Dashboard
Feature Update: Introduces call origin filtering in the Usage Dashboard to distinguish between MCP-originated and Pulse API calls. This enhancement enables targeted analysis of traffic distribution, supports measurement of MCP adoption, and improves troubleshooting by isolating issues specific to each access path. The Call Origin filter provides options to view MCP-only, direct-only, or combined traffic, with dashboard metrics updating dynamically based on the selected configuration.
Click to expand the image:
Use Case: Check your overall API usage and determine the API traffic distribution across MCP-originated and direct Pulse data calls. Monitor MCP traffic usage to build efficient agentic data models for VSI and DPI data access.
SPI: Updated SPI Setting Persistence for Shared and Saved Dashboards
Feature Update: Updates SPI setting persistence so shared and saved dashboards maintain the SPI settings at the time the dashboards were generated.
The behavior of the SPI on shared dashboards depends on the date the share link was generated:
Links generated before March 26: The dashboard consistently displays the SPI based on the Overview dashboard setting, regardless of the SPI selection at the time of sharing.
Links generated on or after March 26: The dashboard displays the specific SPI setting selected at the time of sharing.
AI Alert Notification: Google Chat Notifications for AI Alerts (Beta)
Feature Update: Enhances the Conviva Notification Channel with support for AI Alerts in Google Chat Spaces as data-rich, structured notification cards. With this release, Google Chat appears as a notification channel within Conviva's existing notification service settings. The integration enables the delivery of AI-generated alerts directly to a selected Google Chat Space using Incoming Webhooks. These notifications render as data-rich Google Chat cards, ensuring structured, readable, and actionable alert messages with links to Conviva diagnostics features.
Click to expand the image:
Use Case: Set up Conviva Google Chat settings to reduce incident response times. For example, automatically route alerts about minutes with 4xx network response codes to the web services team's Google Chat channel, enabling engineers to proactively identify and resolve client-side errors before they impact users.
Rebrand note: Older releases on this page were published while this surface was labelled DPI. It is now App under the Conviva VSI umbrella, in both the documentation and the Pulse navigation. Older releases and their content are unchanged; going forward, release notes appear under the App label. See VSI Product Surfaces.
2026 Releases: Events and Metrics, Custom Dashboards, and Trends Enhancements
User Management: Viewer Access and MCP Access Permissions
Feature Update:
Two per-user permissions are now set from User Management. Viewer Access controls individual viewer- and user-level data — including the Users tab and the User module in App, and viewers, sessions, timelines, and Impacted Viewers across all Video and App dashboards. MCP Access controls whether the user can reach Conviva through the Model Context Protocol (MCP) with their Conviva sign-in; access through API credentials continues to be governed by API Management. Both permissions are granted for all existing users, so nothing changes on release day, and both are cleared by default on the Invite User screen, so an admin grants them explicitly for a new user. A change takes effect the next time the user signs in.
Settings > User Management > Modify User > Permissions.
Use Case:
Restrict individual viewer data to the teams that need it, and decide per user who can query Conviva from an MCP client — without creating a separate role.
User Management: Edit a Permission in Bulk Across Users and Accounts
Feature Update:
Every permission is now its own sortable, filterable column in the User Management grid. Filter to the users you want, select them, and click Edit Permissions to set one permission to one value across several accounts in a single action. Accounts where you cannot grant that permission are disabled, a single action is limited to 50 operations (selected users multiplied by selected accounts), and a review step returns a per-user, per-account success or failure summary.
Settings > User Management > Edit Permissions.
Use Case:
Roll a permission out — or take it away — for a whole team across the accounts they work in, instead of opening each user one at a time.
User Management: Block Invitations to Non-Federated Domains
Feature Update:
On an account with this control enabled, Conviva validates the email domain of every invitation at User Management > Invite User against the account's configured SSO domain list and rejects invitations to any other domain. The approved-domain list is maintained by Conviva rather than exposed in the UI. Existing users on other domains are unaffected — only new invitations are blocked. The control is not self-serve; request it through Conviva Support.
Use Case:
Keep account access inside your federated identity provider, so every new user arrives through SSO instead of a personal or third-party email address.
Notifications: Mute Rules (Beta) for Condition-Based Alert Muting
Feature Update:
Mute Rules let you suppress AI Alert notifications for a defined time window based on dimension and/or metric conditions, across one or more notification channels. Choose Mute Specific to silence the alerts that match a condition, or Mute everything except to silence everything else. Rules are defined once, attached to the channels they apply to, and listed by Active, Scheduled, or Expired status. Available in Video, Ads, and App.
The Mute Rules list — review Active & Scheduled, All, or Expired rules at a glance.
Use Case:
During a known incident or maintenance window, mute just the noisy slice — a single device OS, a specific metric, one webhook target — so on-call teams keep seeing the alerts that matter. Alerts still appear on the Alert Listing page; only the notifications are suppressed.
A deprecation notice is now live in the App surface. Paths, Funnels, Pattern Analytics, Predictive Intelligence, and Cohort Replay are being removed from App by 31 August 2026. The use cases behind these five modules — cross-session journey analysis, behavioral pattern detection, and predictive modeling — are now addressed in Conviva Digital Patterns Insights (DPI), a separate standalone product.
The deprecation notice as it appears in the App header in Pulse.
Use Case:
Everything else in App is unaffected — Trends, Overview, Real-Time Monitoring, AI Alerts, Journey Analytics (Flows), User Timeline, Custom Dashboards, and Custom Metrics continue unchanged. To learn about the Digital Patterns Insights experience and plan a transition, contact your Conviva account team.
Navigation: Pulse Product Surfaces Renamed to Video and App
Feature Update:
The Pulse navigation labels now match the VSI product-surface model: DPI is renamed to App, and Video Streaming Insights is renamed to Video. Ads is unchanged. This is a labelling change only — no dashboards, metrics, filters, saved views, permissions, or API behavior changed, and no action is required.
Pulse left navigation — Video and App now carry the product-surface names used across VSI.
Use Case:
Consistent, customer-facing names across Video, App, and Ads make it clear which surface you are in and which product a given capability belongs to.
Refreshes the ASN display names for approximately 40,000 ASNs to align with the latest authoritative source data. Changes include major ownership renames and minor normalizations such as country code corrections. This update affects only the ASN dimension — the ISP dimension remains unchanged and accurate. A recurring refresh process is now in place to ensure ASN names remain up to date going forward.
Simplifies API Usage Dashboard access with a direct link in the Settings menu, eliminating multi-step navigation.
Click to expand the image
Use Case:
Quickly access API usage and determine the API traffic distribution across MCP-originated and direct Pulse data calls. Monitor MCP traffic usage to build efficient agentic data models for VSI and DPI data access.
Usage Dashboard: Improved API Usage Visibility in the Usage Dashboard
Feature Update:
Introduces call origin filtering in the Usage Dashboard to distinguish between MCP-originated and Pulse API calls. This enhancement enables targeted analysis of traffic distribution, supports measurement of MCP adoption, and improves troubleshooting by isolating issues specific to each access path. The Call Origin filter provides options to view MCP-only, direct-only, or combined traffic, with dashboard metrics updating dynamically based on the selected configuration.
Click to expand the image
Use Case:
Check your overall API usage and determine the API traffic distribution across MCP-originated and direct Pulse data calls. Monitor MCP traffic usage to build efficient agentic data models for VSI and DPI data access.
Introduces a new Events section in the Overview Dashboard to analyze the occurrence of various events. Additionally, click on the specific event to view the preset for the selected event, which accelerates event-based data analysis and anomaly detection. Each preset includes a predefined set of key metrics and corresponding dimension data, offering a structured starting point for investigating trends and identifying issues across critical user experience areas. These presets reduce setup time and promote consistent data analysis across teams.
Click to expand the image
Use Case:
Select the event preset to gain quick insights into user experiences on that platform. From the Events drop-down, select the event preset to gain quick insights, such as which app versions and devices were most impacted by 5xx server errors and app crashes. This preset supports efficient issue detection, performance optimization, and root cause analysis, enabling faster resolution of user-impacting issues across web and mobile platforms.
AI Alert Notification: Google Chat Notifications for AI Alerts (Beta)
Feature Update:
Enhances the Conviva Notification Channel with support for AI Alerts in Google Chat Spaces as data-rich, structured notification cards. With this release, Google Chat appears as a notification channel within Conviva’s existing notification service settings. The integration enables the delivery of AI-generated alerts directly to a selected Google Chat Space using Incoming Webhooks. These notifications render as data-rich Google Chat cards, ensuring structured, readable, and actionable alert messages with links to Conviva diagnostics features.
Click to expand the image
Use Case:
Set up Conviva Google Chat settings to reduce incident response times. For example, automatically route alerts about minutes with 4xx network response codes to the web services team's Google Chat channel, enabling engineers to proactively identify and resolve client-side errors before they impact users.
Trends: Percentile Aggregation for Flow-Duration and Custom Metrics (Beta)
Feature Update:
Adds support for percentile values with a dynamic Aggregation Selector that toggles between percentiles and averages in the Trends dashboard. Percentile-based aggregation (P50, P75, P90, P95, P99) enables the Flow-Duration and Custom metrics to provide a more precise view of Flow-Duration and Custom performances.
Click to expand the image
Use Case:
Using the P95 metric value for the average duration of the Payment Complete Flow helps identify slow client-side navigations that affected a small (5%) but meaningful subset of users. While the average duration for completing the Payment Complete Flow may appear acceptable, the P95 reveals routes, devices, or browsers where the payment completion steps took significantly longer than most other app transitions, thereby impacting perceived responsiveness. Going beyond the average value, percentile values enable teams to isolate and optimize the most impacted performance issues that degrade the user experience.
Metric Builder: Adds an Option for Additional Dimensions in Flows and Custom Metrics Settings
Feature Update:
Adds support for additional event-based dimensions, beyond the out-of-box dimensions, for Flows and custom metrics. Specify whether the dimension value is based on the first-observed event value or the last observed event value, enabling more control of the dimensional values for richer analysis of the configured Flows and custom metrics.
Click to expand the image
Use Case:
Enhance Checkout Flow analysis with the payment_method dimension.
Use the last observed event as the dimension value as payment_method is reported on intermediate events within the checkout flow from Checkout Start to Receipt Page Viewed, rather than only at the Flow start or complete events.
This enhanced flow-level analysis by payment method enables identification of conversion drop-offs, error patterns, and performance differences based on payment types, supporting more targeted optimization and troubleshooting of the payment processes related to the Flow.
Custom Dimension: Promotion of Event Tags to Global Tags
Custom Dimension: Promotion of Event Tags to Global Tags
Feature Update:
Adds support for promoting event tags as a global dimension across all relevant events, enabling an existing event-level tag to function as a global tag across all relevant events. This update makes it easy to update an event tag to persist across dimensions when a tag represents global context.
Global tags are commonly for user levels or environment data that apply to the current event and all future occurrences of the event until cleared by session or Flow instance.
Click to expand the image
Use Case:
When adding a custom dimension, promote the AccountStatus tag key as a global dimension to perform dimensional analysis of account-related activity, such as page views, clicks, and purchases, across different account status values, including upsell, silverPlan, and goldPlan.
This enhanced analysis by account status helps identify how user behavior, engagement, and conversion patterns vary across subscription tiers, enabling more targeted optimization and troubleshooting.
Trends: Percentile Aggregation for Duration Metrics (Beta)
Feature Update:
Adds a dynamic Aggregation Selector to toggle between percentiles and averages in the Trends dashboard, enabling percentile-based aggregation (P50, P75, P90, P95, P99) for Duration metrics to gain a more precise view of duration performances.
Click to expand the image
Use Case:
Using the P95 metric value for Soft Navigation Time helps identify slow client-side navigations that affected a small (5%) but meaningful subset of users. While average soft navigation time may appear acceptable, P95 reveals routes, devices, or browsers where in-app transitions took significantly longer than most other app transitions, impacting perceived responsiveness. Going beyond the average value, percentile values enable teams to isolate and optimize client-side rendering or script execution issues that degrade the user experience.
For Conviva App 2024 releases, see App 2024 Releases.
2023 Releases
For Conviva App 2023 releases, see App 2023 Releases.
Ads Releases
What's New in Conviva Ads
<h3 id="Ads" data-magellan-target="Ads">Ads</h3>
<div class="whats_new">
<h4>2026 Releases</h4>
<h4 class="IncludeInTOC" id="August272026" data-magellan-target="August272026"><b>August 27, 2026</b> <span class="tag tag--new">New</span>
</h4>
<div>
<h4 id="ad_playback_failures_alerts" data-magellan-target="ad_playback_failures_alerts">AI Alerts: Ad Playback Failures Added to Ads AI Alerts</h4>
<p><b>Feature Update:</b>
</p>
<p><i>Ad Playback Failures</i> is now a supported Ads AI Alerts metric. Ads AI Alerts previously covered the start of the ad only, so an ad that started cleanly and then broke mid-roll surfaced in next-day reporting rather than in real-time. The metric is added by default with a default sensitivity for all Ad customers, is tunable like any other ad metric under <b>AI Alerts</b> > <b>Alert Config</b> > <b>Ad</b>, and participates in the standard AI Alerts diagnostics and root-cause flow. Existing ad alert configurations are unaffected.</p>
<p><b>Use Case:</b>
</p>
<p>Catch failures inside the ad break while the break is still running, instead of reconciling lost impressions the next day.</p>
<p style="color: #000000;"><b>More Details</b>: <a href="/sei/ads/alerts/ad-insights-ai-alerts/">Ads AI Alerts</a>.</p>
</div>
<h4 class="IncludeInTOC" id="August132026" data-magellan-target="August132026"><b>August 13, 2026</b> <span class="tag tag--new">New</span>
</h4>
<div>
<h4>Notifications: Mute Rules (Beta) for Condition-Based Alert Muting</h4>
<p><b>Feature Update:</b>
</p>
<p>Mute Rules let you suppress AI Alert notifications for a defined time window based on dimension and/or metric conditions, across one or more notification channels. Choose <b>Mute Specific</b> to silence the alerts that match a condition, or <b>Mute everything except</b> to silence everything else. Rules are defined once, attached to the channels they apply to, and listed by Active, Scheduled, or Expired status. Available in Video, Ads, and App.</p>
<img src="/resources/images/ei_application/ei_release_notes/mute_rules_new_rule.png" class="doc-img" data-width="70" alt="New Mute Rule screen with the name MuteAllExceptiOS, a no-end-date time window, the Mute everything except rule type, a Device Operating System Equals iOS dimension condition, and a Webhook channel" />
<p><i>Creating a Mute Rule — time window, rule type, dimension and metric conditions, and channels.</i></p>
<p><b>Use Case:</b>
</p>
<p>During a known incident or maintenance window, mute just the noisy slice — a single device OS, a specific metric, one webhook target — so on-call teams keep seeing the alerts that matter. Alerts still appear on the Alert Listing page; only the notifications are suppressed.</p>
<p style="color: #000000;"><b>More Details</b>: <a href="/sei/video/mute-rules-beta/">Mute Rules (Beta)</a>.</p>
</div>
<h4>2025 Releases</h4>
<h4 class="IncludeInTOC" id="February202025" data-magellan-target="February202025"><b>February 20, 2025</b>
</h4>
<div>
<h4>Dedicated AI Alerts Dashboard for Video and Ads</h4>
<table style="width: 100%; margin-left: 0; margin-right: auto;" class="table-image">
<col data-mc-conditions="" />
<tbody>
<tr>
<td>
<p>
<img src="/resources/images/ei_application/ei_release_notes/ei_alerts.png" style="mc-thumbnail: none;border-left-style: solid;border-left-width: 1px;border-left-color: ;border-right-style: solid;border-right-width: 1px;border-right-color: ;border-top-style: solid;border-top-width: 1px;border-top-color: ;border-bottom-style: solid;border-bottom-width: 1px;border-bottom-color: ;height: auto;width: 80%;" alt="" />
</p>
</td>
</tr>
</tbody>
</table>
<p><b>Feature Update:</b>
</p>
<p>Enhances AI alert analysis with a separate dashboard dedicated to Video and Ads AI alerts, along with a new Peak Value column. This dedicated dashboard provides focused monitoring of video and ad-related alerts and streamlined reporting of alert data, improving root cause visibility and, with the Peak Value column, enhancing analysis of issue impacts.</p>
<p class="image_title">Click to expand the image</p>
<p><a class="MCPopupThumbnailLink MCPopupThumbnailPopup" href="/resources/images/ei_application/ei_whats_new_images/ei_ai_alerts_new_dashbrd/ai_alerts_af_bf.png" data-mc-popup-alt=""><img class="MCPopupThumbnail img" data-mc-width="1816" data-mc-height="510" src="/resources/images/ei_application/ei_whats_new_images/ei_ai_alerts_new_dashbrd/ai_alerts_af_bf.png" alt="" title="Click to expand the image" tabindex="" style="mc-thumbnail: popup;border-left-style: solid;border-left-width: 1px;border-left-color: #0000ff;border-right-style: solid;border-right-width: 1px;border-right-color: #0000ff;border-top-style: solid;border-top-width: 1px;border-top-color: #0000ff;border-bottom-style: solid;border-bottom-width: 1px;border-bottom-color: #0000ff;mc-thumbnail-max-width: 4.5in;mc-thumbnail-max-height: 5in;max-width: 4.5in;max-height: 5in;" /></a>
</p>
<p><b>Use Case:</b>
</p>
<p>Use the AI Alerts dashboard to identify important anomalies and jump to a detailed anomaly analysis with the Root Cause Leads link. In this example, the Root Cause Leads link for the selected alert (Akamai (CDN)) opens the AI Alert Diagnostics page for quick access to the impacted dimensions in the dimension tables. Also, see the peak value details to know the highest value of the metric, helping in the analysis of the issue impacts.</p>
<p style="color: #000000;"><b>More Details</b>: <a href="alerts/ad-insights-ai-alerts.html">AI Alerts</a>.</p>
</div>
<h4 class="IncludeInTOC" id="Februrary62025" data-magellan-target="Februrary62025"><b>Februrary 6, 2025</b>
</h4>
<ul>
<li>
<p><a href="#Clone">Clone Saved Dashboards</a>
</p>
</li>
<li>
<p><a href="#Convert">Convert Private Dashboards to Public -- Saved Dashboards</a>
</p>
</li>
</ul>
<div>
<h4>Clone Saved Dashboards</h4>
<table style="width: 100%; margin-left: 0; margin-right: auto;" class="table-image">
<col data-mc-conditions="" />
<tbody>
<tr>
<td>
<p>
<img src="/resources/images/ei_application/ei_release_notes/ei_clone_dashboard_list.png" style="mc-thumbnail: none;border-left-style: solid;border-left-width: 1px;border-left-color: ;border-right-style: solid;border-right-width: 1px;border-right-color: ;border-top-style: solid;border-top-width: 1px;border-top-color: ;border-bottom-style: solid;border-bottom-width: 1px;border-bottom-color: ;height: auto;width: 85%;" alt="" />
</p>
</td>
</tr>
</tbody>
</table>
<p><b>Feature Update:</b>
</p>
<p>Enhances Saved Dashboards with a new option to clone saved Trends, Real-Time, and MetricLens dashboards. This feature enables customization based on the original dashboard, simplifying the sharing and modifying saved dashboards.</p>
<p><b>Use Case:</b>
</p>
<p>Use the clone feature to create a copy of a saved dashboard, customize the dashboard settings, for example changing the interval from 1 day to the last 7 days, and share the dashboard with the expanded data for further collaboration the with other users. </p>
<p style="color: #000000;"><b>More Details</b>: <a href="dashboards/ad-insights-ad-experience-dashboard.htm#cloning">Trends</a>.</p>
</div>
</div>
<div>
<h4>Convert Private Dashboards to Public -- Saved Dashboards</h4>
<table style="width: 100%; margin-left: 0; margin-right: auto;" class="table-image">
<col data-mc-conditions="" />
<tbody>
<tr>
<td>
<p>
<img src="/resources/images/ei_application/ei_release_notes/ei_priv_to_public.png" style="mc-thumbnail: none;border-left-style: solid;border-left-width: 1px;border-left-color: ;border-right-style: solid;border-right-width: 1px;border-right-color: ;border-top-style: solid;border-top-width: 1px;border-top-color: ;border-bottom-style: solid;border-bottom-width: 1px;border-bottom-color: ;height: auto;width: 50%;" alt="" />
</p>
</td>
</tr>
</tbody>
</table>
<p><b>Feature Update:</b>
</p>
<p>Enhances the Saved Dashboards with a new option to change the private setting to public. This feature makes it easier to change shared dashboard viewing options from private to public.</p>
<p class="image_title">Click to expand the image</p>
<p><a class="MCPopupThumbnailLink MCPopupThumbnailPopup" href="/resources/images/ei_application/ei_whats_new_images/ei_convert_private_public/ei_convert_af_bf.png" data-mc-popup-alt=""><img class="MCPopupThumbnail img" data-mc-width="1837" data-mc-height="322" src="/resources/images/ei_application/ei_whats_new_images/ei_convert_private_public/ei_convert_af_bf.png" alt="" title="Click to expand the image" tabindex="" style="mc-thumbnail: popup;border-left-style: solid;border-left-width: 1px;border-left-color: #0000ff;border-right-style: solid;border-right-width: 1px;border-right-color: #0000ff;border-top-style: solid;border-top-width: 1px;border-top-color: #0000ff;border-bottom-style: solid;border-bottom-width: 1px;border-bottom-color: #0000ff;mc-thumbnail-max-width: 4.5in;mc-thumbnail-max-height: 5in;max-width: 4.5in;max-height: 5in;" /></a>
</p>
<p><b>Use Case:</b>
</p>
<ul>
<li>
<p>Select a dashboard under the <b>My Dashboard</b> list.</p>
</li>
<li>
<p>Click the <b>Edit</b> icon under the <i>Actions</i> column.</p>
</li>
<li>
<p>On the Update Dashboard screen, select the <b>Make it Public</b> checkbox.</p>
</li>
<li>
<p>Click <b>Update</b> to see the dashboard under the <b>Public Dashboard</b> tab list. <br /></p>
</li>
</ul>
<p>Share the dashboard to collaborate with other users. </p>
<p style="color: #000000;"><b>More Details</b>: <a href="dashboards/ad-insights-ad-experience-dashboard.htm#saving-ad-experience-dashboards">Trends</a>.</p>
Custom Dashboards Releases
Enable DoD Option -- Custom Dashboards Schedule (Feb 2025)
Feature Update:
Includes a new Enable DoD option in the Custom Dashboards Email Schedule to include comparison data of the selected dimensions and metrics based on the specified time range. This update improves the data analysis with the color coded comparison value next to the metrics providing a quick insight into the performance changes. Also, displays the high and low data for the selected metrics.
Click to expand the image
Use Case:
After receiving a Custom Dashboards email with the DoD option enabled, analyze performance changes by reviewing the highlighted high and low values for the selected dimensions and metrics to quickly compare performance impacts.
For more details about these and other App updates, see What's New in App.
Precision Releases
What's New in Precision
<h3 id="Precision" data-magellan-target="Precision">Precision</h3>
<div class="whats_new">
<h4>2024 Releases</h4>
<h4 class="IncludeInTOC" id="August222024" data-magellan-target="August222024"><b>August 22, 2024</b>
</h4>
<ul>
<li>
<p><a href="#Schedule">Schedule Reordered Precision Policies </a>
</p>
</li>
<li>
<p><a href="#Resilenc">Resiliency Tracking Dashboard - UI Update</a>
</p>
</li>
</ul>
<h4>Schedule Reordered PrecisiFilter builderon Policies </h4>
<table style="width: 100%; margin-left: 0; margin-right: auto;" class="table-image">
<col data-mc-conditions="" />
<tbody>
<tr data-mc-conditions="">
<td data-mc-conditions="General.Do Not Distribute">
<img src="/resources/images/precision_user_guide/release_notes/precision_reorder_policies.png" style="mc-thumbnail: none;border-left-style: solid;border-left-width: 1px;border-left-color: ;border-right-style: solid;border-right-width: 1px;border-right-color: ;border-top-style: solid;border-top-width: 1px;border-top-color: ;border-bottom-style: solid;border-bottom-width: 1px;border-bottom-color: ;height: auto;width: 85%;" alt="" />
</td>
</tr>
</tbody>
</table>
<p style="color: #000000;"><b>Feature Update:</b>
</p>
<p>Enhances the Precision Policies reordering with schedule. This allows you schedule the reordered policy based on the requirement. </p>
<p><b>Use Case:</b>
</p>
<p>This feature allows you to easily schedule the reordered policies based on the requirement.</p>
<p style="color: #000000;"><b>More Details</b>: <a href="dashboards/policies_dashboard.htm">Policies Dashboard</a>.</p>
<h4>Resiliency Tracking Dashboard - UI Update</h4>
<table style="width: 100%; margin-left: 0; margin-right: auto;" class="table-image">
<col data-mc-conditions="" />
<tbody>
<tr data-mc-conditions="">
<td data-mc-conditions="General.Do Not Distribute">
<img src="/resources/images/precision_user_guide/release_notes/resiliency_dashboard.png" style="mc-thumbnail: none;border-left-style: solid;border-left-width: 1px;border-left-color: ;border-right-style: solid;border-right-width: 1px;border-right-color: ;border-top-style: solid;border-top-width: 1px;border-top-color: ;border-bottom-style: solid;border-bottom-width: 1px;border-bottom-color: ;height: auto;width: 70%;" alt="" />
</td>
</tr>
</tbody>
</table>
<p style="color: #000000;"><b>Feature Update:</b>
</p>
<p>Enhances the Resiliency dashboard with</p>
<ul>
<li>
<p> New UI providing a section for filters, widgets, and dimension data for a better user experience. </p>
</li>
<li>
<p>Introduction of the Export option. </p>
</li>
</ul>
<p>This dashboard summarizes the Impact Avoidance Events triggered by Precision due to deviation in CDN performance.</p>
<p><b>Use Case:</b>
</p>
<p>Use this dashboard to identify the CDN-ISP combinations with most issues. This information helps you adjust percentage allocations during important events and address concerns with specific CDNs to improve network performance with certain ISPs in specific regions.</p>
<p style="color: #000000;"><b>More Details</b>: <a href="dashboards/resiliency_tracking_dashboard.htm">Resiliency Dashboard</a>.</p>
<h4 class="IncludeInTOC" id="July32024" data-magellan-target="July32024"><b>July 3, 2024</b>
</h4>
<h4>Precision Policies Reorder in Collapsed Mode</h4>
<table style="width: 100%; margin-left: 0; margin-right: auto;" class="table-image">
<col data-mc-conditions="" />
<tbody>
<tr data-mc-conditions="">
<td data-mc-conditions="General.Do Not Distribute">
<img src="/resources/images/precision_user_guide/release_notes/precision_reorder_collapse.png" style="mc-thumbnail: none;border-left-style: solid;border-left-width: 1px;border-left-color: ;border-right-style: solid;border-right-width: 1px;border-right-color: ;border-top-style: solid;border-top-width: 1px;border-top-color: ;border-bottom-style: solid;border-bottom-width: 1px;border-bottom-color: ;height: auto;width: 85%;" alt="" />
</td>
</tr>
</tbody>
</table>
<p style="color: #000000;"><b>Feature Update:</b>
</p>
<p>Enhances the Precision Policies dashboard with,</p>
<ul>
<li>
<p> An <b>Expanded View</b> toggle allows you to switch between the collapsed mode and expanded mode. </p>
</li>
<li>
<p>The collapsed mode allows you to seamlessly drag and drop policies while viewing the new and previous sequence numbers.</p>
<p>Additionally, you can use the collapsed view outside the reorder workflow to expand specific rows to read the details.</p>
</li>
</ul>
<p><b>Use Case:</b>
</p>
<p>This feature allows you to easily reorder the policies while seeing the new and earlier sequence numbers. This enables you to prioritise the unconstrained and constrained policies correctly or ensure that the overlapping/conflicting filters are applied in the right order.</p>
<p style="color: #000000;"><b>More Details</b>: <a href="dashboards/policies_dashboard.htm">Policies Dashboard</a>.</p>
<p style="color: #000000;"> </p>
</div>
<h4 class="IncludeInTOC" id="2021Releases" data-magellan-target="2021Releases">2021 Releases</h4>
<h4><b>September 23, 2021 Front End Release</b>
</h4>
<p class="content_text">This release includes feature updates for Precision. </p>
<ul>
<li>
<p class="content_text">Users can now schedule Precision distribution policies to be activated at a scheduled time. In addition to activating Precision distribution policies immediately, selected administrators can activate single or multiple policies at a scheduled time. For more information, see <a href="dashboards/policies_dashboard.htm">Policies Dashboard</a>.</p>
</li>
</ul>
<p class="content_text"> </p>
Video and App Integration
Video Integration Releases
VSI Integration Tool
This section lists the release notes for the recent Conviva VSI Integration releases.
August 13, 2025
Enhances the Required Metadata:
The Live or VOD metadata is renamed to Content Category (isLive)
The Content Category metadata is renamed to Category Type (c3.cm.categoryType)
The enhancements are applicable to all user interfaces and reports of Video Integration.
<h4 class="IncludeInTOC" id="January232025" data-magellan-target="January232025"><b>January 23, 2025</b>
</h4>
<p>Introduces a note at the top of the report and the PDF/Excel exports if at least one testcase is failed.</p>
<p>
<img src="/resources/images/application_manager/am_reports_dashboard_failed.png" style="width: 85%;height: auto;border-left-style: solid;border-left-width: 1px;border-left-color: #000000;border-right-style: solid;border-right-width: 1px;border-right-color: #000000;border-top-style: solid;border-top-width: 1px;border-top-color: #000000;border-bottom-style: solid;border-bottom-width: 1px;border-bottom-color: #000000;" alt="" />
</p>
<p><b>More Details:</b> <a href="/Tools/application_manager_v2/dashboards/apps_dashboard.html#FaildTCNote" target="_blank">Apps dashboard</a>.</p>
<h4 class="IncludeInTOC" id="January092025" data-magellan-target="January092025"><b>January 09, 2025</b>
</h4>
<p>Enhances the metric names in the <i>Apps</i> and <i>Report</i> tabs depending on the customer type.</p>
<p>For example, </p>
<ul>
<li>
<p>Video-only customers see the metrics labeled as "VSF" (Video Start Failure), "VST" (Video Start Time), "VPF" (Video Playback Failure), and so on. </p>
</li>
<li>
<p>Stream-only customers see the same metrics labeled as "SSF" (Stream Start Failure), "SST" (Stream Start Time), and "SPF" (Stream Playback Failure).</p>
</li>
</ul>
<p>
<img src="/resources/images/application_manager/am_apps_wn_20250109.png" style="width: 85%;height: auto;border-left-style: solid;border-left-width: 1px;border-left-color: #000000;border-right-style: solid;border-right-width: 1px;border-right-color: #000000;border-top-style: solid;border-top-width: 1px;border-top-color: #000000;border-bottom-style: solid;border-bottom-width: 1px;border-bottom-color: #000000;" alt="" />
</p>
<p><b>More Details:</b> <a href="/Tools/application_manager_v2/dashboards/reports_dashboard.html#custom_metadata_tags" target="_blank">Reports dashboard</a>.</p>
<h4 class="IncludeInTOC" id="November212024" data-magellan-target="November212024"><b>November 21, 2024</b>
</h4>
<p>Introduces the <b>Content</b> and <b>Ad</b> tags to display custom metadata types in the <i>Apps</i>, <i>Metadata</i>, and <i>Reports</i> dashboards of video integration.</p>
<p>
<img src="/resources/images/application_manager/am_apps_wn_20241121.png" style="width: 85%;height: auto;border-left-style: solid;border-left-width: 1px;border-left-color: #000000;border-right-style: solid;border-right-width: 1px;border-right-color: #000000;border-top-style: solid;border-top-width: 1px;border-top-color: #000000;border-bottom-style: solid;border-bottom-width: 1px;border-bottom-color: #000000;" alt="" />
</p>
<p><b>More Details:</b><a href="/Tools/application_manager_v2/dashboards/apps_dashboard.html#custom_metadata_tags" target="_blank">Custom metadata in Apps dashboard</a>.</p>
<h4 class="IncludeInTOC" id="September272024" data-magellan-target="September272024"><b>September 27, 2024</b>
</h4>
<p>Introduces the <b>Share Report</b> option for copying the dashboard link to clipboard and sharing the test results with other users.</p>
<p>
<img src="/resources/images/application_manager/am_apps_wn_20240927.png" style="width: 85%;height: auto;border-left-style: solid;border-left-width: 1px;border-left-color: #000000;border-right-style: solid;border-right-width: 1px;border-right-color: #000000;border-top-style: solid;border-top-width: 1px;border-top-color: #000000;border-bottom-style: solid;border-bottom-width: 1px;border-bottom-color: #000000;" alt="" />
</p>
<p><b>More Details:</b><a href="/Tools/application_manager_v2/dashboards/apps_dashboard.html#ShareAppsDashboard" target="_blank">Share Apps Dashboard</a>.</p>
<h4 class="IncludeInTOC" id="April112024" data-magellan-target="April112024"><b>April 11, 2024</b>
</h4>
<ul>
<li>
<p>Introduces a new hierarchical menu structure for <i>Integration Tools</i>. As part of this improvement, the existing <i>App Manager</i> is renamed to <i>Video Integration</i>, and <b style="font-style: italic; font-weight: normal;">Sensor Integration</b> is replaced with <i>DPI Integration</i>.<br /></p>
<table style="width: 100%;border-spacing: 10px 10px;margin-left: auto;margin-right: auto;" class="table-image">
<col />
<col />
<tbody>
<tr>
<td>
<p><b>Before</b>
</p>
</td>
<td>
<p><b>After</b>
</p>
</td>
</tr>
<tr>
<td style="vertical-align: top;text-align: center;">
<img src="/resources/images/touchstone2_images/menu_integration_tools_old.png" style="border-left-style: solid;border-left-width: 1px;border-left-color: ;border-right-style: solid;border-right-width: 1px;border-right-color: ;border-top-style: solid;border-top-width: 1px;border-top-color: ;border-bottom-style: solid;border-bottom-width: 1px;border-bottom-color: ;height: auto;width: 35%;" alt="" />
</td>
<td style="vertical-align: top;text-align: center;">
<img src="/resources/images/touchstone2_images/menu_iintegration_tools_new.png" style="border-left-style: solid;border-left-width: 1px;border-left-color: ;border-right-style: solid;border-right-width: 1px;border-right-color: ;border-top-style: solid;border-top-width: 1px;border-top-color: ;border-bottom-style: solid;border-bottom-width: 1px;border-bottom-color: ;height: auto;width: 35%;" alt="" />
</td>
</tr>
</tbody>
</table>
</li>
</ul>
<p>
<br />
</p>
<ul>
<li>
<p>Introduces a new tab in Video Integration for accessing Touchstone 2.0 (Beta) version. This tab appears for only selected Touchstone 2.0 customers, allowing them to experience seamless self-validation of VSI sensor integration within Pulse without switching environments.<br /><br /><img src="/resources/images/touchstone2_images/menu_integration_tools_touchstone2_tab.png" style="border-left-style: solid;border-left-width: 1px;border-left-color: ;border-right-style: solid;border-right-width: 1px;border-right-color: ;border-top-style: solid;border-top-width: 1px;border-top-color: ;border-bottom-style: solid;border-bottom-width: 1px;border-bottom-color: ;height: auto;width: 40%;" alt="" /></p>
<p><b>More Details:</b><a href="/Tools/touchstone_v2/touchstone_2_help.html" target="_blank">Touchstone 2.0 Help</a>.</p>
</li>
</ul>
<h4 class="IncludeInTOC" id="June292023" data-magellan-target="June292023"><b>June 29, 2023</b>
</h4>
<p><b>New Feature:</b> Reports Dashboard - App Statistics and Integration Overview Reports</p>
<table style="width: 100%;border-spacing: 10px 10px;margin-left: 0;margin-right: auto;" class="table-image">
<col />
<col />
<tbody>
<tr>
<td>
<img src="/resources/images/application_manager/reports/am_reports_app_statistics.png" style="border-left-style: solid;border-left-width: 1px;border-left-color: ;border-right-style: solid;border-right-width: 1px;border-right-color: ;border-top-style: solid;border-top-width: 1px;border-top-color: ;border-bottom-style: solid;border-bottom-width: 1px;border-bottom-color: ;height: auto;width: 95%;" alt="" />
</td>
<td>
<img src="/resources/images/application_manager/reports/am_reports_integration_overview.png" style="border-left-style: solid;border-left-width: 1px;border-left-color: ;border-right-style: solid;border-right-width: 1px;border-right-color: ;border-top-style: solid;border-top-width: 1px;border-top-color: ;border-bottom-style: solid;border-bottom-width: 1px;border-bottom-color: ;height: auto;width: 95%;" alt="" />
</td>
</tr>
</tbody>
</table>
<p><b>New Features</b>
</p>
<p>The <b>Reports</b> dashboard displays validation test results of metrics and metadata for all of your device applications.<br />You can choose to see the validation results for either metrics or metadata for all or selected apps.</p>
<p>Using the <b>Reports</b> dashboard, view reports for:</p>
<ul>
<li>
<p>App Statistics</p>
<p>Use <b>App Statistics</b> report to learn about:</p>
<ul>
<li>
<p>The performance of metrics and metadata for all or specific apps</p>
</li>
<li>Apps that need the most attention (appearing first on the list)</li>
<li>Last validation date of the apps</li>
<li>Newest build or SDK version if available</li>
</ul>
</li>
<li>
<p>Integration Overview</p>
<p>Integration overview reports help to analyze the integration details and the validation improvement progress for each app for a selected time period of 3 months, 6 months, 9 months, or 12 months. These reports use graphical representations to show the impact or improvement of metrics and metadata.</p>
</li>
</ul>
<p><b>Feature Impact</b>
</p>
<ul>
<li>
<p>App Statistics report</p>
<ul>
<li>
<p>Provides action items to fix the under-performing metrics and metadata</p>
</li>
<li>
<p>Improves integration health </p>
</li>
<li>
<p>Supports downloading the app status report</p>
</li>
<li>
<p>Allows to compare integration health across all the platforms, and to prioritize fixing the apps in the priority order</p>
</li>
</ul>
</li>
<li>
<p>Integration Overview report</p>
<ul>
<li>
<p>Provides build submission ratio for each app, and sets KPI to improve integration and data on pulse</p>
</li>
<li>
<p> Enables mapping the <i>Validated - Not In Production</i> builds against the <i>Not validated - In production</i> builds</p>
</li>
<li>
<p> Saves time and efforts required from Conviva customer service team</p>
</li>
</ul>
</li>
</ul>
<p><b>More Details:</b> <a href="/Tools/application_manager_v2/dashboards/reports_dashboard.html" target="_blank">Viewing and Downloading Reports</a></p>
<h4><b>December 20, 2022</b>
</h4>
<p><b>New Feature:</b> Conviva Integration Plugin for Android</p>
<table style="width: 100%; margin-left: 0; margin-right: auto;" class="table-image">
<col />
<tbody>
<tr>
<td>
<img src="/resources/images/application_manager/am_apps_view_integration_details.png" style="border-left-style: solid;border-left-width: 1px;border-left-color: ;border-right-style: solid;border-right-width: 1px;border-right-color: ;border-top-style: solid;border-top-width: 1px;border-top-color: ;border-bottom-style: solid;border-bottom-width: 1px;border-bottom-color: ;height: auto;width: 90%;" alt="" />
</td>
<td>
<img src="/resources/images/application_manager/am_apps_detail_page_plugin_link.png" style="border-left-style: solid;border-left-width: 1px;border-left-color: ;border-right-style: solid;border-right-width: 1px;border-right-color: ;border-top-style: solid;border-top-width: 1px;border-top-color: ;border-bottom-style: solid;border-bottom-width: 1px;border-bottom-color: ;height: auto;width: 90%;" alt="" />
</td>
</tr>
</tbody>
</table>
<p><b>New Features</b>
</p>
<p>Introduces the Conviva<i> Integration Assistant </i> Plugin for Android that helps you integrate the Android players with only a few clicks.</p>
<p>While creating a new app, when you click the <i>View Integration Details</i> button for Android SDKs on <i>Integrate SDK/Library</i> page, you are redirected to the Conviva Docs Android Integration Assistant plugin page. You can download the plugin from here and follow the instructions to install and use it.</p>
<p>To access the plugin or integration details while you're on the existing app details page, click the "Simplified SDK: Android Player Name" link. </p>
<p><b>Feature Impact</b>
</p>
<ul>
<li>
<p>To simplify the integration, the plugin automatically adds the SDK dependencies to your Android project.</p>
</li>
<li>
<p>It generates the ConvivaHelper.java file with all the code that is required to invoke the integration.</p>
</li>
<li>
<p>It also lists the Advanced Use Cases for Android integration.</p>
</li>
</ul>
<p><b>More Details:</b> Android Integration Assistant Plugin</p>
<h4><b>August 28, 2022</b>
</h4>
<ul>
<li>
<p>Enhances the tool to open the tabs (Overview, Apps, Metadata, and Reports) and the apps in a new tab or a new window.</p>
</li>
</ul>
<table style="width: 100%; margin-left: 0; margin-right: auto;" class="table-image">
<col />
<tbody>
<tr>
<td>
<img src="/resources/images/application_manager/am_apps_open_new_tab.png" style="border-left-style: solid;border-left-width: 1px;border-left-color: ;border-right-style: solid;border-right-width: 1px;border-right-color: ;border-top-style: solid;border-top-width: 1px;border-top-color: ;border-bottom-style: solid;border-bottom-width: 1px;border-bottom-color: ;height: auto;width: 90%;" alt="" />
</td>
<td>
<img src="/resources/images/application_manager/am_apps_link_open_new_tab.png" style="border-left-style: solid;border-left-width: 1px;border-left-color: ;border-right-style: solid;border-right-width: 1px;border-right-color: ;border-top-style: solid;border-top-width: 1px;border-top-color: ;border-bottom-style: solid;border-bottom-width: 1px;border-bottom-color: ;height: auto;width: 90%;" alt="" />
</td>
</tr>
</tbody>
</table>
<ul>
<li>
<p>When the Touchstone Reference URL expires, the <i>Notes</i> field on the test results page shows as <i>Link expired</i>.</p>
</li>
</ul>
<table style="width: 100%; margin-left: 0; margin-right: auto;" class="table-image">
<col />
<tbody>
<tr>
<td>
<img src="/resources/images/application_manager/am_apps_ts_link_expired.png" style="border-left-style: solid;border-left-width: 1px;border-left-color: ;border-right-style: solid;border-right-width: 1px;border-right-color: ;border-top-style: solid;border-top-width: 1px;border-top-color: ;border-bottom-style: solid;border-bottom-width: 1px;border-bottom-color: ;height: auto;width: 70%;" alt="" />
</td>
</tr>
</tbody>
</table>
<h4><b>July 28, 2022</b>
</h4>
<p>This release enhances the features on the test pass report page of the VSI Integration:</p>
<ul>
<li>
<p> Email the test pass report to the person who submitted the build.</p>
</li>
</ul>
<ul>
<li>
<p>Add numbering to the test case execution and test pass report pages.</p>
</li>
</ul>
<table style="width: 100%; margin-left: 0; margin-right: auto;" class="table-image">
<col />
<tbody>
<tr>
<td>
<img src="/resources/images/application_manager/am_apps_test_results_page.png" style="border-left-style: solid;border-left-width: 1px;border-left-color: ;border-right-style: solid;border-right-width: 1px;border-right-color: ;border-top-style: solid;border-top-width: 1px;border-top-color: ;border-bottom-style: solid;border-bottom-width: 1px;border-bottom-color: ;height: auto;width: 70%;" alt="" />
</td>
</tr>
</tbody>
</table>
<h4><b>June 29, 2022</b>
</h4>
<p>This release enhances the test results page in the <i>Apps</i> tab with the <i>Unexpected Metadata Generated</i> section. This new section displays the metadata that isn't configured in the metadata engine during the app setup. You can review this unexpected metadata and configure it in the engine based on your need. You can choose to discard this information on the test results page. However, it's available on the <i>Metadata</i> tab.</p>
<table style="width: 100%; margin-left: 0; margin-right: auto;" class="table-image">
<col />
<tbody>
<tr>
<td>
<img src="/resources/images/application_manager/am_apps_unexpected_metadata.png" style="border-left-style: solid;border-left-width: 1px;border-left-color: ;border-right-style: solid;border-right-width: 1px;border-right-color: ;border-top-style: solid;border-top-width: 1px;border-top-color: ;border-bottom-style: solid;border-bottom-width: 1px;border-bottom-color: ;height: auto;width: 95%;" alt="" />
</td>
</tr>
<tr>
<td>
<img src="/resources/images/application_manager/am_metadata_review_unexpected_metadata.png" style="border-left-style: solid;border-left-width: 1px;border-left-color: ;border-right-style: solid;border-right-width: 1px;border-right-color: ;border-top-style: solid;border-top-width: 1px;border-top-color: ;border-bottom-style: solid;border-bottom-width: 1px;border-bottom-color: ;height: auto;width: 95%;" alt="" />
</td>
</tr>
</tbody>
</table>
<h4><b>May 26, 2022</b>
</h4>
<ul>
<li>
<p>Introduces the <i>Status Report Download</i> option in the <i>Reports</i> tab, where you can download either All Metrics and Metadata (the default option), Metrics Only, or Metadata Only data in an Excel file. You can choose a single app, several apps, or all apps to generate the report.</p>
</li>
</ul>
<table style="width: 100%; margin-left: 0; margin-right: auto;" class="table-image">
<col />
<col />
<tbody>
<tr>
<td>
<img src="/resources/images/application_manager/am_reports_status_report_download_options.png" style="border-left-style: solid;border-left-width: 1px;border-left-color: ;border-right-style: solid;border-right-width: 1px;border-right-color: ;border-top-style: solid;border-top-width: 1px;border-top-color: ;border-bottom-style: solid;border-bottom-width: 1px;border-bottom-color: ;height: auto;width: 70%;" alt="" />
</td>
<td>
<img src="/resources/images/application_manager/am_reports_status_download_report.png" style="border-left-style: solid;border-left-width: 1px;border-left-color: ;border-right-style: solid;border-right-width: 1px;border-right-color: ;border-top-style: solid;border-top-width: 1px;border-top-color: ;border-bottom-style: solid;border-bottom-width: 1px;border-bottom-color: ;height: auto;width: 70%;" alt="" />
</td>
</tr>
</tbody>
</table>
<ul>
<li>
<p>The <i>Hide Apps</i> option enables you to customize the reporting view. You can choose apps to hide them from reporting.</p>
</li>
<li>
<p>The <i>Test Pass</i> email notification contains an attachment of the test results in PDF format.</p>
</li>
<li>
<p>The test results page displays the count of failed test cases.</p>
</li>
</ul>
<table style="width: 100%; margin-left: 0; margin-right: auto;" class="table-image">
<col />
<tbody>
<tr>
<td>
<img src="/resources/images/application_manager/am_apps_failed_tcs_count.png" style="border-left-style: solid;border-left-width: 1px;border-left-color: ;border-right-style: solid;border-right-width: 1px;border-right-color: ;border-top-style: solid;border-top-width: 1px;border-top-color: ;border-bottom-style: solid;border-bottom-width: 1px;border-bottom-color: ;height: auto;width: 70%;" alt="" />
</td>
</tr>
</tbody>
</table>
<h4><b>April 28, 2022</b>
</h4>
<ul>
<li>
<p>Enhances the email notifications to send to the configured users when:</p>
<ul>
<li>
<p>An app is created or archived.</p>
</li>
</ul>
<ul>
<li>
<p>Builds are submitted or archived.</p>
</li>
<li>
<p>Builds are blocked by the QE team and awaiting input from the customer.</p>
</li>
<li>
<p>Builds are unblocked by providing the required comments.</p>
</li>
<li>
<p>Build validation is complete.</p>
</li>
</ul>
</li>
<li>
<p>Usability Enhancements</p>
<ul>
<li>
<p>The <i>Validate Integration</i> tab has additional instructions.</p>
</li>
<li>
<p><i>View All Metrics</i> toggle is available on the test results page to view all or limited content metrics and metadata. By default, the toggle is enabled and you can view all the metrics.</p>
</li>
</ul>
</li>
</ul>
<h4><b>April 18, 2022</b>
</h4>
<p>We are excited to announce the launch of Application Manager 2.0, a self-service portal with a guided workflow to set up your applications.</p>
<p>Your current Application Manager data will be maintained and also migrated to Application Manager 2.0 soon. Your Conviva representative will reach out to you when the 2.0 migration is done to address any queries you might have about the migration and your transition to the 2.0 application.</p>
<p>For more details, see the <a href="/Tools/application_manager_v2/application_manager_application.html">Application Manager 2.0 Help</a> topics in the Conviva Docs.</p>
<h3 id="Touchstone20" data-magellan-target="Touchstone20">Touchstone 2.0</h3>
<p>This section lists the release notes for the Touchstone.</p>
<h4 class="IncludeInTOC" style="font-weight: bold;" id="October172025" data-magellan-target="October172025">October 17, 2025</h4>
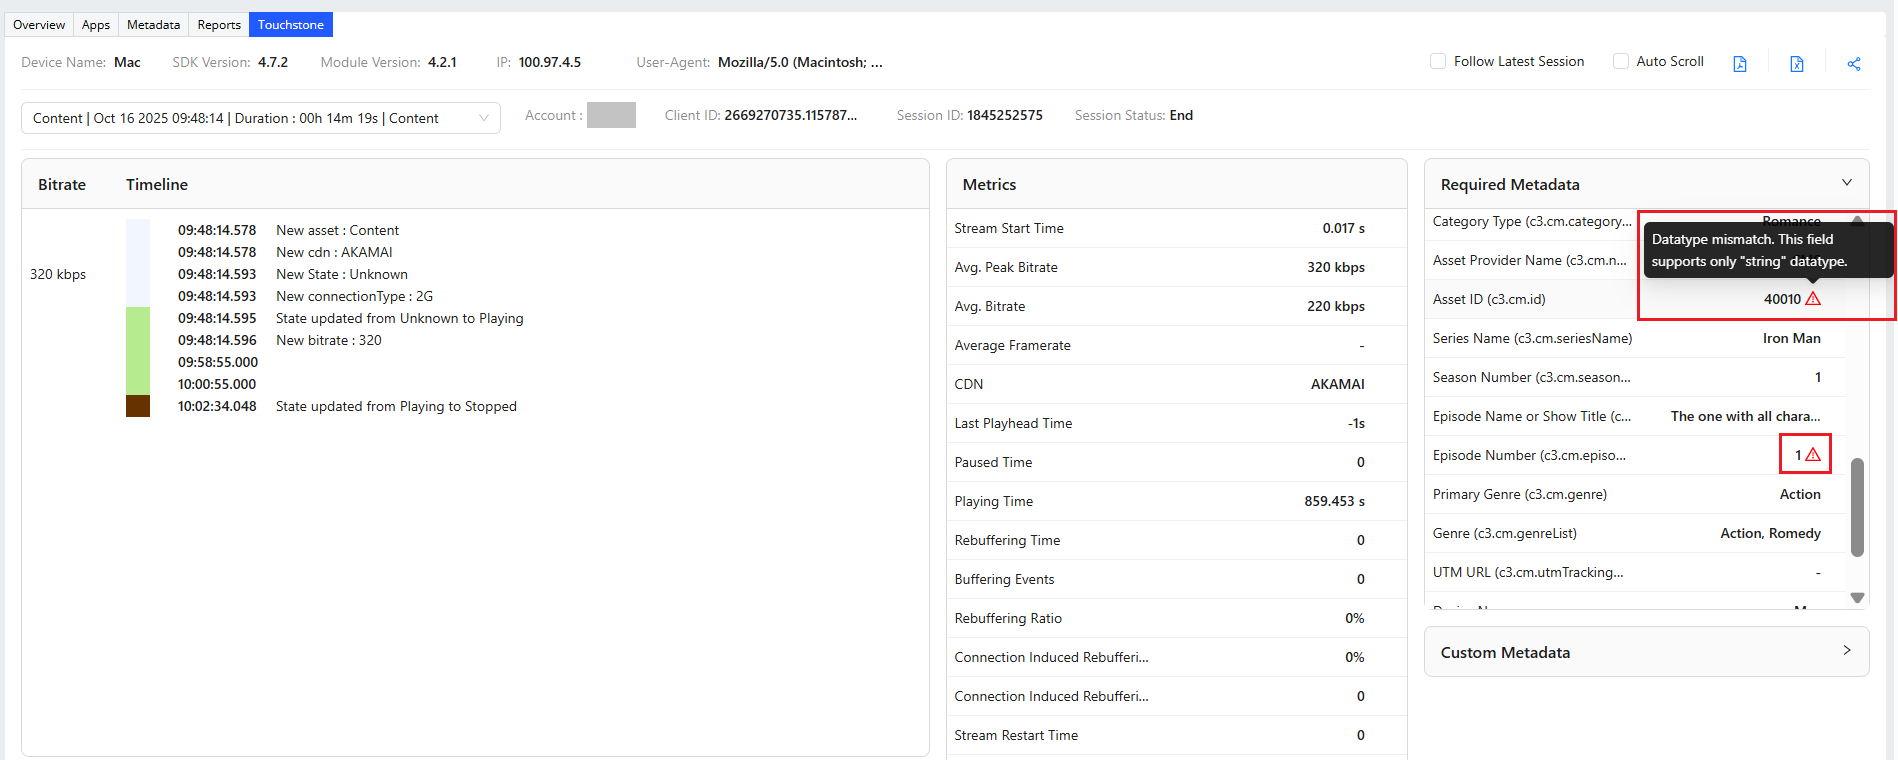
<p style="font-weight: normal;">Enhances the Required Metadata and Custom Metadata sections to highlight any metadata with an alert icon <img src="/resources/images/touchstone2_images/icon_alert.png" style="border-left-style: solid;border-left-width: 1px;border-left-color: #000000;border-right-style: solid;border-right-width: 1px;border-right-color: #000000;border-top-style: solid;border-top-width: 1px;border-top-color: #000000;border-bottom-style: solid;border-bottom-width: 1px;border-bottom-color: #000000;height: auto;width: 2%;" alt="" /> if there is any datatype mismatch. Hover the mouse pointer on the icon to see the alert message, for example "<i>Datatype mismatch. This field supports only "string" datatype</i>".</p>
<p>
<img src="/resources/images/touchstone2_images/wn_ts2_20251017.png" style="width: 85%;height: auto;border-left-style: solid;border-left-width: 1px;border-left-color: #000000;border-right-style: solid;border-right-width: 1px;border-right-color: #000000;border-top-style: solid;border-top-width: 1px;border-top-color: #000000;border-bottom-style: solid;border-bottom-width: 1px;border-bottom-color: #000000;" alt="" />
</p>
<p>For more details, see the <a href="/Tools/touchstone_v2/session_summary.html#datatype_mismatch" target="_blank">Session Summary</a> topic in the Conviva Docs. </p>
<h4 class="IncludeInTOC" style="font-weight: bold;" id="August1320251" data-magellan-target="August1320251">August 13, 2025</h4>
<ul>
<li>
<p>Enhances the Required Metadata:</p>
<ul>
<li>
<p>The <b>Live or VOD</b> metadata is renamed to <b>Content Category (isLive)</b></p>
</li>
<li>
<p>The <b>Content Category</b> metadata is renamed to <b>Category Type (c3.cm.categoryType)</b></p>
</li>
</ul>
</li>
</ul>
<div class="doc-callout doc-callout--note"><div class="doc-callout__body">The enhancements are applicable to all user interfaces and reports of Touchstone.</div></div>
<p>For more details, see the <a href="/Tools/touchstone_v2/session_summary.html" target="_blank">Session Summary</a> topic in the Conviva Docs. </p>
<h4 class="IncludeInTOC" style="font-weight: bold;" id="July032025" data-magellan-target="July032025">July 03, 2025</h4>
<ul>
<li>
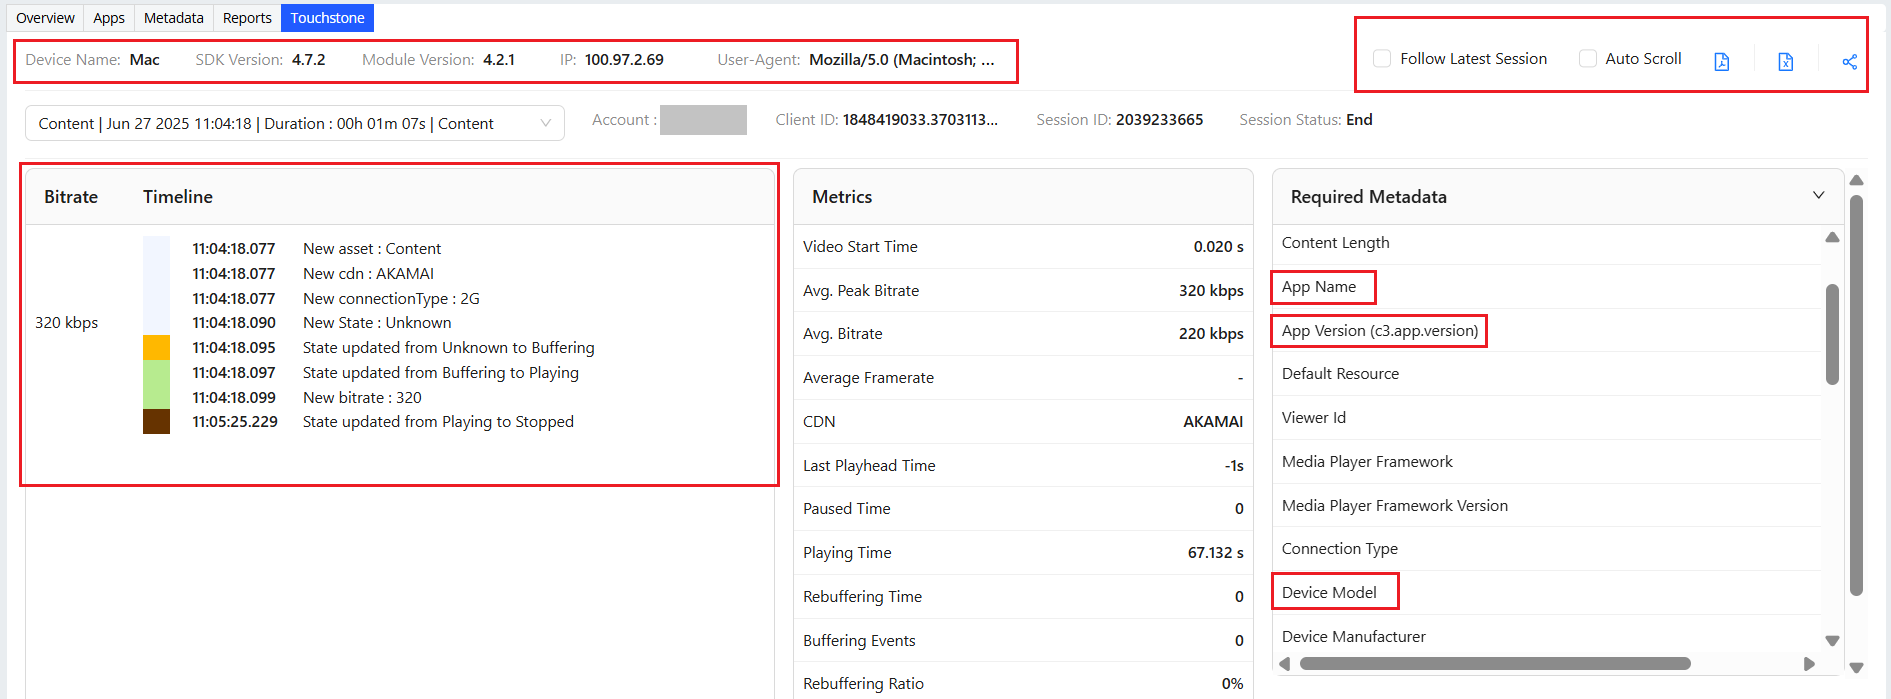
<p>Enhances the <i>Required Metadata</i> section to display the keys for Content tags (as c3.cm.*) and Ad tags (as c3.ad.*).</p>
</li>
</ul>
<ul>
<li>
<p>Relocates <b>App Version</b> from the header section to the <i>Required Metadata</i> section.</p>
</li>
<li>
<p>Removes: </p>
<ul>
<li>
<p>The <b>Device Model</b> and <b>Content Type</b> from the header, as these information are already available under the <i>Required Metadata</i> section.</p>
</li>
<li>
<p>The <b>Change Testing Device</b> icon from the header section and the BLUE-colored bar under the <b>Bitrate</b> field.</p>
</li>
</ul>
</li>
</ul>
<p>
<img src="/resources/images/touchstone2_images/ts2_wn_20250703.png" style="width: 85%;height: auto;border-left-style: solid;border-left-width: 1px;border-left-color: #000000;border-right-style: solid;border-right-width: 1px;border-right-color: #000000;border-top-style: solid;border-top-width: 1px;border-top-color: #000000;border-bottom-style: solid;border-bottom-width: 1px;border-bottom-color: #000000;" alt="" />
</p>
<p>For more details, see the <a href="/Tools/touchstone_v2/session_summary.html" target="_blank">Session Summary</a> topic in the Conviva Docs. </p>
<h4 class="IncludeInTOC" style="font-weight: bold;" id="June062025" data-magellan-target="June062025">June 06, 2025</h4>
<p>Deprecates the older version of Touchstone. Use the improved Touchstone 2.0 in Pulse for seamless debugging and self-validation of Conviva's VSI.</p>
<p>For more details, see the <a href="/Tools/touchstone_v2/touchstone_2_help.html" target="_blank">Self-Validation Using Touchstone</a> topic in the Conviva Docs. </p>
<h4 class="IncludeInTOC" style="font-weight: bold;" id="April102025" data-magellan-target="April102025">April 10, 2025</h4>
<p>Enhances all <i>Required Metadata</i> (except <b>Device Model</b>, <b>Browser Name</b>, and other device-related metadata) and <i>Custom Metadata</i> to:</p>
<ul>
<li>
<p> Show the metadata values as collected directly from the heartbeat.</p>
</li>
<li>
<p> Support mutability, that is, any changes in the metadata during an ongoing session.</p>
</li>
</ul>
<p>For more details, see the <a href="/Tools/touchstone_v2/session_summary.html#metadata_from_heartbeat" target="_blank">Session Summary</a> topic in the Conviva Docs. </p>
<h4 class="IncludeInTOC" style="font-weight: bold;" id="March252025" data-magellan-target="March252025">March 25, 2025</h4>
<ul>
<li>
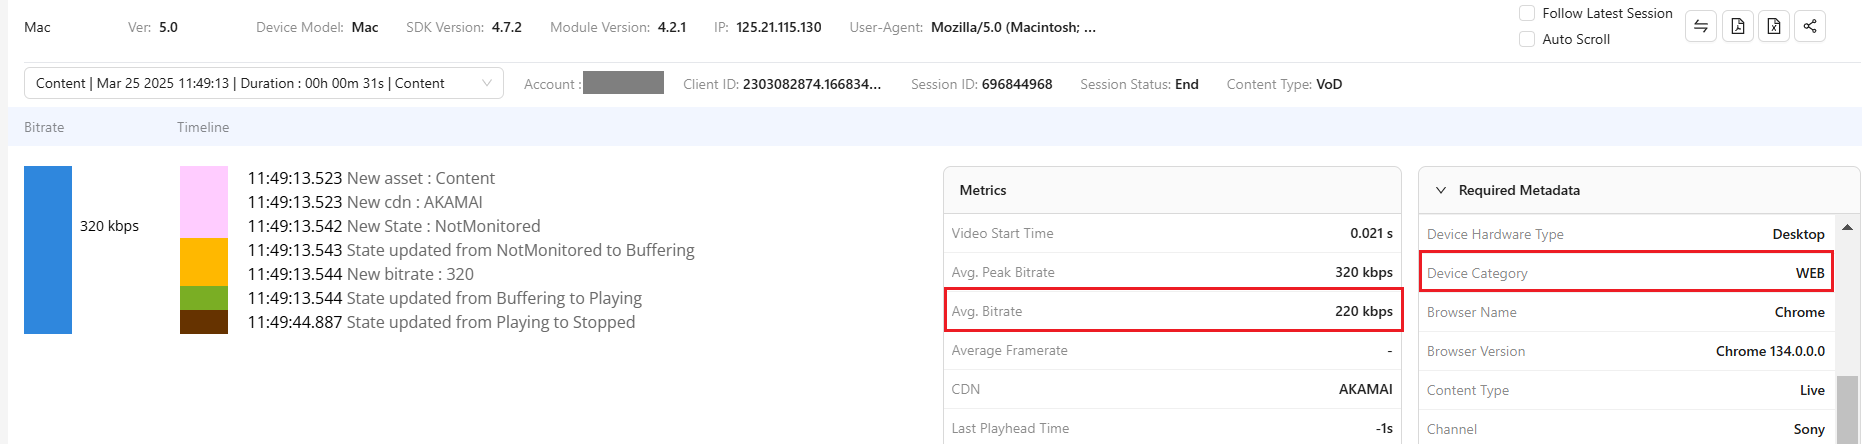
<p>Introduces a new <b>Avg. Bitrate</b> metric to show the latest average bitrate as collected from the heartbeat.</p>
</li>
<li>
<p>Enhances the <b>Device Category</b> metadata to show its value as collected from the heartbeat.</p>
</li>
</ul>
<p>
<img src="/resources/images/touchstone2_images/ts2_wn_20250325.png" style="width: 85%;height: auto;border-left-style: solid;border-left-width: 1px;border-left-color: #000000;border-right-style: solid;border-right-width: 1px;border-right-color: #000000;border-top-style: solid;border-top-width: 1px;border-top-color: #000000;border-bottom-style: solid;border-bottom-width: 1px;border-bottom-color: #000000;" alt="" />
</p>
<p>For more details, see the <a href="/Tools/touchstone_v2/session_summary.html#avg_bitrate" target="_blank">Session Summary</a> topic in the Conviva Docs. </p>
<h4 class="IncludeInTOC" style="font-weight: bold;" id="January2320251" data-magellan-target="January2320251">January 23, 2025</h4>
<ul>
<li>
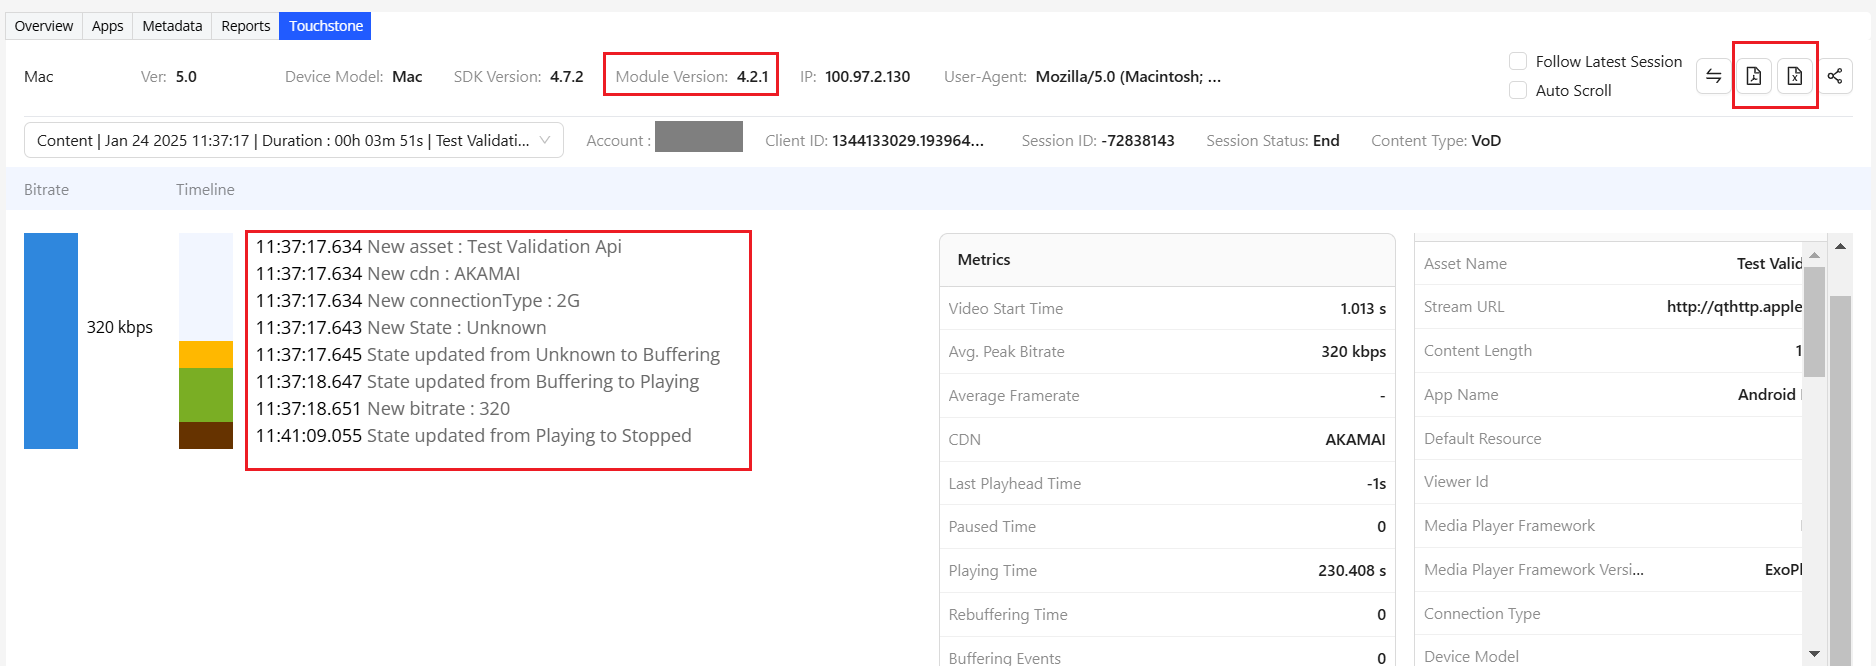
<p>Displays <b>Module Version</b> in the header section, if available in the heartbeat.</p>
</li>
<li>
<p>Displays CDN changes in the session timeline.</p>
</li>
<li>
<p>Simplifies the statements for player state change and event change in the session timeline.</p>
</li>
<li>
<p>Introduces two new icons for exporting the session summary in the PDF and Excel formats.</p>
</li>
</ul>
<p>
<img src="/resources/images/touchstone2_images/ts2_wn_20250123.png" style="width: 85%;height: auto;border-left-style: solid;border-left-width: 1px;border-left-color: #000000;border-right-style: solid;border-right-width: 1px;border-right-color: #000000;border-top-style: solid;border-top-width: 1px;border-top-color: #000000;border-bottom-style: solid;border-bottom-width: 1px;border-bottom-color: #000000;" alt="" />
</p>
<p>For more details about exporting session summary in the PDF format, see the <a href="/Tools/touchstone_v2/session_summary.html#ExportingSessiontoExcel" target="_blank">Session Summary</a> topic in the Conviva Docs. </p>
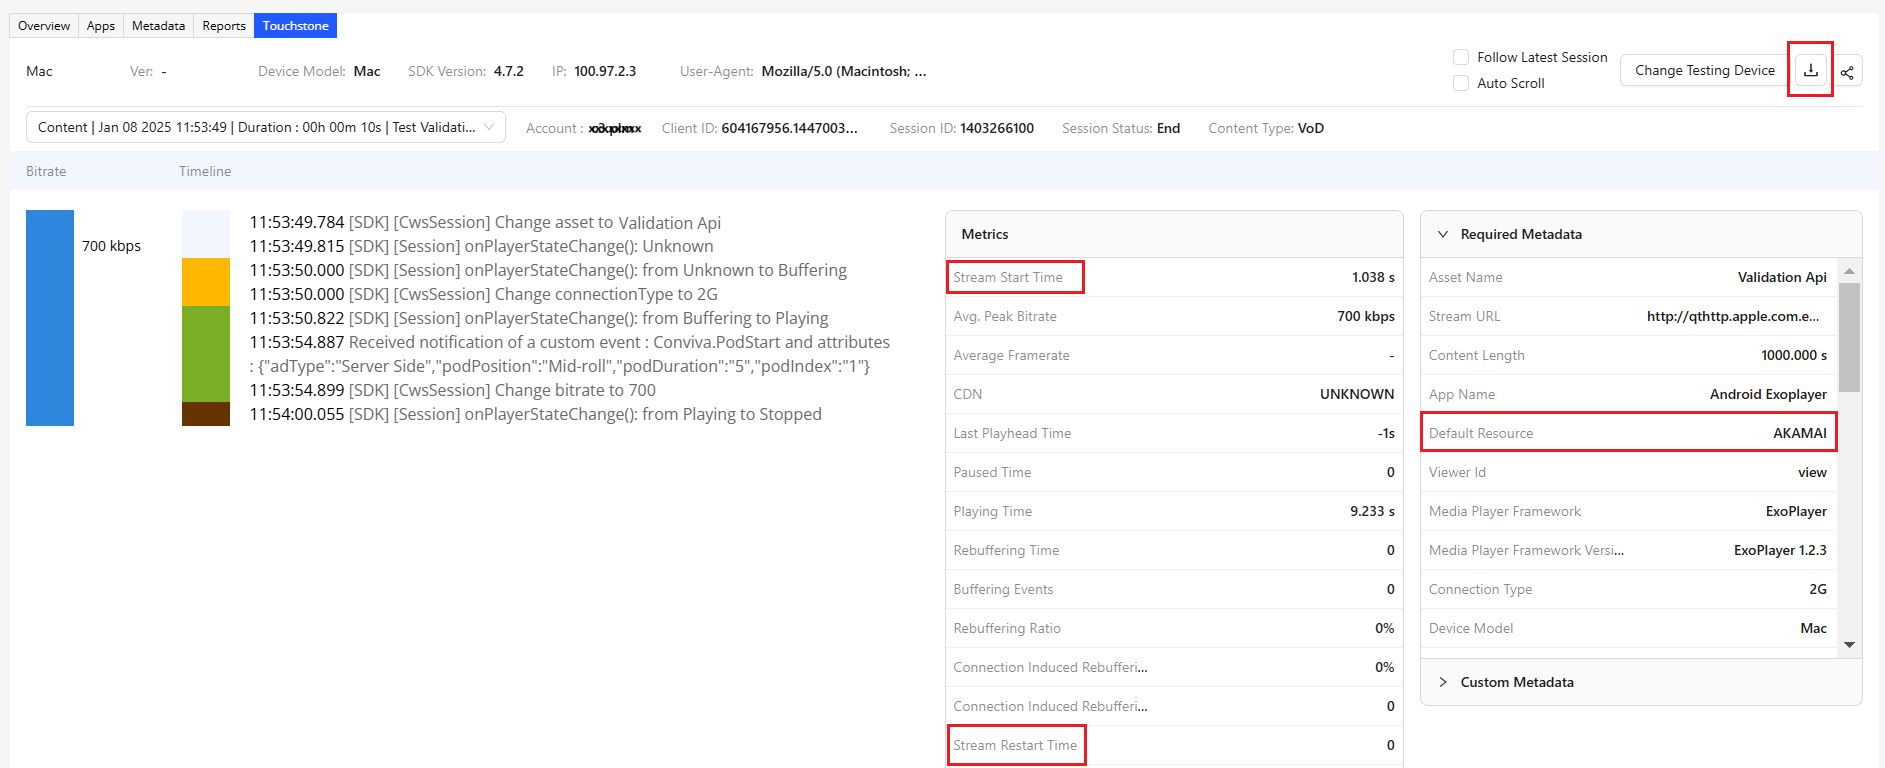
<h4 class="IncludeInTOC" style="font-weight: bold;" id="January0920251" data-magellan-target="January0920251">January 09, 2025</h4>
<ul>
<li>
<p>Enhances the metric names in the Session details page depending on the customer type. </p>
<p>For example, </p>
<ul>
<li>
<p>Video-only customers see the metrics labeled as "Video Start Time", "Video Restart Time", and "Video Restart Count". </p>
</li>
<li>
<p>Stream-only customers see the same metrics labeled as "Stream Start Time", "Stream Restart Time", "Stream Restart Count".</p>
</li>
</ul>
</li>
</ul>
<ul>
<li>
<p>Shows the <b>Default Resource</b> in the <i>Required Metadata</i> section. It is collected from the raw heartbeat.</p>
</li>
<li>
<p>Introduces a new icon to export session summary in the PDF format by clicking the Export to PDF icon at the top-right corner.</p>
</li>
</ul>
<p>
<img src="/resources/images/touchstone2_images/ts2_wn_20250109.png" style="width: 85%;height: auto;border-left-style: solid;border-left-width: 1px;border-left-color: #000000;border-right-style: solid;border-right-width: 1px;border-right-color: #000000;border-top-style: solid;border-top-width: 1px;border-top-color: #000000;border-bottom-style: solid;border-bottom-width: 1px;border-bottom-color: #000000;" alt="" />
</p>
<p>For more details about exporting session summary in the PDF format, see the <a href="/Tools/touchstone_v2/session_summary.html#ExportingSessionToPDF" target="_blank">Session Summary</a> topic in the Conviva Docs. </p>
<h4 class="IncludeInTOC" style="font-weight: bold;" id="October242024" data-magellan-target="October242024">October 24, 2024</h4>
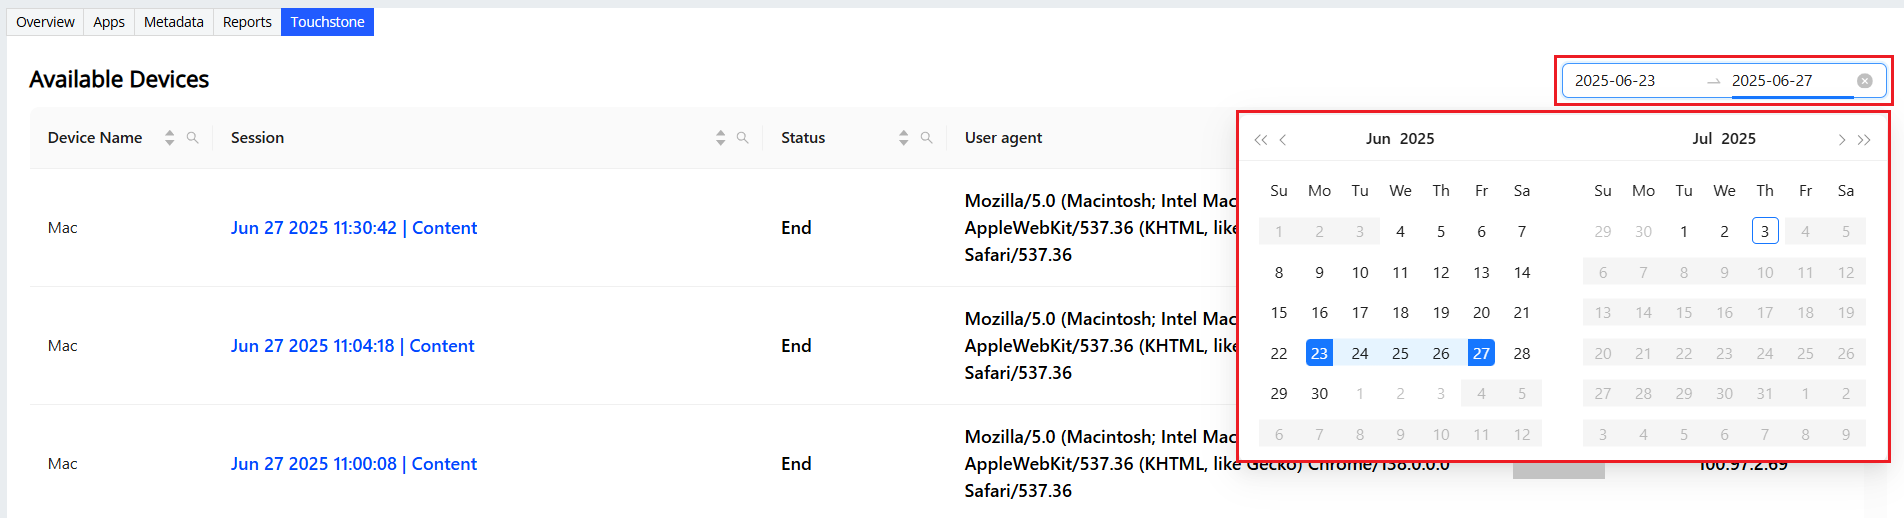
<p>Introduces date picker in the Available Devices page to filter the list of available devices based on a date range. </p>
<p>
<img src="/resources/images/touchstone2_images/ts2_wn_20241024.png" style="width: 85%;height: auto;border-left-style: solid;border-left-width: 1px;border-left-color: #000000;border-right-style: solid;border-right-width: 1px;border-right-color: #000000;border-top-style: solid;border-top-width: 1px;border-top-color: #000000;border-bottom-style: solid;border-bottom-width: 1px;border-bottom-color: #000000;" alt="" />
</p>
<p>For more details using the date picker to filter the available devices, see the <a href="/Tools/touchstone_v2/available_devices.html#Filtering_devices_by_dates">Available Devices</a> topic in the Conviva Docs. </p>
<h4 class="IncludeInTOC" style="font-weight: bold;" id="September2720241" data-magellan-target="September2720241">September 27, 2024</h4>
<p>We are excited to announce the launch of Touchstone, designed to streamline the self-validation process for video sensor integration. Now integrated with Pulse, Touchstone enables in-depth monitoring of session timeline data, accessible within the app and across Pulse’s Overview, Trends, and Viewers dashboards. This new version also resolves previous inconsistencies in metric values between Pulse and the standalone Touchstone 1.0, ensuring more accurate data tracking.</p>
<div class="doc-callout doc-callout--note"><div class="doc-callout__body">Please contact your account team (Project Manager/Integration Engineer) or Conviva Support (<a href="mailto:support@conviva.com" target="_blank">support@conviva.com</a>) to start using Touchstone 2.0 before Touchstone 1.0 is phased out.</div></div>
<p>For more details about Touchstone features and enhancements, see the <a href="/Tools/touchstone_v2/touchstone_2_help.html" target="_blank">Self Validation Using Touchstone 2.0</a> topic in the Conviva Docs.</p>
App Integration Releases
DPI Integration Tool
This section lists the release notes for the recent Conviva Digital Product Insights (DPI) Integration release.
September 27, 2024
Introduces the Share menu option for copying the dashboard link to clipboard and sharing the validation report with other users.
Introduces the Last Seen column in the Available User Timeline panel to view the occurrence time of the latest event associated to the corresponding application, device, user ID, and client ID.
The DPI Integration feature, which is available in Pulse, enables developers to experience a seamless self-validation and debugging process of sensor integration.
For more details about DPI Integration features, see the Integration Help topics in the Conviva Docs.
Touchstone Releases
This section lists the release notes for the Touchstone.
October 17, 2025
Enhances the Required Metadata and Custom Metadata sections to highlight any metadata with an alert icon if there is any datatype mismatch. Hover the mouse pointer on the icon to see the alert message, for example "Datatype mismatch. This field supports only "string" datatype".
For more details, see the Session Summary topic in the Conviva Docs.
August 13, 2025
Enhances the Required Metadata:
The Live or VOD metadata is renamed to Content Category (isLive)
The Content Category metadata is renamed to Category Type (c3.cm.categoryType)
The enhancements are applicable to all user interfaces and reports of Touchstone.
For more details, see the Session Summary topic in the Conviva Docs.
July 03, 2025
Enhances the Required Metadata section to display the keys for Content tags (as c3.cm.*) and Ad tags (as c3.ad.*).
Relocates App Version from the header section to the Required Metadata section.
Removes:
The Device Model and Content Type from the header, as these information are already available under the Required Metadata section.
The Change Testing Device icon from the header section and the BLUE-colored bar under the Bitrate field.
For more details, see the Session Summary topic in the Conviva Docs.
June 06, 2025
Deprecates the older version of Touchstone. Use the improved Touchstone 2.0 in Pulse for seamless debugging and self-validation of Conviva's VSI.
Enhances all Required Metadata (except Device Model, Browser Name, and other device-related metadata) and Custom Metadata to:
Show the metadata values as collected directly from the heartbeat.
Support mutability, that is, any changes in the metadata during an ongoing session.
For more details, see the Session Summary topic in the Conviva Docs.
March 25, 2025
Introduces a new Avg. Bitrate metric to show the latest average bitrate as collected from the heartbeat.
Enhances the Device Category metadata to show its value as collected from the heartbeat.
For more details, see the Session Summary topic in the Conviva Docs.
January 23, 2025
Displays Module Version in the header section, if available in the heartbeat.
Displays CDN changes in the session timeline.
Simplifies the statements for player state change and event change in the session timeline.
Introduces two new icons for exporting the session summary in the PDF and Excel formats.
For more details about exporting session summary in the PDF format, see the Session Summary topic in the Conviva Docs.
January 09, 2025
Enhances the metric names in the Session details page depending on the customer type.
For example,
Video-only customers see the metrics labeled as "Video Start Time", "Video Restart Time", and "Video Restart Count".
Stream-only customers see the same metrics labeled as "Stream Start Time", "Stream Restart Time", "Stream Restart Count".
Shows the Default Resource in the Required Metadata section. It is collected from the raw heartbeat.
Introduces a new icon to export session summary in the PDF format by clicking the Export to PDF icon at the top-right corner.
For more details about exporting session summary in the PDF format, see the Session Summary topic in the Conviva Docs.
October 24, 2024
Introduces date picker in the Available Devices page to filter the list of available devices based on a date range.
For more details using the date picker to filter the available devices, see the Available Devices topic in the Conviva Docs.
September 27, 2024
We are excited to announce the launch of Touchstone, designed to streamline the self-validation process for video sensor integration. Now integrated with Pulse, Touchstone enables in-depth monitoring of session timeline data, accessible within the app and across Pulse’s Overview, Trends, and Viewers dashboards. This new version also resolves previous inconsistencies in metric values between Pulse and the standalone Touchstone 1.0, ensuring more accurate data tracking.
Please contact your account team (Project Manager/Integration Engineer) or Conviva Support (support@conviva.com) to start using Touchstone 2.0 before Touchstone 1.0 is phased out.
Adds an Ask Nexa entry point to the session diagnostic and to every row in the Viewer Module session list. The session stays on the left and the chat panel opens on the right, so the evidence remains in view while you ask about it.
The panel opens already scoped to the viewer, the session, and the selected time range. Follow-up questions no longer require restating a viewer ID or re-entering a date range, which previously meant expanding a session panel and re-establishing context before asking anything.
Try It:
Open a session diagnostic and click Ask Nexa, or click the Nexa button on any session row in the session list. Ask a follow-up question without repeating the viewer ID or the time range.
Share a Viewer or Session Diagnostic With a Link
Feature Update (Beta):
Any viewer or session diagnostic can now be shared as a link. The recipient opens the same view, on the same customer account, so handing an investigation to a colleague is a paste rather than a screenshot or a set of instructions for rebuilding the view.
Try It:
Click the share icon in the viewer or diagnostic toolbar and send the generated link to a colleague.
Open Another Viewer in a New Tab
Feature Update (Beta):
A second viewer analysis can be opened in a new tab from the + button beside the viewer ID, leaving the current analysis intact. Comparing two viewers previously meant abandoning the analysis already open and rebuilding the second one in its place.
Try It:
Click + next to the viewer ID to open another viewer in a new tab. The original analysis stays open in its own tab.
CSV Export for Session Lists and Diagnostics
Feature Update (Beta):
The Viewer Module session list and the session diagnostic both export as CSV, so session data can be moved into a spreadsheet, a ticket, or a report without being retyped.
Try It:
Click the Export CSV icon on the session list or the diagnostic.
Ad Breaks on the Diagnostic Timeline
Feature Update (Beta):
Ads on the session diagnostic timeline are now grouped into breaks rather than listed as a flat set of creatives. Each break shows its position in the stream, how many ads were filled, the ad server and insertion method, the break's time range and duration, and a status — with failures called out against the break as a start failure or a playback failure.
Expanding a break lists its individual creatives with their own timings and outcomes. A failure can now be traced to the break it belongs to, where previously it identified only that a creative had broken.
Try It:
Open a session diagnostic and find the ad track on the timeline. Expand any break to see its creatives and where the failure sits.
Manage Schedules now shows a Last Run Status and Last Run Time against every schedule. Where a run failed, clicking the status opens the reason — the originating prompt, the run timestamp, and a plain-language explanation such as a monthly usage quota being exceeded, along with whether it will retry automatically. Diagnosing a missing report is now self-serve instead of a support thread.
Try It:
Open Manage Schedules and check the Last Run Status column. Click any Failed status to see the reason for that run.
Adds a diagnostic panel to the Nexa Viewer Module that displays a complete session timeline in a single view: asset changes, playback state (buffering, playing, paused), ad breaks with attribution and duration, CDN switches, connection type, and the full event log — all aligned on the same time axis. This combined Video + Ads diagnostic view is a Nexa-exclusive capability not available in Pulse, giving Ops and Support teams one place to investigate exactly what happened in a session without cross-referencing multiple dashboards.
Try It:
Expand any session in the Viewer Module and click Open diagnostic. The full session timeline opens, showing Asset, State, Ads, Ad Asset, CDN, Connection, Events, and Lifecycle tracks aligned on a single time axis. Use this to diagnose rebuffering spikes, failed ad breaks, mid-session CDN switches, and other playback events in one view.
Adds an Ask Nexa entry point directly in the Viewer Module and in the Viewers tab in Trends. Selecting "Ask Nexa" from a session row or a viewer row opens a dedicated Viewer canvas inside Nexa — without leaving the current workflow — showing an AI-generated impact summary, the viewer's session list, and a chat box for follow-up questions.
A Viewers module is also now embedded in Nexa's own top panel, so you can query viewer data directly from within Nexa at any time.
Try It:
When investigating a specific viewer complaint, select the viewer's row in the Viewer Module or Trends and click Ask Nexa. Nexa opens the Viewer canvas with an AI impact summary and the session list in context — no need to copy a viewer ID, switch tabs, and re-enter the query manually.
Token Usage Reporting — Account, C3 & User Level
Feature Update:
Nexa now provides token usage reporting at the account, C3, and user level. Overall consumption is visible via the Usage Dashboard. Detailed Nexa token usage — broken down by C3 and individual user — is available via the Nexa Usage Dashboard under Settings.
Try It:
Navigate to Settings → Nexa Usage Dashboard to view token consumption per user and per C3. Use the top-level Usage Dashboard to review aggregate token, request, session, and active-user counts across accounts and track usage trends over time.
Extends Nexa with industry benchmarking for streaming quality. Ask for a comparison in plain language and Nexa builds it against Conviva's cross-publisher OTT cohort — real production data from every publisher Conviva monitors — sliced by any dimension (country, device, ISP, OS, and more) and visualized in the format you need. Compare at P50, P75, P90, P95, or P99 percentiles. Benchmarking was previously available only in Pulse's fixed dashboard views; it is now available conversationally in Nexa.
Sample Prompts:
"Show our Streaming Performance Index (SPI) sub-KPIs for the US in June 2026 as a lollipop chart vs. the P95 benchmark — top 8 devices, VOD and Live shown separately."
"Build a radar chart of our SPI sub-KPIs for the US in June 2026 vs. P95 and Conviva Best — top 4 devices."
Conviva Best Quality Threshold
Feature Update:
Brings the Conviva Best threshold profile to Nexa. Conviva Best is the stricter, premium quality bar — previously available in Pulse but not available conversationally in Nexa. Ask for it by name and Nexa applies the stricter threshold profile to any analysis. Nexa always identifies which profile is in use, so there is no ambiguity about what a Streaming Performance Index (SPI) number means, and it defaults to the account-level KPI preference when that context is available.
Sample Prompt:
"Compare our SPI under Conviva Good vs Conviva Best thresholds for the last 7 days. Show both values side by side and tell me which sub-KPIs cause the biggest drop when switching to Best."
Pulse Drilldown Links from Conversations
Feature Update (Beta):
Introduces the /pulse command, which turns a Nexa conversation into a set of direct Pulse drilldown links — one for each distinct topic covered in the conversation, with any filters or thresholds already applied. Run /pulse after any Nexa conversation to jump directly into the underlying Pulse trend view for each topic without re-entering filters manually.
Use Case:
After a Nexa conversation covering video health, app health, and a specific Connection Induced Rebuffering Ratio (CIRR) spike, run /pulse. Nexa returns a ready-to-open link for each topic — for example, an iOS New York CIRR link opens directly into a Pulse trend view filtered to that device, market, and CIRR threshold.
Export Reports as PDF or HTML
Feature Update:
Every Nexa report and dashboard can now be exported as a PDF or HTML file, on demand or automatically on a recurring schedule. Exports are delivered as proper file attachments rather than inline images, making them suitable for saving, forwarding, and archiving.
Use Case:
On any dashboard, click the download icon and choose Download as PDF or Download as HTML. For recurring delivery, open Schedule Analysis, set Report Format to PDF or HTML, and add subscribers. Recipients receive a document attachment instead of an embedded image.
Larger Prompt Box
Feature Update:
The Nexa prompt box now accepts up to 10,000 characters. Power users running deep root-cause investigations or pasting structured prompts from other AI tools can submit complex, multi-part questions without truncation.
Reliable Long-Running Analyses
Feature Update:
Nexa now allows up to 15 minutes for complex analyses to complete. Previously, queries taking longer than five minutes appeared to fail even when Nexa was still processing, causing unnecessary resubmissions. Long-running investigations now finish properly instead of timing out.
May 15, 2026
Unified AI Analysis
Feature Update:
Updates Nexa as a unified AI analysis assistant within the Conviva Pulse platform, consolidating VSI Video and VSI App analytics into a single conversational experience.
By bringing VSI Video and VSI App analytics together, Nexa enables cross-domain investigation and correlation without requiring context switching between products or manual stitching of results. Key trends across quality of experience (QoE), audience, and engagement are automatically identified and surfaced, providing a comprehensive view of both video streaming and digital product performance in a single interface.
Use Case:
For the query - What is the SPI, and what is the number of active users for the last 30 days? - analysis calculates the SPI and total number of active users over the last 30 days to evaluate recent audience engagement trends. Generate the report and save the analysis for the team’s future reference. It supports ongoing monitoring of usage patterns, identification of growth or decline in user activity, and validation of the impact of recent releases or campaigns. The results enable data-driven decision-making for capacity planning, performance optimization, and continuous product evaluation.
Introduces the ability to save session conversations as analysis templates for reuse. This feature enables faster access to commonly used analyses and ensures workflow consistency.
The following template types are now available:
Recommended Analyses: System-curated templates provided by Conviva, which are accessible only to Nexa Admins.
Saved Analyses: User-saved templates available for individual reference.
Team Analyses: User-saved templates marked as Team, making them accessible to the entire Team for shared use.
This enhancement improves efficiency, supports collaboration, and standardizes analysis practices within Nexa.
Use Case:
For the query - What is the number of active users for the last 30 days? - analysis calculates the total number of active users over the last 30 days to evaluate recent audience engagement trends. Save the analysis for the team’s future reference. It supports ongoing monitoring of usage patterns, identification of growth or decline in user activity, and validation of the impact of recent releases or campaigns. The results enable data-driven decision-making for capacity planning, performance optimization, and continuous product evaluation.
Provides enhanced visibility into service impact by identifying individual sessions and end users most affected by performance issues. Teams can quickly pinpoint sessions impacted by App errors, poor QoE, anomalies, outages, or quality degradation, enabling faster, more targeted troubleshooting.
Use Case:
When a quality incident occurs—such as application startup time exceeding 3 seconds or average network request time surpassing 3 seconds—teams can instantly identify the sessions most adversely affected using Nexa’s Impacted Sessions insights. This capability enables teams to assess customer impact quickly, understand incident severity and scope, and prioritize investigations based on the most critical cases. By clearly highlighting users and sessions experiencing the app errors, failures, or degraded quality of experience (QoE), Nexa accelerates root-cause analysis, improves incident reporting accuracy, and supports timely, targeted communication with support teams for effective customer outreach.
Provides the option to Share the session details, allowing users (with the c3 access) to instantly view the full context—messages, insights, decisions, and outputs—without having to recreate the steps.
Use Case:
To retrieve and share insights on platform performance, the user queries, What are the top impacted sessions and viewers yesterday? This request returns a detailed view identifying the most affected sessions and viewers for the previous day, enabling timely analysis and corrective action. After reviewing the results, the user clicks the Share button, which generates a collaborative link. This link gives recipients direct access to the same insights, ensuring alignment and supporting efficient, data-driven collaboration across teams.
Top Impacted Sessions and Viewers for VSI Video Video
Feature Update:
Provides enhanced visibility into service impact by supporting Top Impacted Sessions and Top Impacted Viewers for VSI Video Video. This update allows teams to quickly identify which sessions and end users were most affected by a performance issue, an anomaly, an outage, or a quality-degradation event.
Top Impacted Sessions: Provides the individual playback sessions most negatively affected based on error severity, rebuffering, video start failures, poor QoE metrics, or detected anomalies.
Top Impacted Viewers: Highlights the viewers experiencing the most significant impact during the event window—enabling targeted customer support, proactive outreach, and rapid root-cause identification.
Use Case:
When a quality incident occurs—such as a CDN slowdown, ISP disruption, or application performance issue—teams can instantly identify which sessions and viewers were most adversely affected using Nexa's new Top Impacted Sessions and Viewers insights. These insights allow them to assess customer impact, understand the issue severity and scope, and prioritize investigations based on the most critical cases. By highlighting the specific users and sessions that experienced the highest rebuffering, failures, or degraded QoE, Nexa enables faster root-cause analysis, more accurate incident reporting, and timely communication with support teams for targeted customer outreach.
Know Improvement Opportunities for VSI Video Video
Feature Update:
Provides visibility into AI-driven Improvement Opportunities through the AI Roadmap. Users can access the AI Roadmap in Nexa to view prioritized recommendations and areas of focus to enhance performance and stability. By asking questions such as, How do I improve SPI?orImprovement opportunities for SPI, users receive targeted guidance on critical improvements. This feature helps teams identify optimization paths quickly and supports more informed, data-driven decision-making.
Use Case:
Users can understand how to enhance the Service Performance Index (SPI) for their application. The user enters the query How do I improve SPI? Nexa accesses the AI Roadmap and generates a set of prioritized SPI improvement opportunities. The system highlights key factors affecting SPI—such as latency, error rates, or buffering issues—and provides actionable recommendations tailored to the user's environment. These may include optimizing specific flows, addressing high-impact errors, improving delivery performance, or resolving recurrent issues. The user reviews these insights to determine where to focus efforts and develops a targeted plan to improve SPI metrics and overall service quality.
Support Queries for VSI Video Video Alerts
Feature Update:
Supports VSI Video alerts, enabling users to access viewer-specific alert information directly within the platform. Users can retrieve alert summaries and trends by asking questions such as Critical alerts for today or Alerts for the last 7 days, providing faster visibility into viewer-level issues and helping teams identify, prioritize, and address critical problems more efficiently.
Use Case
Enter the query Show the critical alerts in the last 24 hours. Nexa retrieves all critical viewer-specific alerts generated within that period, summarizing alert types, affected sessions, and timestamps. Use this information to identify emerging issues and drill into specific alerts for root-cause analysis, enabling faster response and resolution.
Try Nexa
Feature Update:
Introduces a new Try Nexa button within VSI Video and VSI App — Trends Dashboard to provide users with faster, more intuitive access to Conviva Nexa. With improved discoverability and smoother transitions between monitoring and diagnostics, the update delivers a more connected and intuitive user experience.
Supports VSI App AI Alerts within Nexa, giving users immediate visibility into critical issues without leaving the platform. This enhancement helps teams detect, investigate, and act on anomalies faster than ever. Users can request alerts using natural language—such as “Show me critical alerts for the last week” or “Show me open alerts for yesterday”—and receive results instantly. The AI Alert dashboard opens in a new browser tab to support focused analysis, and users can further examine any alert by referencing its Alert ID. This update improves the speed and clarity with which issues are identified and investigated.
Use Case
Enter the query “Show alerts due to network issues in the last 2 days.” Nexa interprets the request, applies the specified time range, and filters alerts based on network-related categories identified by VSI App AI. The system then returns a focused list of relevant alerts, highlighting their severity, status, and associated metrics. Open an alert dashboard in a new tab for deeper investigation or select an individual Alert ID to review detailed insights and anomalies.
Support queries for Auto Insights for Broken Assets and App Versions
Feature Update:
Supports queries for Auto Insights on Broken Assets and App Versions, enabling faster issue identification and analysis directly within the platform.
Users can request insights by asking questions such as,
Show me broken assets for today
Show me broken assets due to CIRR, or
Compare the app versions
Nexa interprets these queries, retrieves the relevant insights, and presents a clear summary of asset health and version performance. Users can also deep dive into any specific broken asset or app version to view detailed insights and contributing factors.
Use Case
To quickly assess whether any assets are malfunctioning and potentially affecting customer experience or service performance, enter the query What are the broken assets for today? Nexa processes the request and automatically filters Auto Insights to retrieve all assets that have triggered failure conditions within the current day. Nexa returns a curated list of broken assets along with key details such as failure type, impacted regions or devices, and severity indicators. The user can then select any individual asset from the list to open a deeper view, enabling examination of root causes, historical patterns, and related performance metrics.
To assess how the latest app version performs compared to an older one, enter the query Show me the insights for the latest and old app versions. Nexa retrieves insights for both versions and presents a clear comparison of key metrics, including crashes, errors, and performance issues. The user can then drill into either version for detailed insights into impacted assets and contributing factors. These insights help determine whether the latest version shows improvements or introduces new problems.
Thinking View Enhancement
Feature Update:
Introduces a new visible thinking state in Nexa to clearly indicate when the system is analyzing a user’s prompt. This enhancement improves interaction clarity by signaling that Nexa is actively processing the request, helping reduce perceived wait time and creating a smoother, more transparent user experience. Users can also turn off the thinking model based on their preferences, and this setting is persisted at the user level to ensure a consistent experience across sessions.
November 7, 2025
Support queries for Viewer Ids in VSI Video.
Feature Update:
Supports Viewer ID–based analysis in VSI Video, providing a significant AI-driven enhancement for support teams. Users can query viewer-specific insights to accelerate troubleshooting and understand individual viewing experiences with greater precision.
For example, queries such as,
Show the experience issues for viewer ID <Id number>
What were the last five sessions for viewer ID <Id number>
Show sessions with maximum issues on 5th Nov 2025 for viewer ID <Id number>; return targeted session and experience data.
Users can also drill down to a specific session ID to view exact timelines and pinpoint issues, such as rebuffering. This capability enables faster, more accurate support investigations and improves overall operational efficiency.
Use Case:
To investigate a viewer's complaint about poor streaming quality, enter the query: Show the experience issues for viewer ID <ID number>. Nexa performs viewer ID–based analysis in VSI Video and returns a consolidated view of all experience issues for that viewer, such as rebuffering events, playback failures, bitrate drops, and start-up delays. The response highlights when the issues occurred, their severity, affected devices or regions, and any recurring patterns. Use this information to identify root causes—such as CDN problems, network instability, or player errors—and take targeted corrective actions, improving both the individual viewer's experience and the overall service quality.
Supports user-timeline queries for VSI App, enabling instant analysis of experience and performance at the user or client level. When a user requests timeline insights, Nexa provides a link to the user timeline dashboard, which opens in a new browser tab, ensuring a clearer, more focused view.
For example, queries such as,
Show the experience issues for user ID <ID number>.
What were the last five sessions for client ID <ID number>?
For the user ID <ID number> summarize issues for the last 7 days.
Show sessions with maximum issues on 20th October 2025 for user ID <ID number>.
This update improves diagnostic efficiency enabling the users to troubleshoot faster by viewing user-specific journeys and error summaries without switching dashboards or relying on data teams. This capability streamlines issue resolution and strengthens understanding of user impact by combining performance and experience data in a unified workflow.
Use Case:
To investigate the recent activity for a client reporting intermittent issues, enter the query What were the last five sessions for client ID <Id Number>? Nexa processes the request through VSI App's user timeline integration and retrieves the most recent five sessions associated with that client ID. The response includes key details such as session start and end times, duration, device or platform used, and any associated experience issues. The engineer reviews this information to identify patterns—such as repeated errors, abnormal session durations, or network inconsistencies—and uses the insights to determine whether a specific problem is recurring.
Support Queries for Flow Auto Insights in Nexa
Feature Update:
Supports Flow analysis for Auto Insights, providing deeper guidance for customers with Auto Insights–enabled flows. Users can analyze any supported flow, and Nexa presents additional insights and actionable recommendations to help identify issues and optimization opportunities. This enhancement applies to customer accounts and flows where Auto Insights is enabled. Users can request information with queries such as Show details about the flow <flow name> for last week. This update improves diagnostic accuracy and supports more informed decision-making for flow performance.
Use Case:
To review the performance of a key operational flow over the past week, enter the query Show details about the flow Checkout for last week. Nexa analyzes the specified flow and returns the standard flow metrics along with newly added Auto Insights and recommendations. These insights highlight anomalies such as increased failure rates, latency spikes, or drop-off points for further investigation. The user reviews these details to identify root causes, prioritize improvements, and implement targeted fixes. This streamlined analysis helps improve flow performance and enhances the overall user experience.
What is Nexa?
Feature Update:
Nexa is Conviva’s AI-powered analytics assistant designed to help users interact with their Conviva data using natural language. Instead of navigating complex dashboards or writing queries, users can ask questions in plain English, and Nexa will interpret the request, run the appropriate Conviva API calls, and return actionable insights, summaries, or dashboards.
Nexa helps users to
Retrieve insights faster without complex filtering or UI navigation
Accelerate troubleshooting for video, app, network, or user-session issues
Generate dashboards on demand
Reduce time-to-insight for Product, Ops, Engineering, and Support teams
Make data analysis more accessible and intuitive for all users
Note: Conviva provides 50 million free tokens each month. The counter refreshes at the start of every month (UTC zone), and unused tokens do not carry over. Once the free tokens are utilized, contact Conviva Support for additional access.By Default, all users have use permission in Nexa.
Admins can change the permissions to,
No: Disables Nexa for the user in the account, including admins. No Nexa features will be accessible.
Use: Allows users to access and interact with Nexa features once enabled by the account admin. (Default setting)
Enable - (Admin-only permission): Allows the admin to activate Nexa for the entire account after accepting Conviva’s AI Acceptable Use Policy.
Retrieves historical and real-time metrics for building custom dashboards or applications.
Ads Summary
Retrieves viewer experience by combining statuses, metrics, and dimensional metadata.
DPI Summary
Manages saved filter settings via API, allowing retrieval, modification, creation, and deletion of filters.
2025 Releases
October , 2025
Sessions V3 API:
Allows ?Limit={N} in the query parameter to control the number of sessions in the response.
Displays IPandIPv6 information in the network_info section of the API response.
More Details: Sessions V3 API
Conviva Sensor Modules
App Sensor Module Releases
This section lists the release notes for the recent Conviva DPI sensor module releases.
September 2026
Conviva C SDK version 2.189.0.0 (09/SEP/2026)
Introduces cat_suspend_tracker() and cat_restore_tracker() to stop remote-config fetch while the app is backgrounded. cat_pause_tracker() is unchanged. After suspend, call cat_restore_tracker().
Includes the 2.185.0.2 remote-config persist and JSON fixes.
Rejects incomplete remote configuration instead of applying it.
Hardens application error, ANR, and persist paths against crashes.
Added Ad Session Heartbeat optimization (ad_shb) support — optimizes ad session heartbeat delivery on high-traffic live events when enabled by Conviva for an account; requires WSG protocol 2.8; no API changes.
Fixed missing monitored fields (e.g. bitrate) when using monitorVideoNode() without associateVideoNode().
Fixed exceptions when DPI is disabled (enableEco = false).
Improved monitoring performance by reducing repeated video node field reads.
Enhances conviva_click event with elementParent to include the hosting Fragment or Activity name, enabling identification of the screen associated with the clicked element.
Fixes event batching on Android 9 and its earlier versions by replacing the SQLite window function used for cumulative event size calculation with a Java-side equivalent.
Replace usage of appendString, which is deprecated in Roku OS 15.1.
Optimized node observing to include only necessary fields on the video node.
When settings.disableErrorReporting = true is passed to ConvivaClient(settings), no errors will be automatically reported by the Conviva sensor for neither content nor ad session. When disableErrorReporting is set to true, errors should be reported via conviva.reportContentError() and conviva.reportAdError().
Fix for peak bitrate not being auto-collected when the video node was attached late.
Separated out Cohort replay as a different package available in the NPM repository Conviva JavaScript replay. To integrate the feature please refer the instructions in the README file.
Contact Conviva support team to enable this feature.
Improves the Crash and ANR reporting with MetricKit for users on iOS 14 and above to enable deeper insights and faster fixes for a more stable app experience.
Cohort Replay enables the visual reconstruction and review of user navigations and actions within a customer's app. This feature captures how users interact with the app, including clicks, navigation, scrolling, media engagement, and text input, and then replays these interactions in a video-like experience.
By default, Cohort Replay is disabled. To enable it, please contact the Conviva Support team.
Introduces Intelligent Collection of SSE & WebSocket events designed to optimize data collection while ensuring flexibility and actionable insights with reduced volume:
Controls volume through Activation rules (Collect or Block).
Controls collection of attributes in SSE / WebSocket message payloads
Supports filtering based on request URL's hostname, path, scheme, and filtering based on attributes in SSE / WebSocket messages.
Supports cookie support for sharing clId within subdomains based on config enableClIdInCookies passed in tracker init.
Fixes issue in application's readyState checks that depended XMLHttpRequest.UNSENT, XMLHttpRequest.OPENED, XMLHttpRequest.HEADERS_RECEIVED, XMLHttpRequest.LOADING, XMLHttpRequest.DONE. The fix now intelligently intercepts XHRs without any modifications to original behaviour.
Fixes issue window undefined when initialising our tracker inside server side app.
Enhanced Network Request Collection: Supports automatic collection of network requests in Flutter for Dart’s core HTTP client, as well as popular libraries like Dio, Retrofit, and Chopper.
Controlled Ingestion Feature: Now disabled by default. Upgrading to this version will not alter collection behavior unless explicitly enabled. To activate this feature, please contact the Conviva support team.
Bug Fix: Target URL Query Parameters: Resolves an issue where the TargetURL in network requests was not reported along with query parameters.
Bug Fix: Case Insensitivity: Fixes an issue where network request collection was failing when the TargetURL had case-insensitive variations.
SDK, by default, controls event collection until the remote config is downloaded. Once available, the remote config takes over the event collection control.
Internal improvements.
February 2025
Conviva Android version 1.2.0
Provides flexibility with control of the click event collection, based on any element tag names, element types, element IDs, etc. To enable the controlled collection of click events (Android), contact Conviva Support.
Enhances the EditText elements to restrict text collection for protecting the sensitive data.
Limits the elementText tag key to support at most 1024 characters.
Fixes an issue where EBVS was over-reported due to mishandling of the time between video monitoring and App event reporting, causing inconsistencies in tracking the first video session.
Enhances the auto-collection of click events for a broader range of elements, not limiting to buttons and links. This update ensures more comprehensive click tracking with support for all standard HTML elements (link, button, checkbox, radio button, etc.) and elements of other frameworks, such as REACT, Angular, and Vue.
Provides flexibility with control of the click event collection, based on any element tag names, element types, element IDs, etc.
Contact Conviva Support to enable nonstandard/unsupported frameworks or control the collection of click events (JavaScript).
While migrating from Conviva JavaScript AppAnalytics version 1.1.1 (or older) to the latest version 1.1.2, update the event/metric mappings in Pulse by replacing the old tag keys for the click events with the new tag keys:
Old Tag Keys
New Tag Keys
elementText
text
elementValue
value
elementId
id
elementClasses
class
For more information on event/metric mapping using the Semantic Mapper in Pulse, see Semantic Mapper.
Conviva C SDK version 2.184.0.4
Fixes the issue with custom events having escape characters.
Introduces intelligent collection of network requests that optimizes the collection of network request volume while ensuring flexibility and actionable insights using:
Activation rules (Collect or Block), which override previous URL-based blocklists.
URL-based filtering using hostname, path, scheme, and filtering based on duration and response status code.
Contact Conviva Support to enable network request optimizations (iOS).
Conviva Network Request Optimization and ClientId APIs
Introduces optimization of data collection with more intelligent collection of network requests while ensuring flexibility and actionable insights by controlling the network request volume using:
Activation rules (Collect or Block), which override previous URL-based blocklists.
URL-based filtering using hostname, path, scheme, and filtering based on duration and response status code.
Contact Conviva Support to enable network request optimizations. (Android and JavaScript)
Introduces two new APIs, getClientId and setClientId, to share Conviva's clientId across different sensor instances. (JavaScript)
Enables tracking of screen views in SwiftUI by using the `View` extension function .convivaAnalyticsScreenView(name: "Screen Name"). It sends a custom event, conviva_custom_screenview(cv_csv), that needs to be mapped per customer account.
Enables tracking of button clicks in SwiftUI by using the `Button` extension function .convivaAnalyticsButtonClick(title: "Button Title").
Enables tracking of Picker (Segment Control) interactions in SwiftUI.
Supports the auto detection of the compose navigation with event name conviva_compose_view which needs to be mapped per customer account until Conviva Activation supports to map automatically and compose click tracking with event name conviva_button_click.
Supports the fragments navigation with event name conviva_fragment_view which needs to be mapped per customer account until Conviva Activation supports to map automatically.
Supports the traceparent header generation and collection.
Requires unified Conviva Gradle Plugin version >= 0.3.5 to support auto detection of compose navigation, click and fragments navigation. Please refer to compatibility table.
Introduces a new constant ConvivaSdkConstants.PLAYBACK.AUTO_REPORT_ERRORS to turn off the default error reporting behavior of the ExoPlayer and Media3 modules. Pass this constant in the player info through the ConvivaVideoAnalytics.setPlayer API.
Applicable to ExoPlayer modules 4.1.6 and above, and Media3 modules 4.0.1 and above.
Support for Reporting Audio, Subtitle, or Closed Caption Languages
All major Conviva platforms such as Android, iOS, JS, Roku, Web Brightcove, XBox, and C SDK now support reporting the audio, subtitle, or closed captions language values. These language event details enable customers to analyze scenarios like the impact of subtitle change on VPF and VRT.
Most of the Conviva modules auto-collect the language details during session start, and upon a change event. In case of custom integrations, use the new APIs to report the language details. To know more about the new APIs, refer to the video players integration section of the platform integration pages on the Conviva Docs:
Conviva Integration Assistant Plugin for Android Players
This release introduces the Conviva Integration Assistant Plugin for Android, which helps you integrate Android players with only a few clicks. You can download this plugin from the Android Integration Assistant plugin page and follow the instructions to install and use it.
To simplify integration, the plugin automatically adds the SDK dependencies to your Android project.
It generates the ConvivaHelper.java file with all the code that is required to invoke the integration.
It also lists the Advanced Use Cases for Android integration.



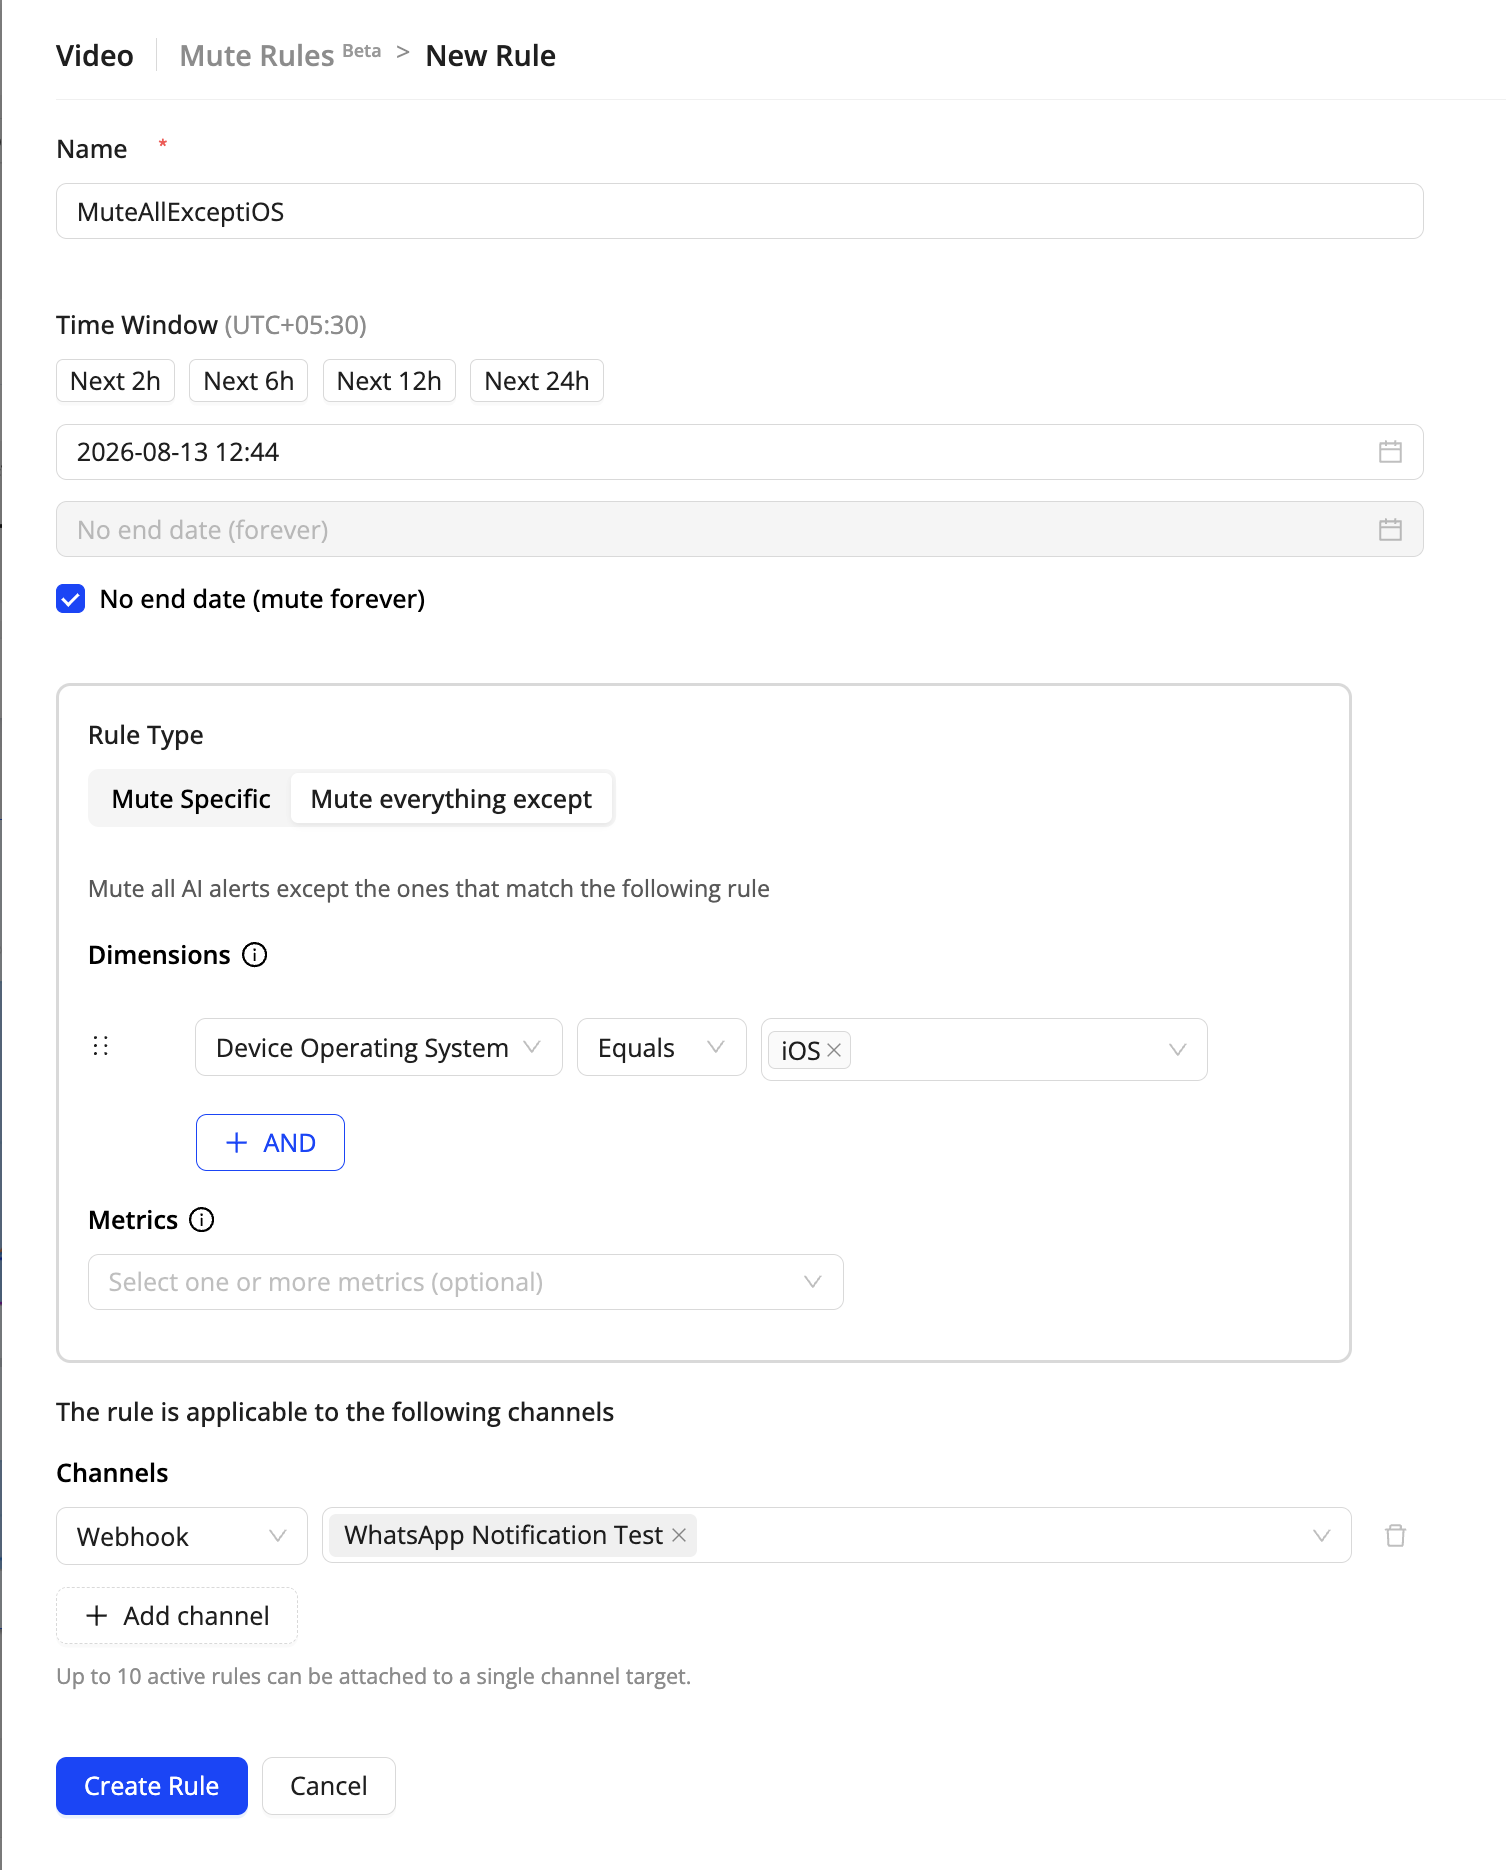
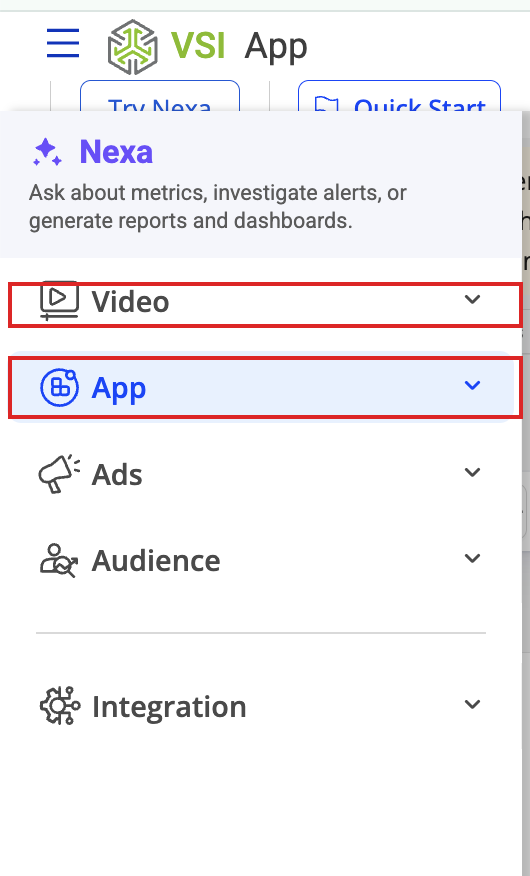
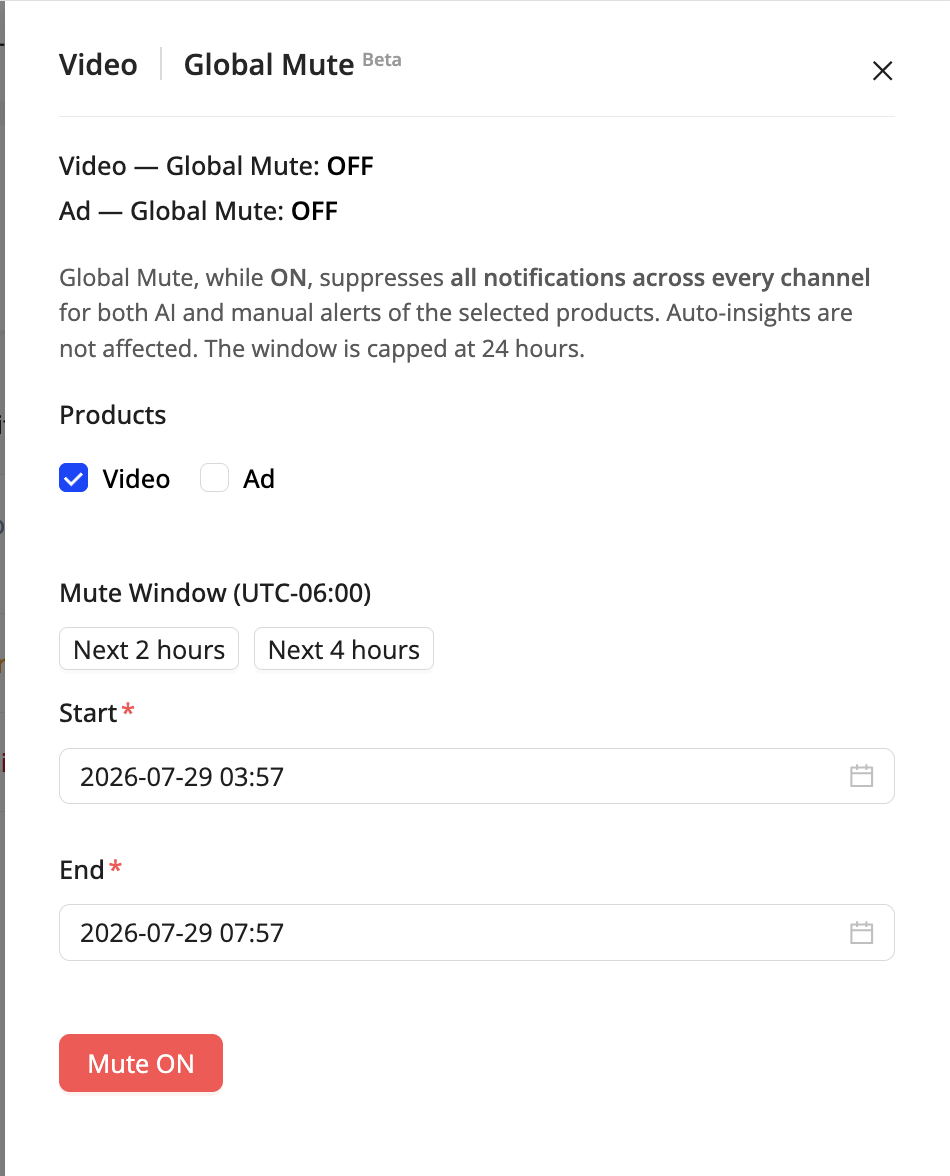
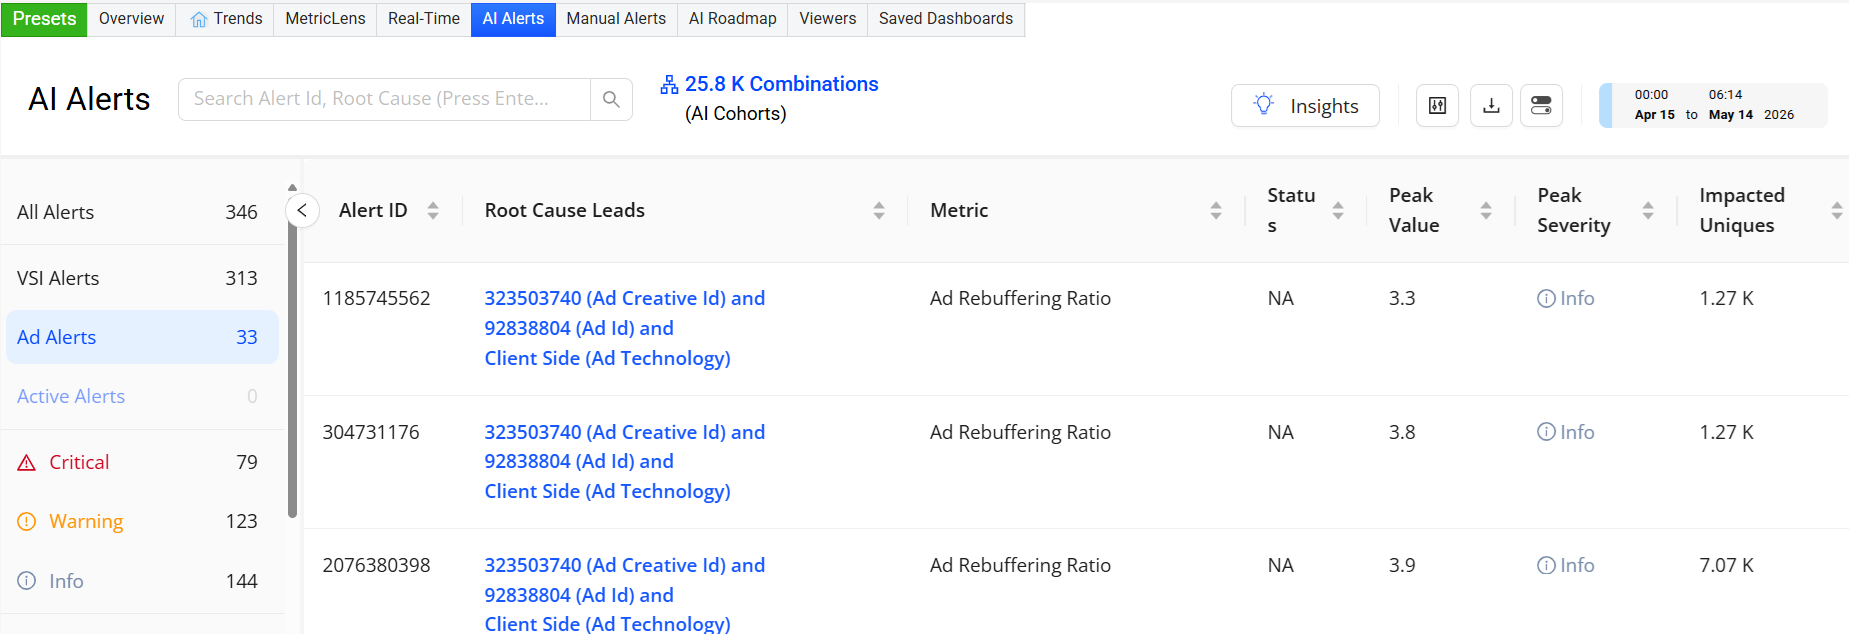
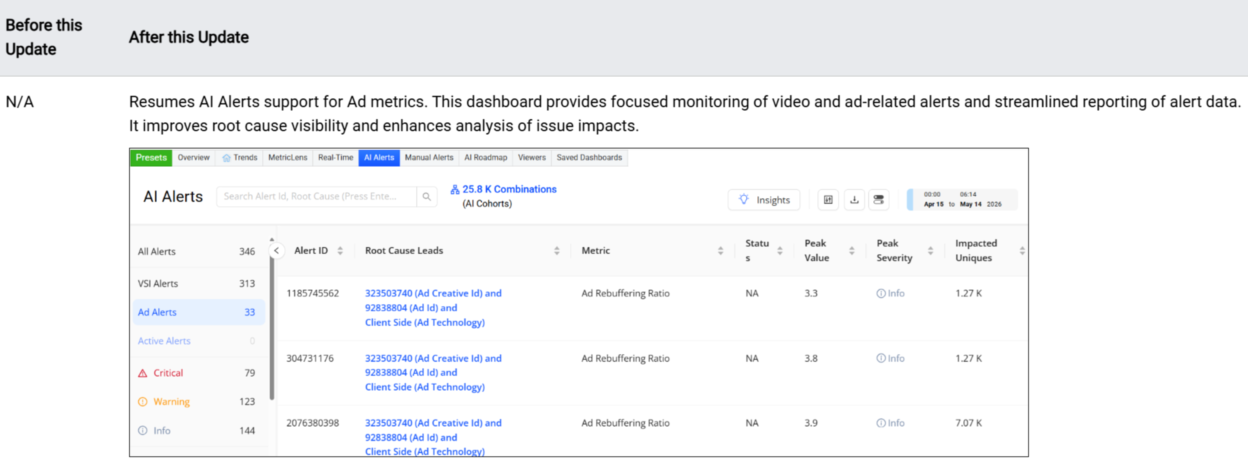
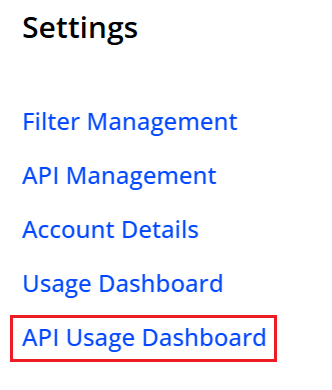
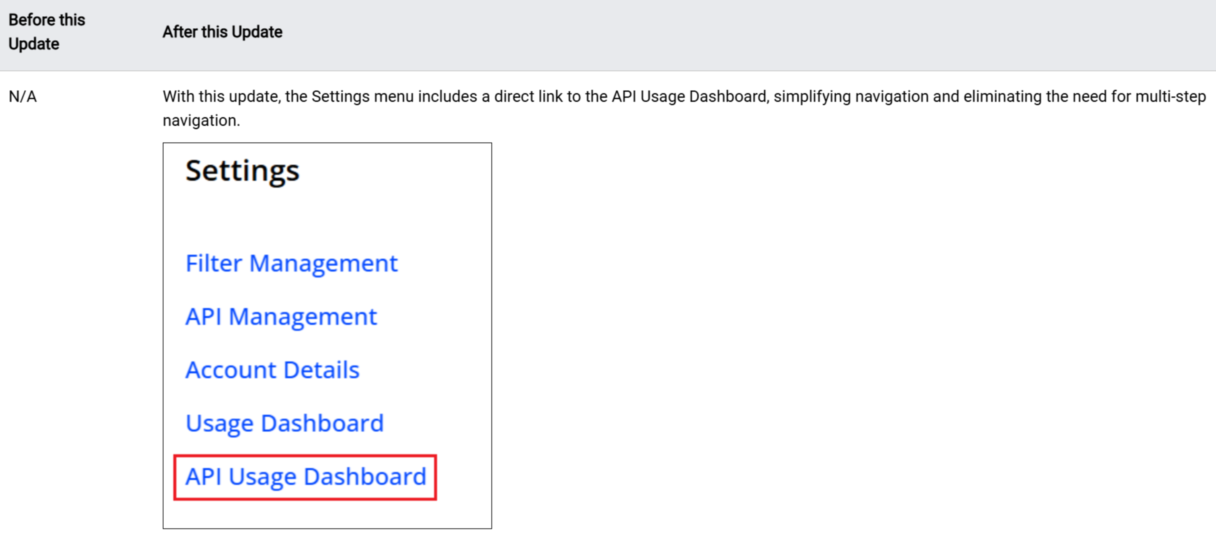
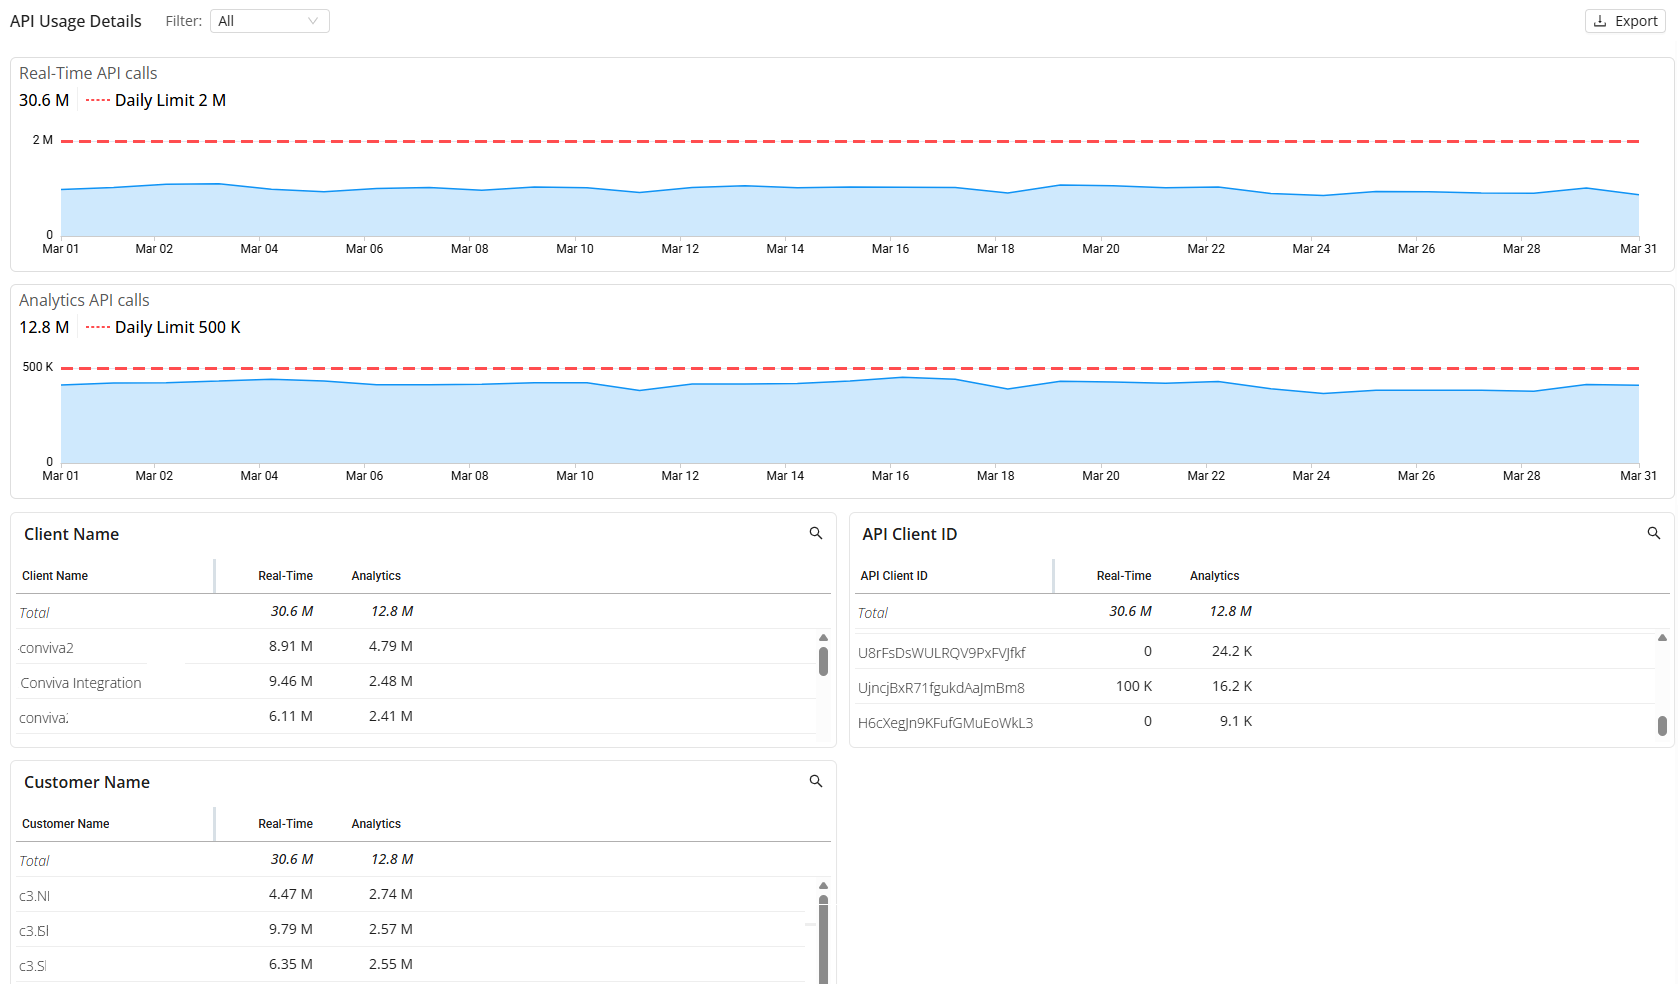
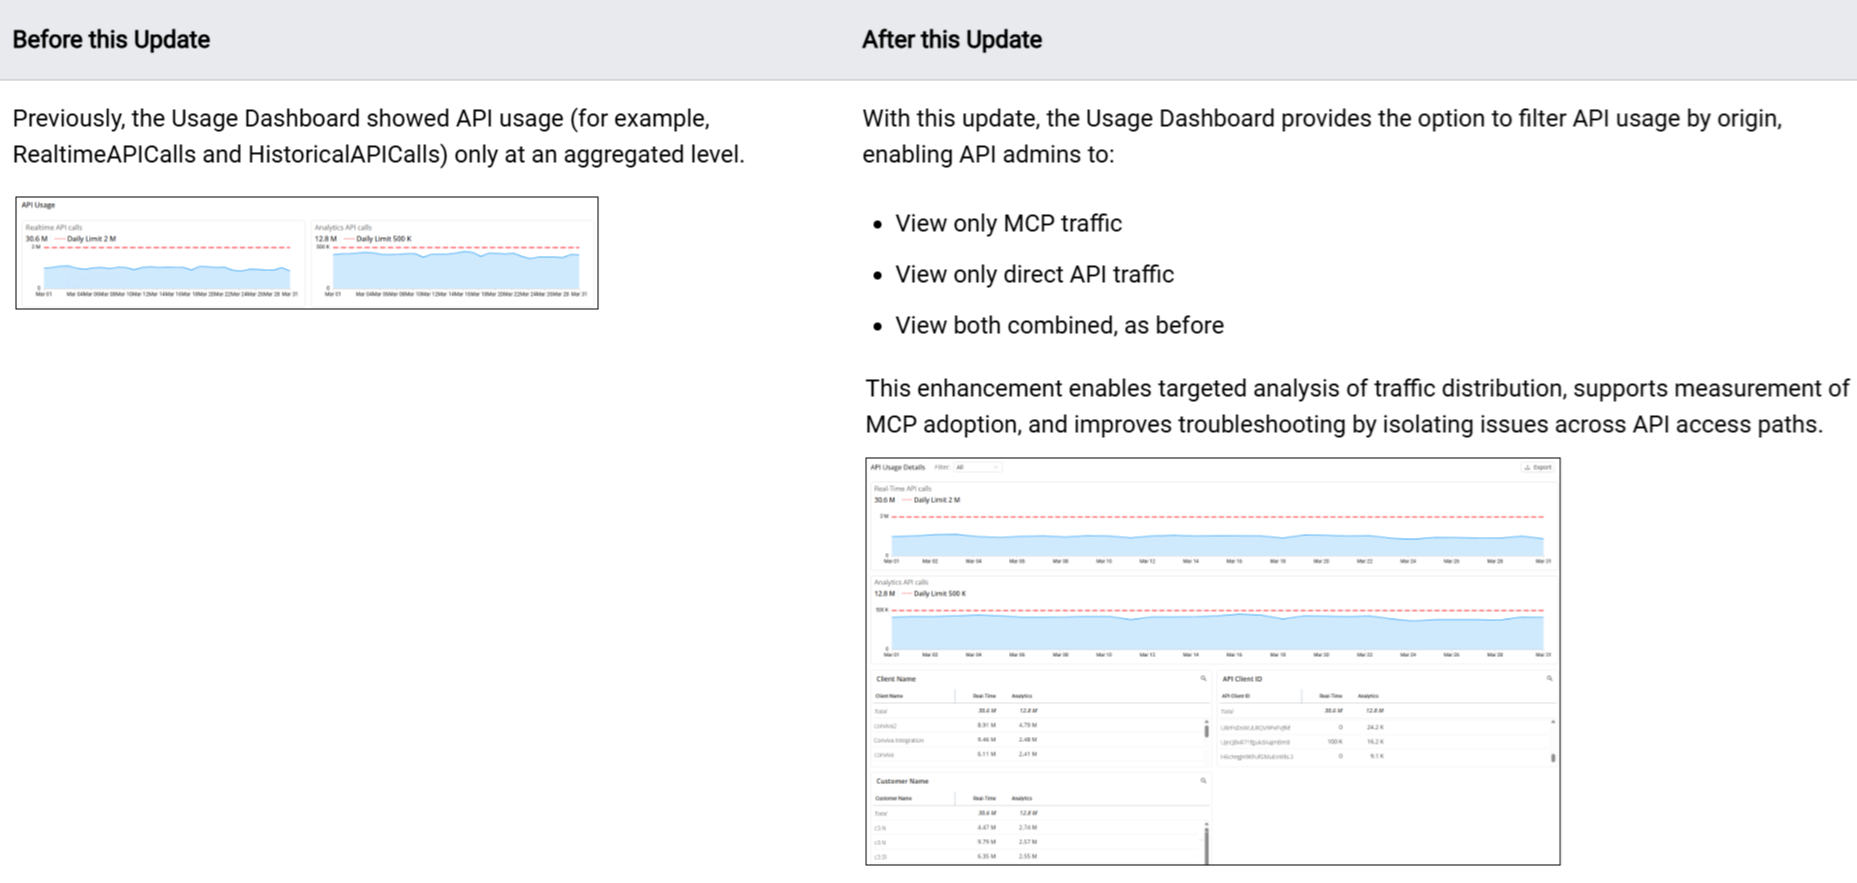

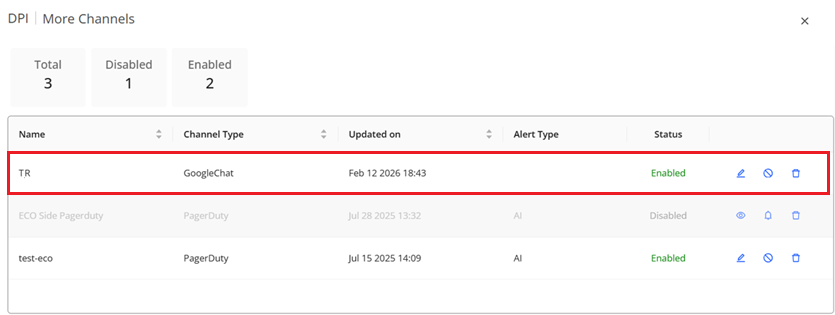
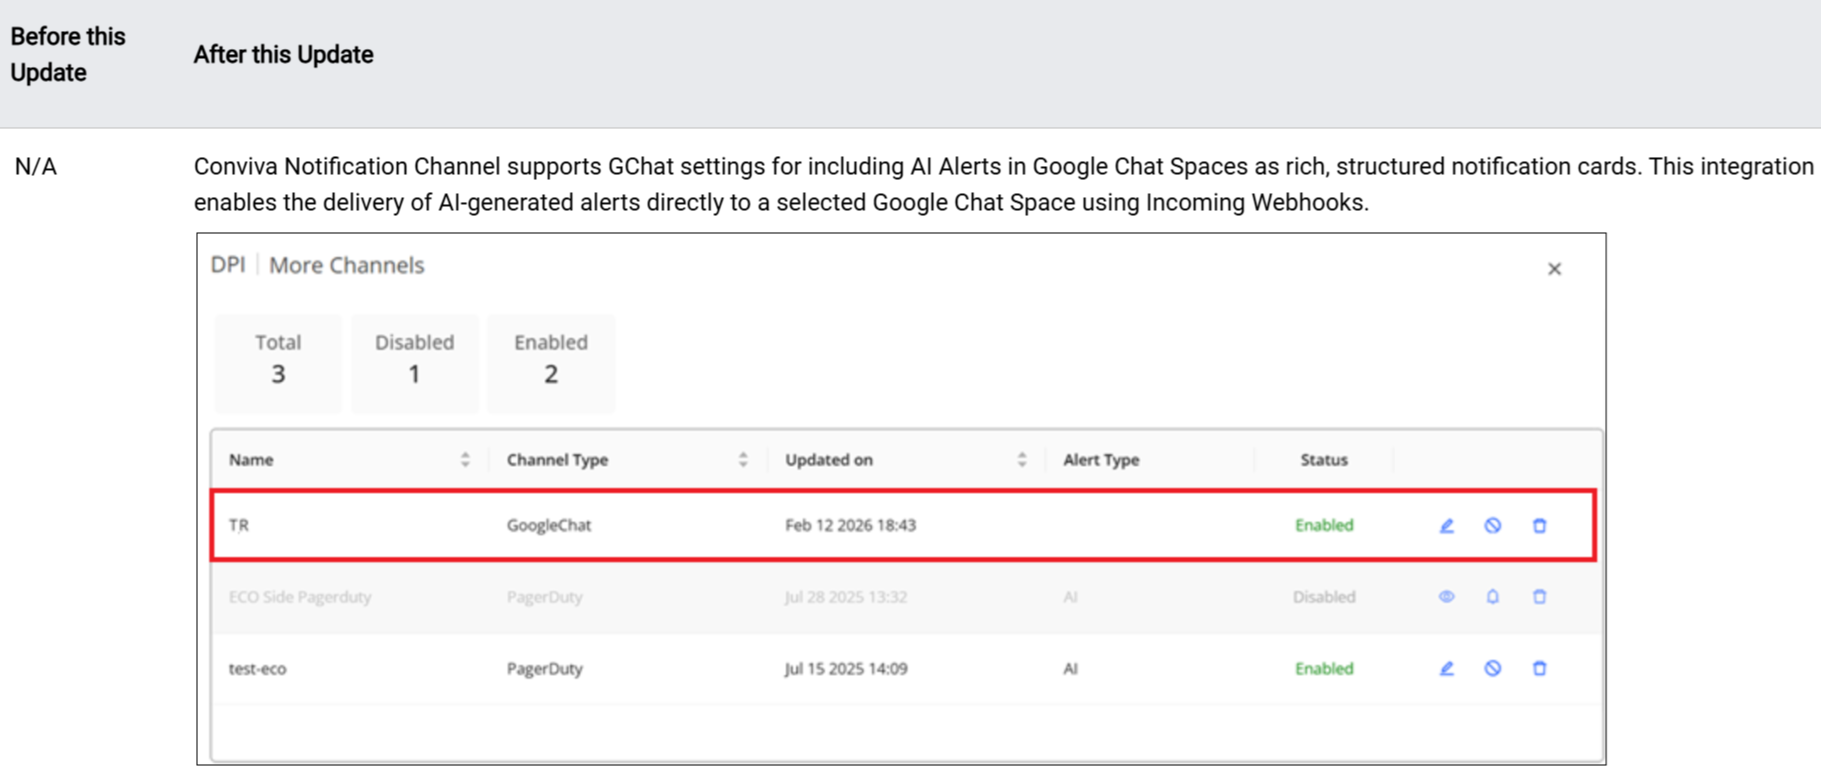

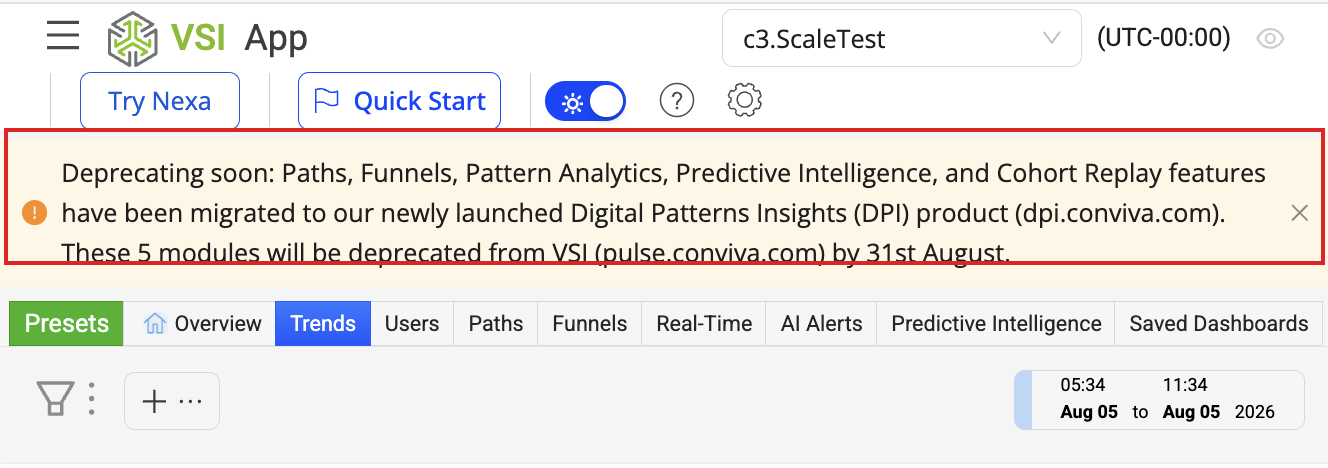
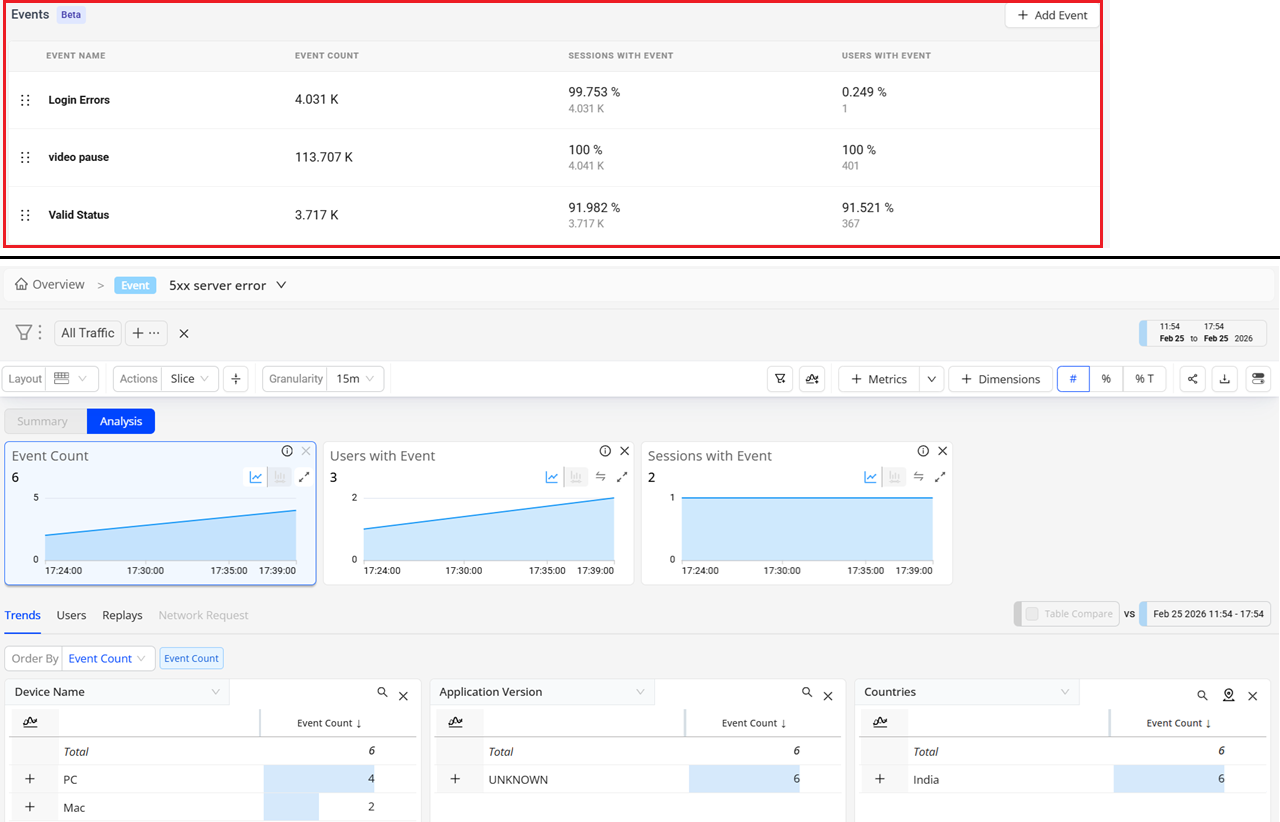
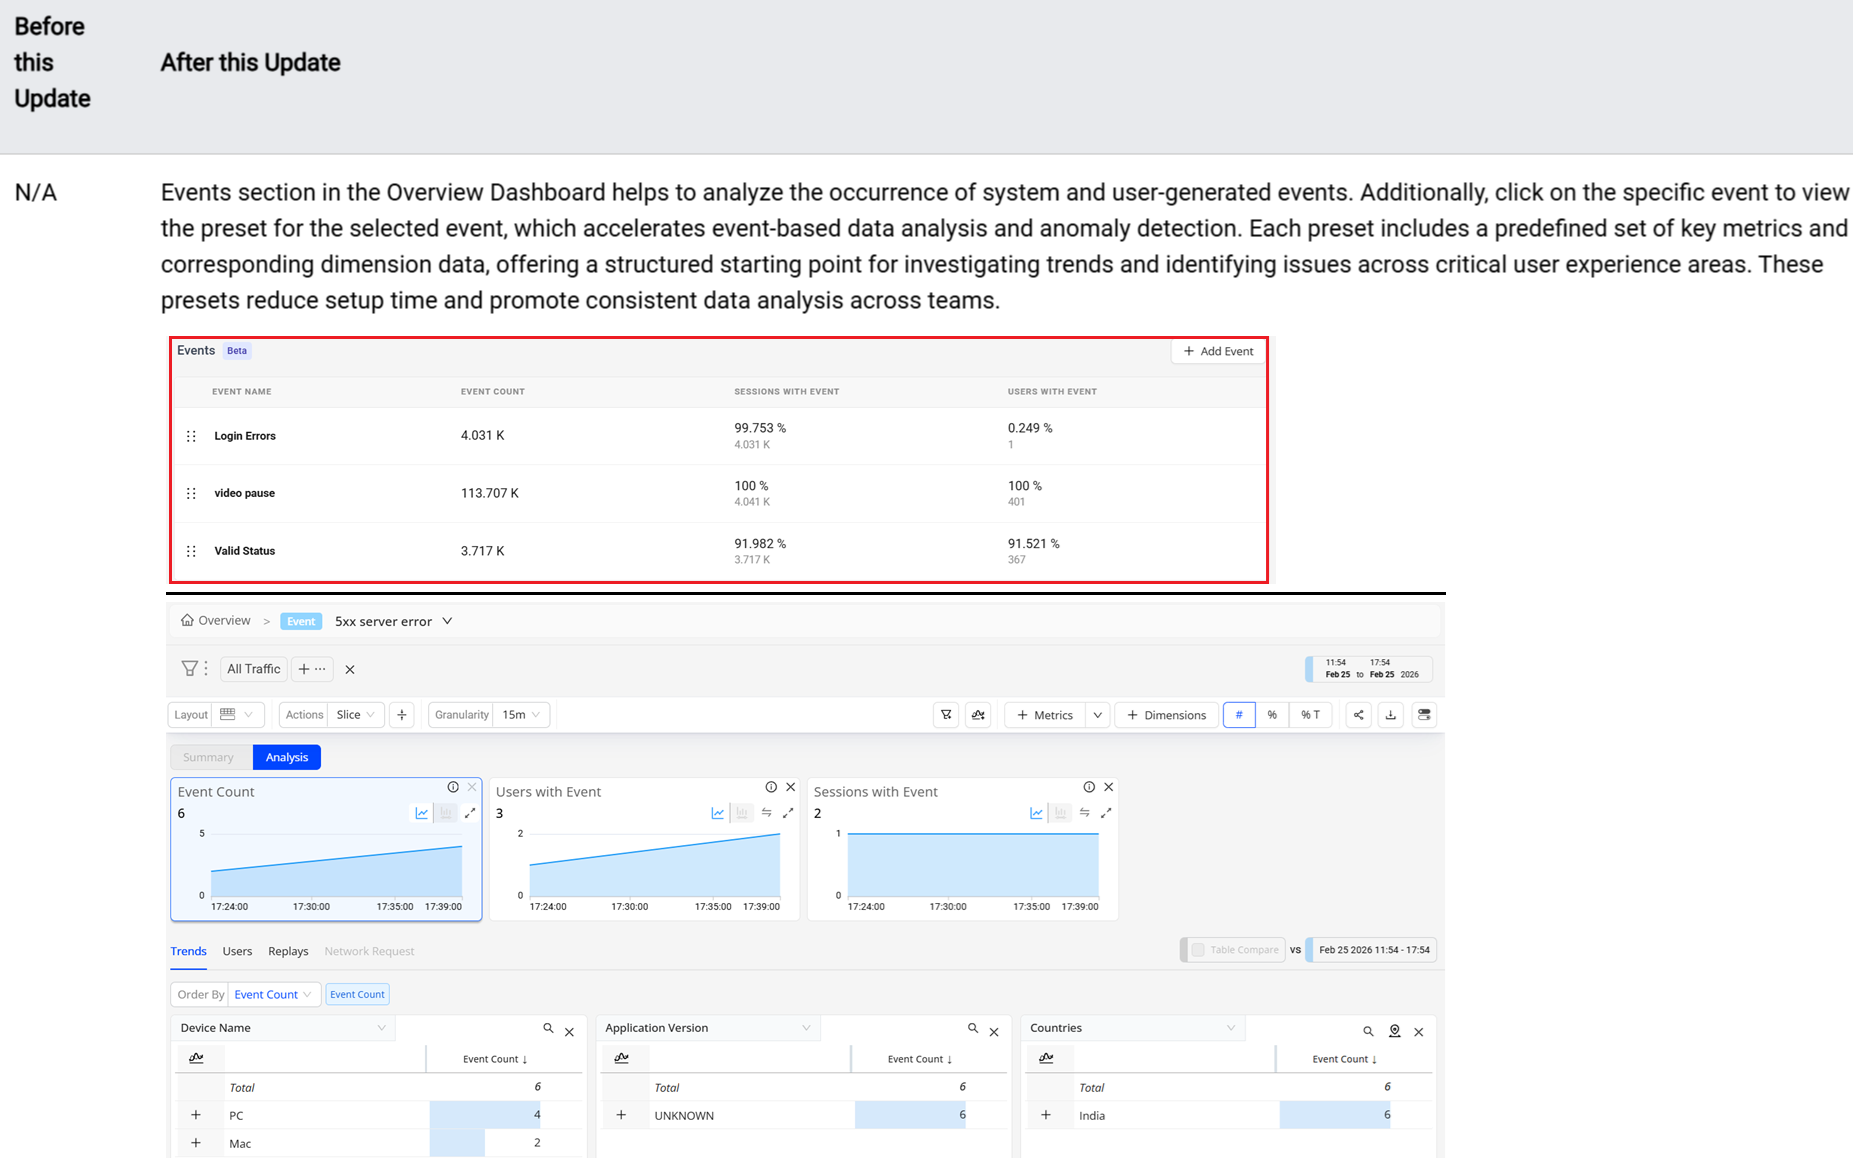
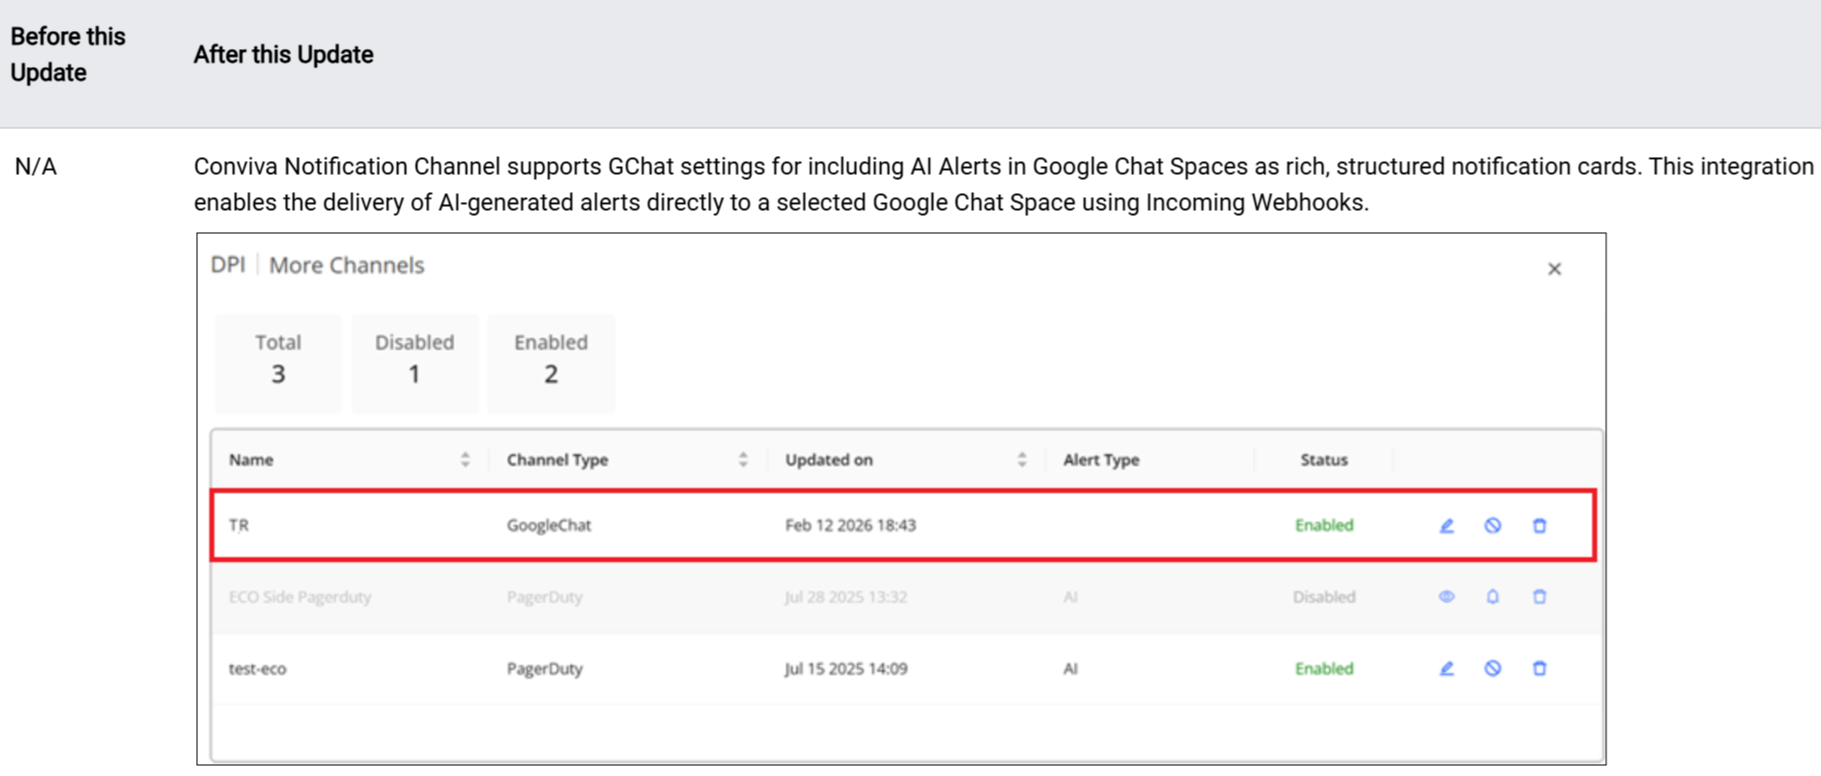
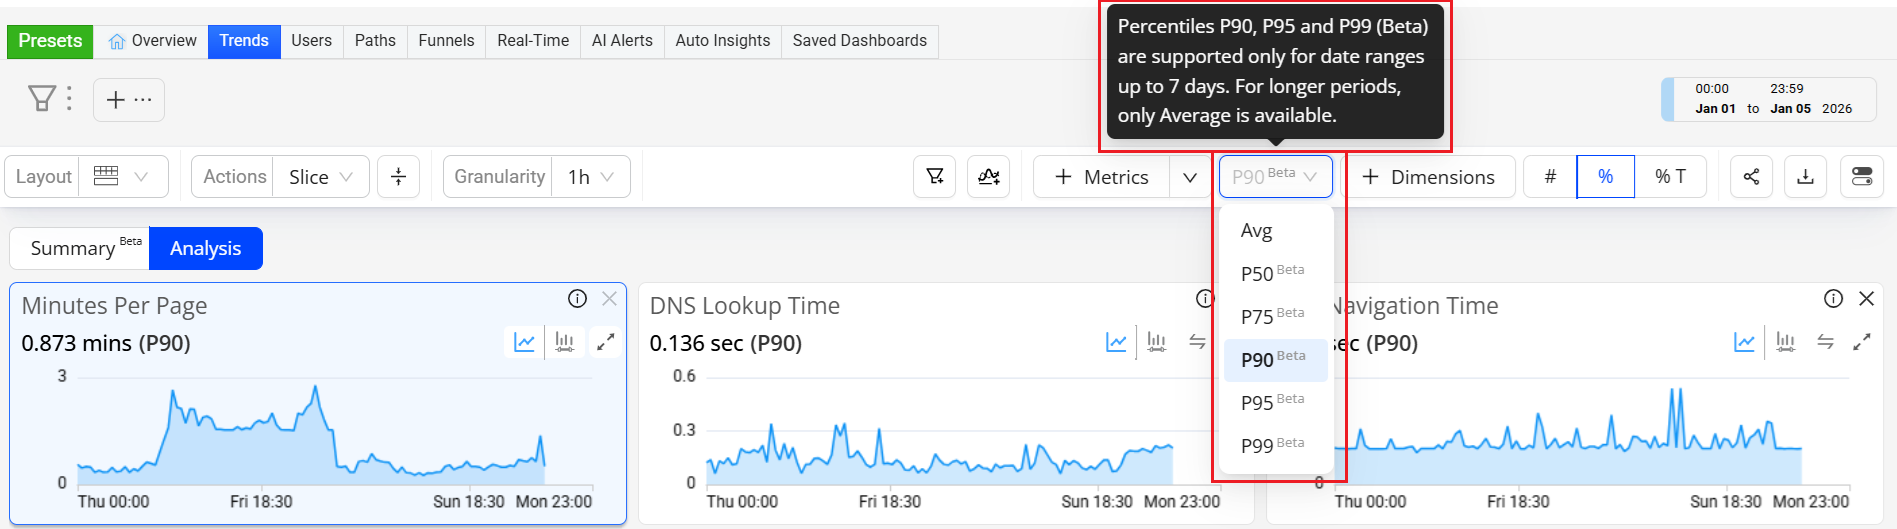
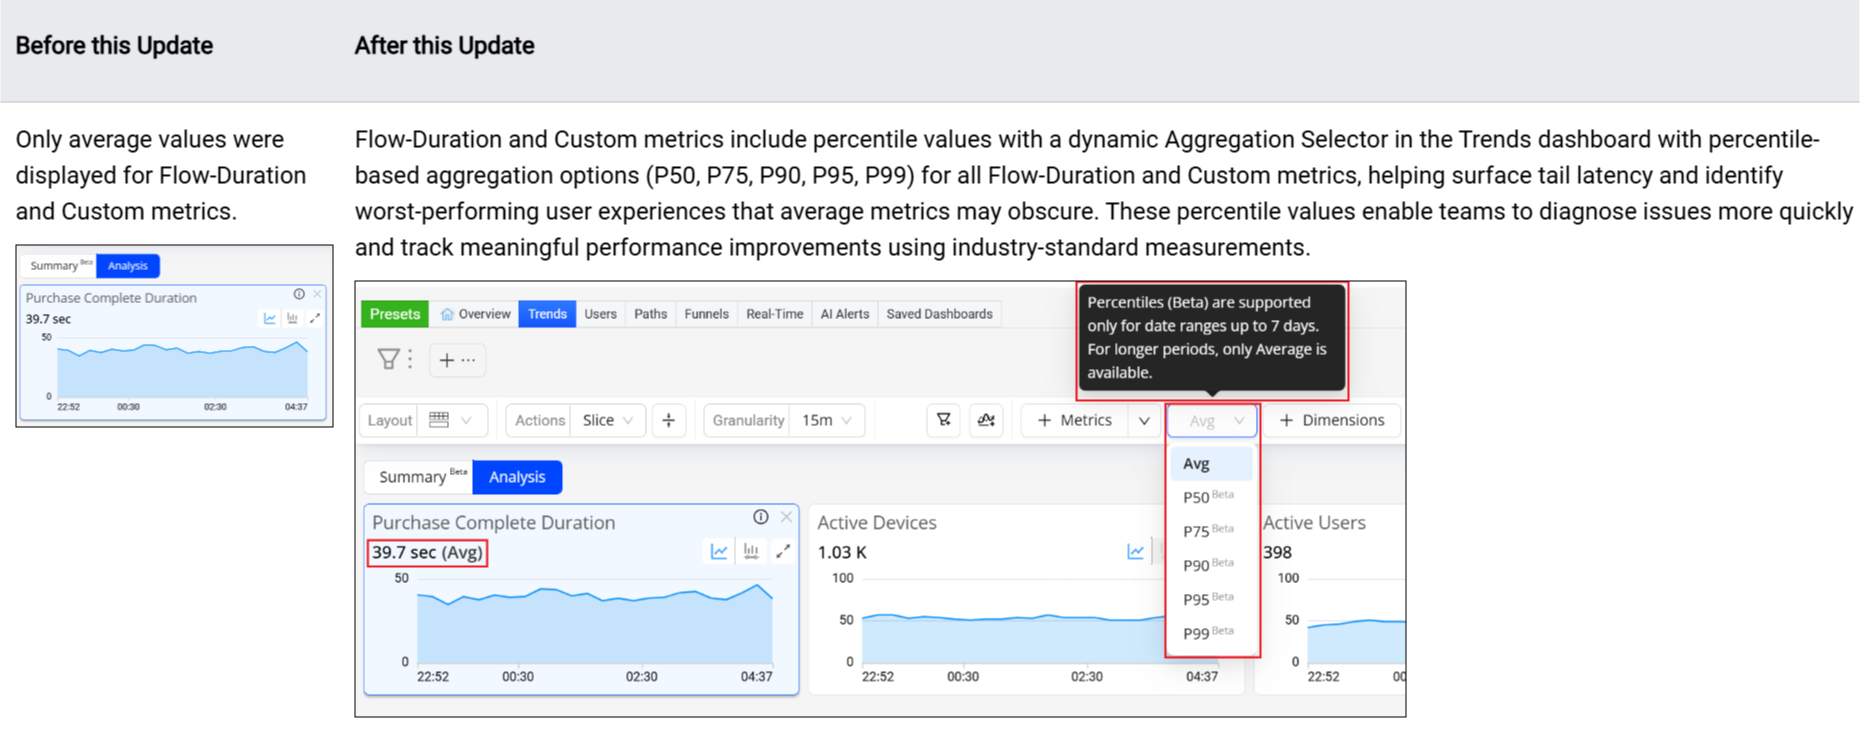
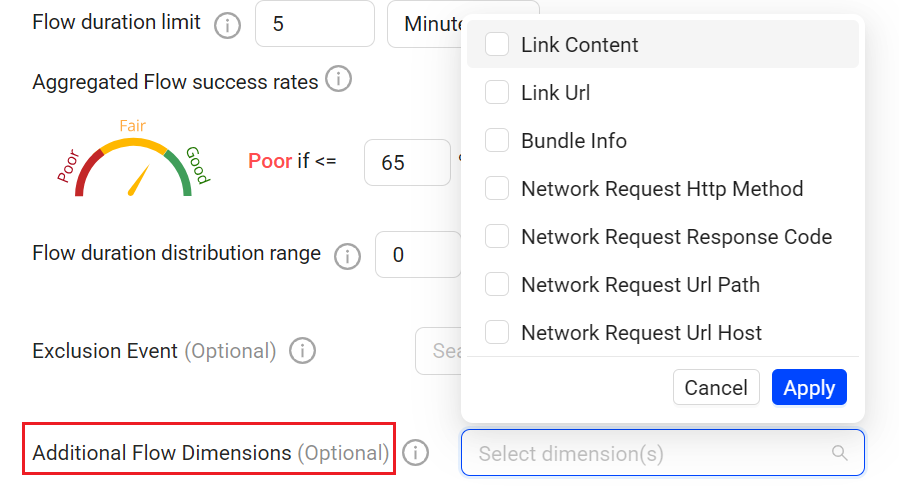
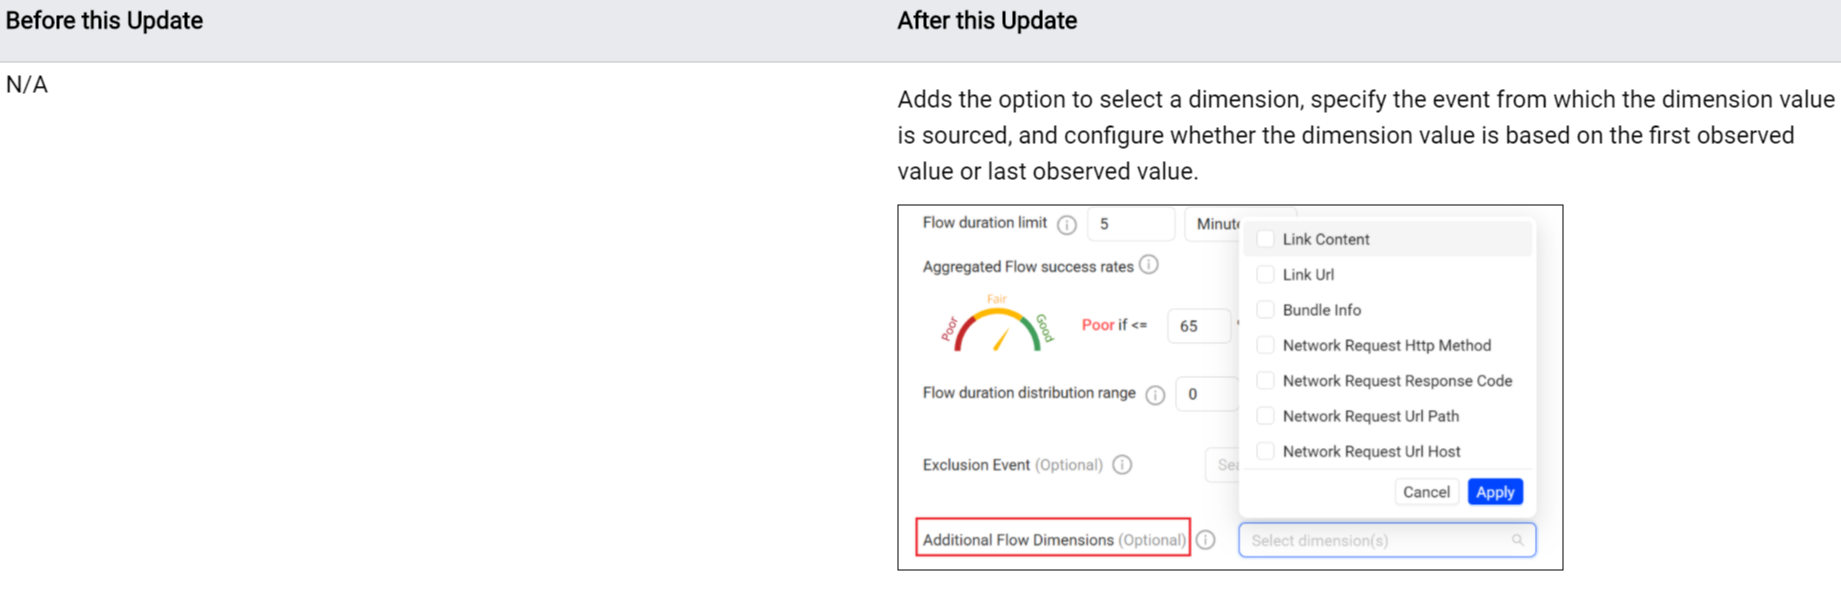
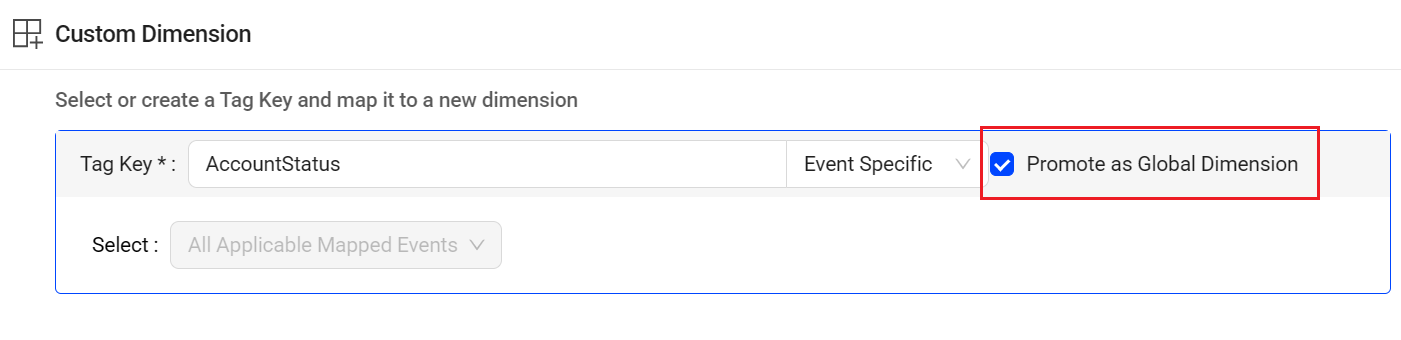
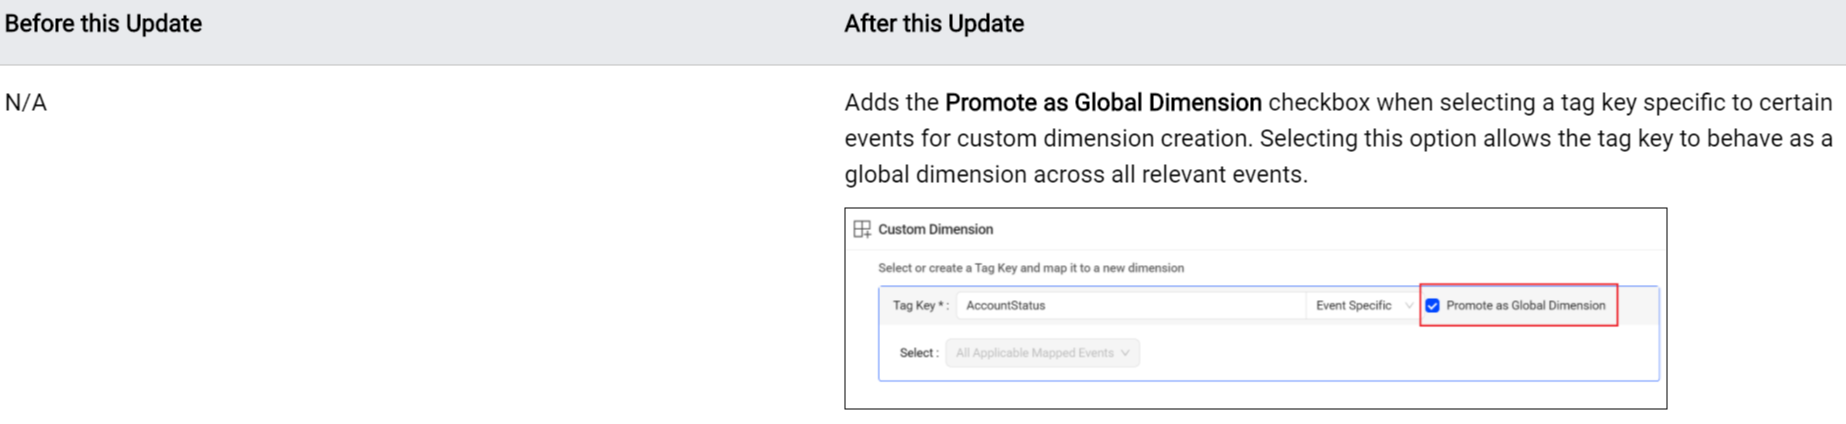
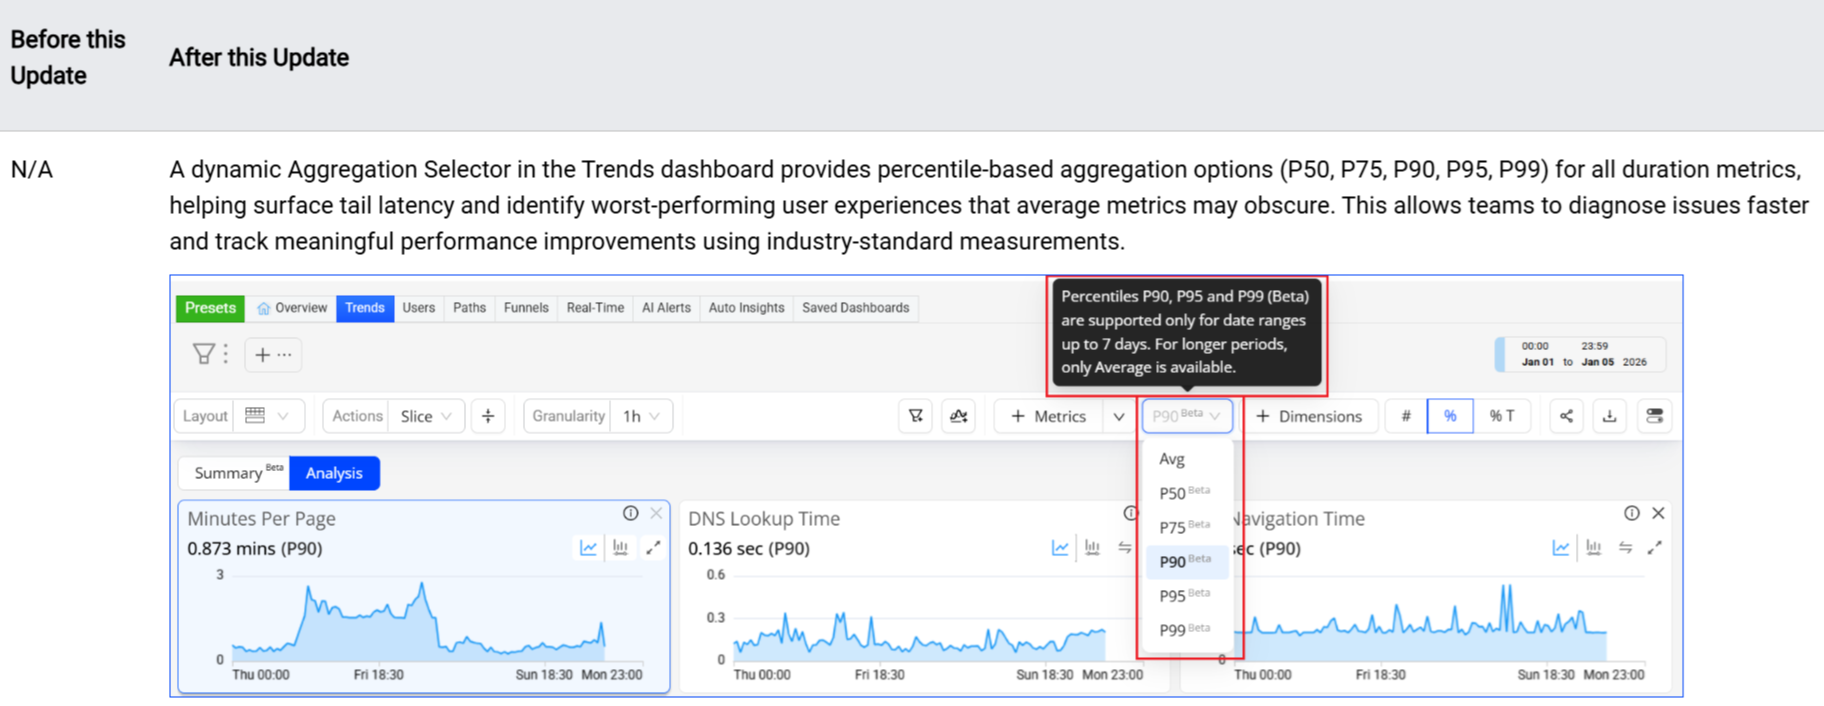
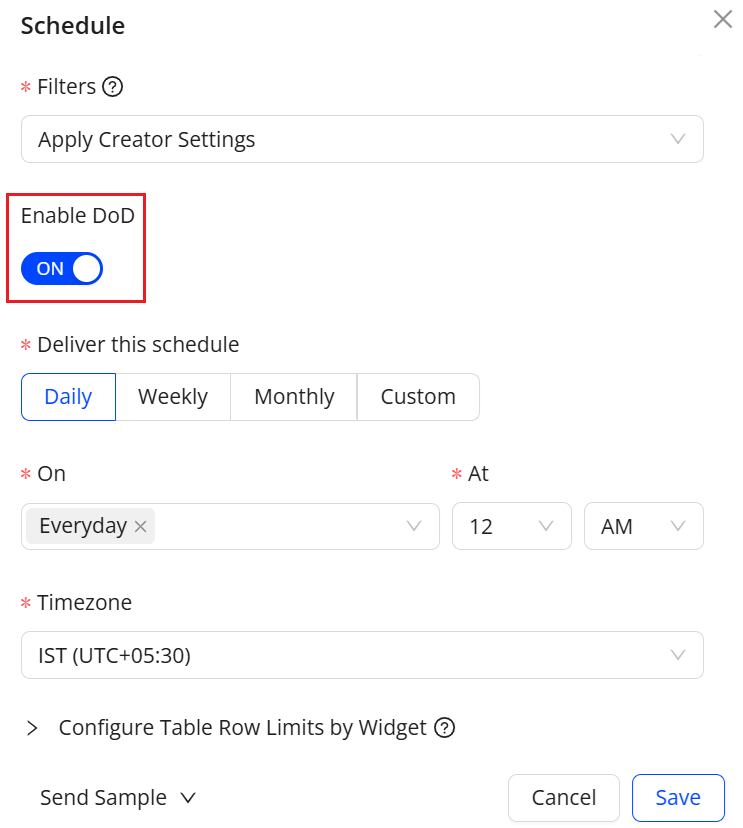
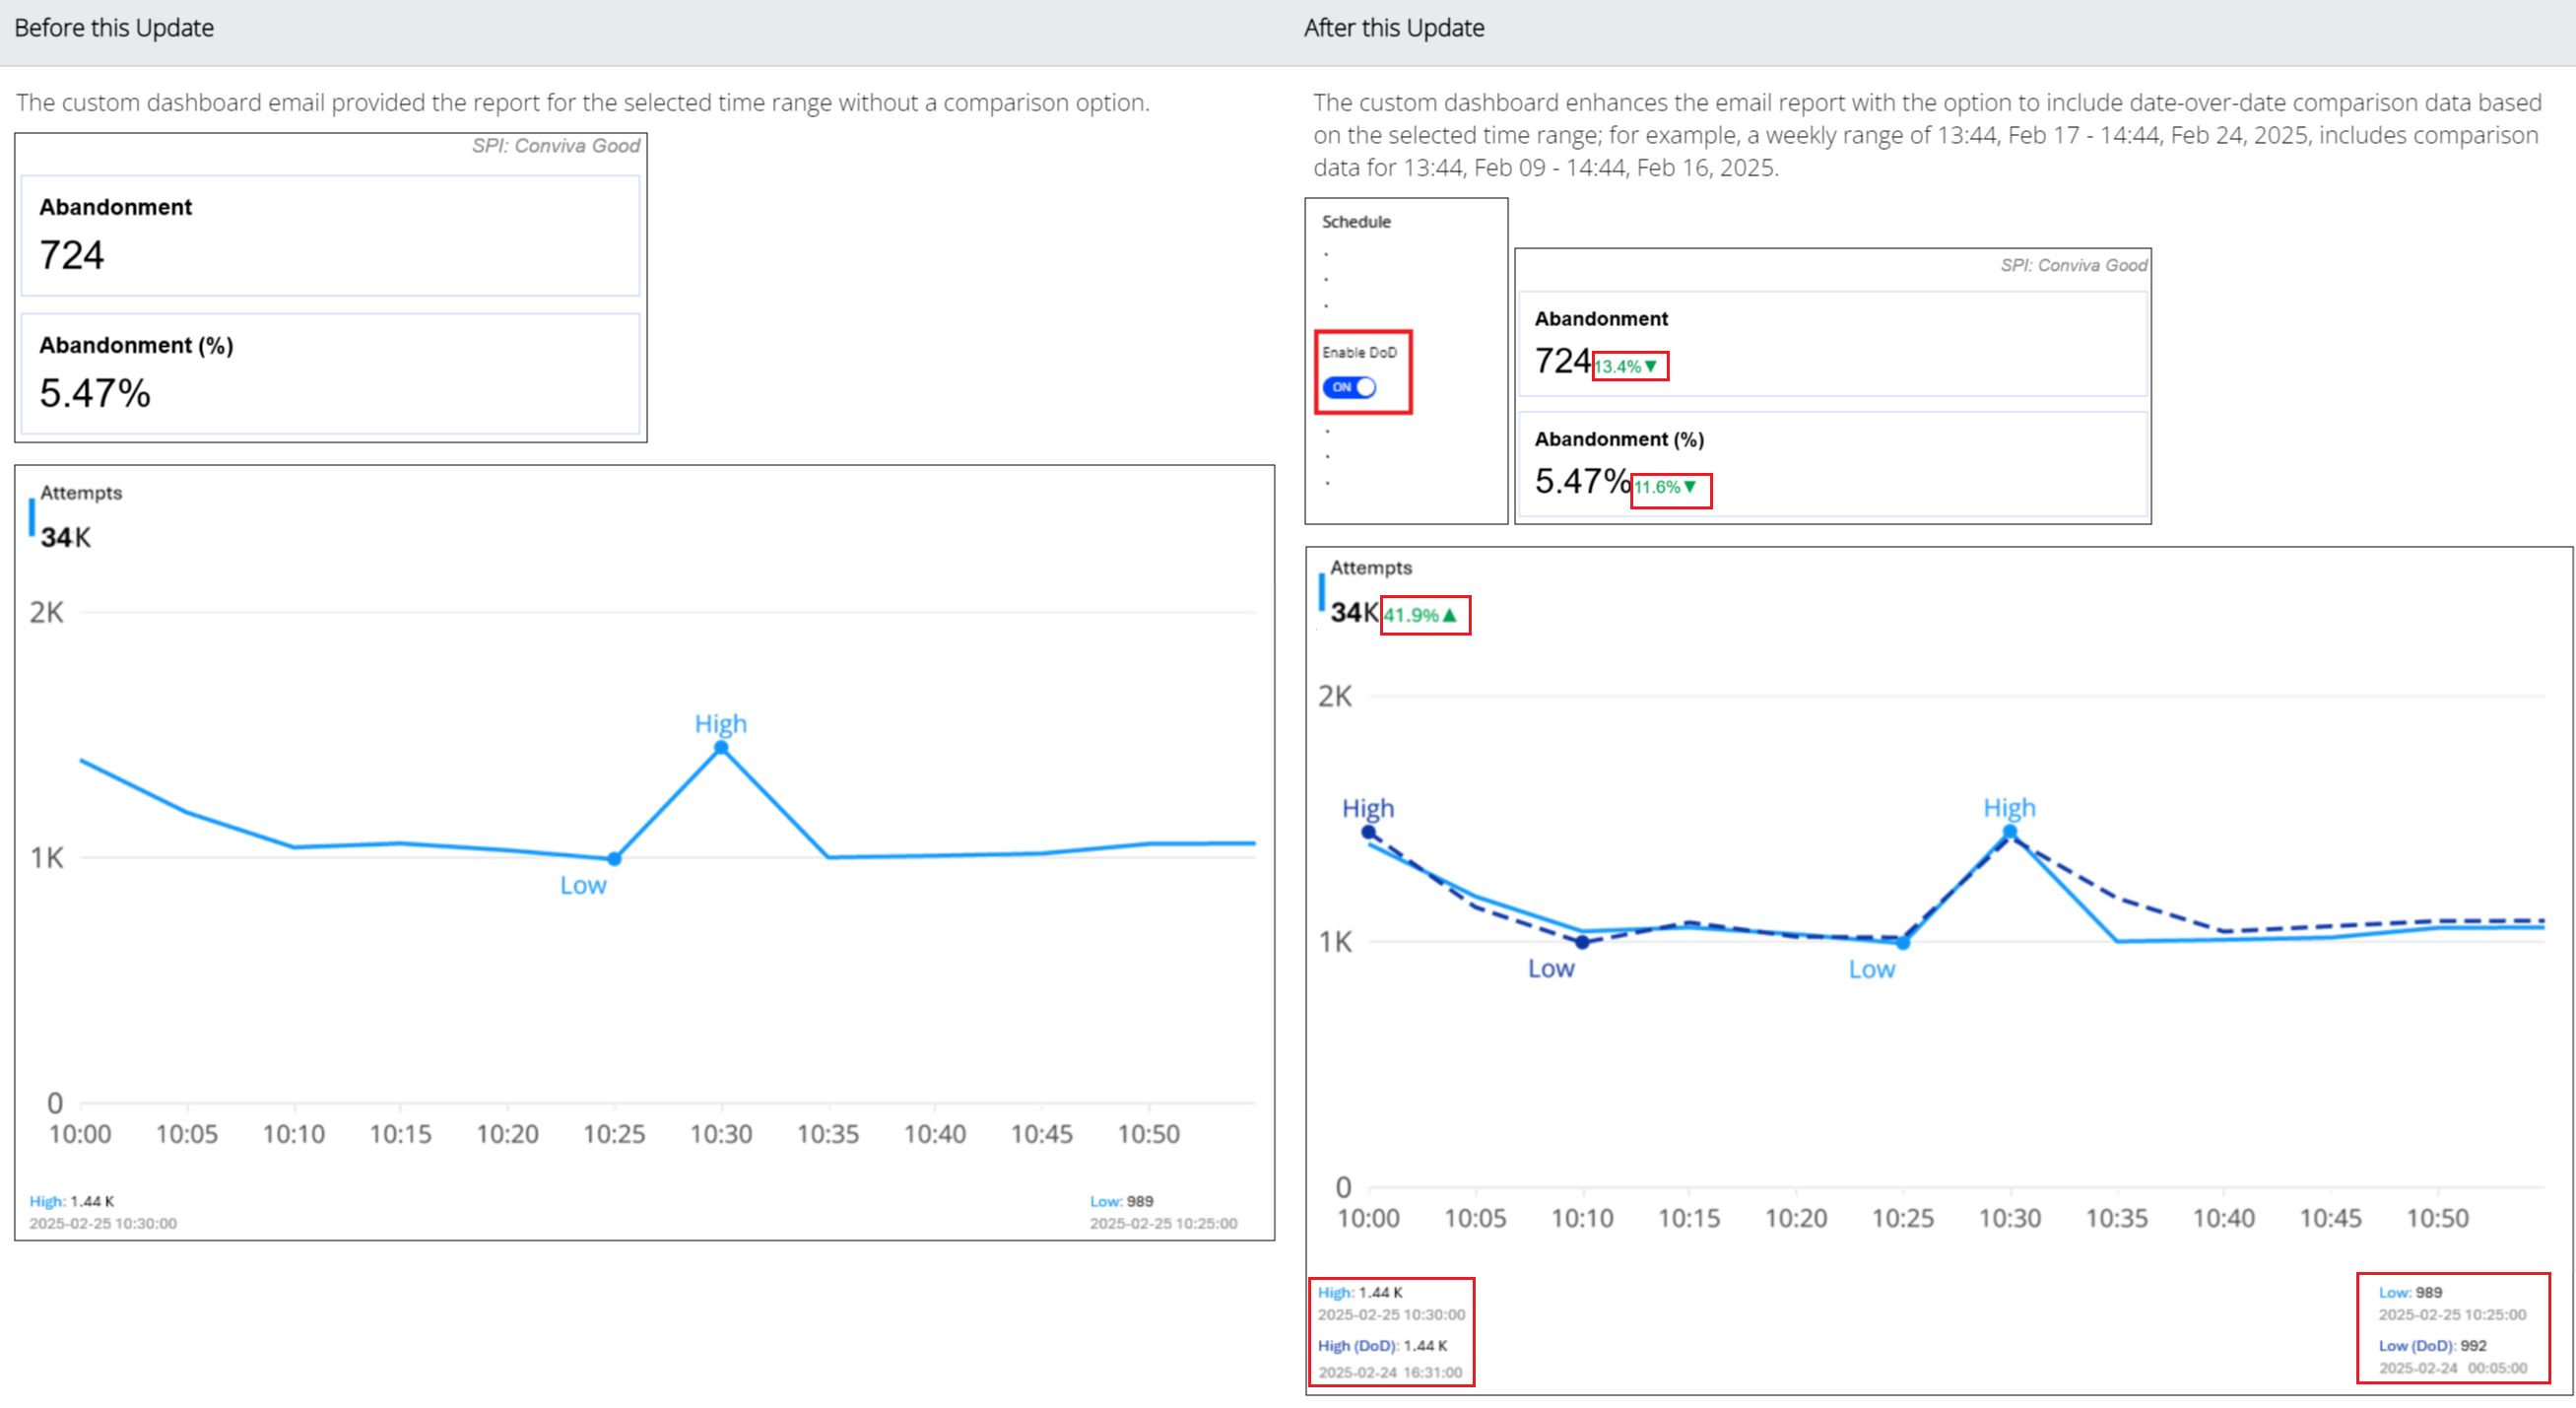
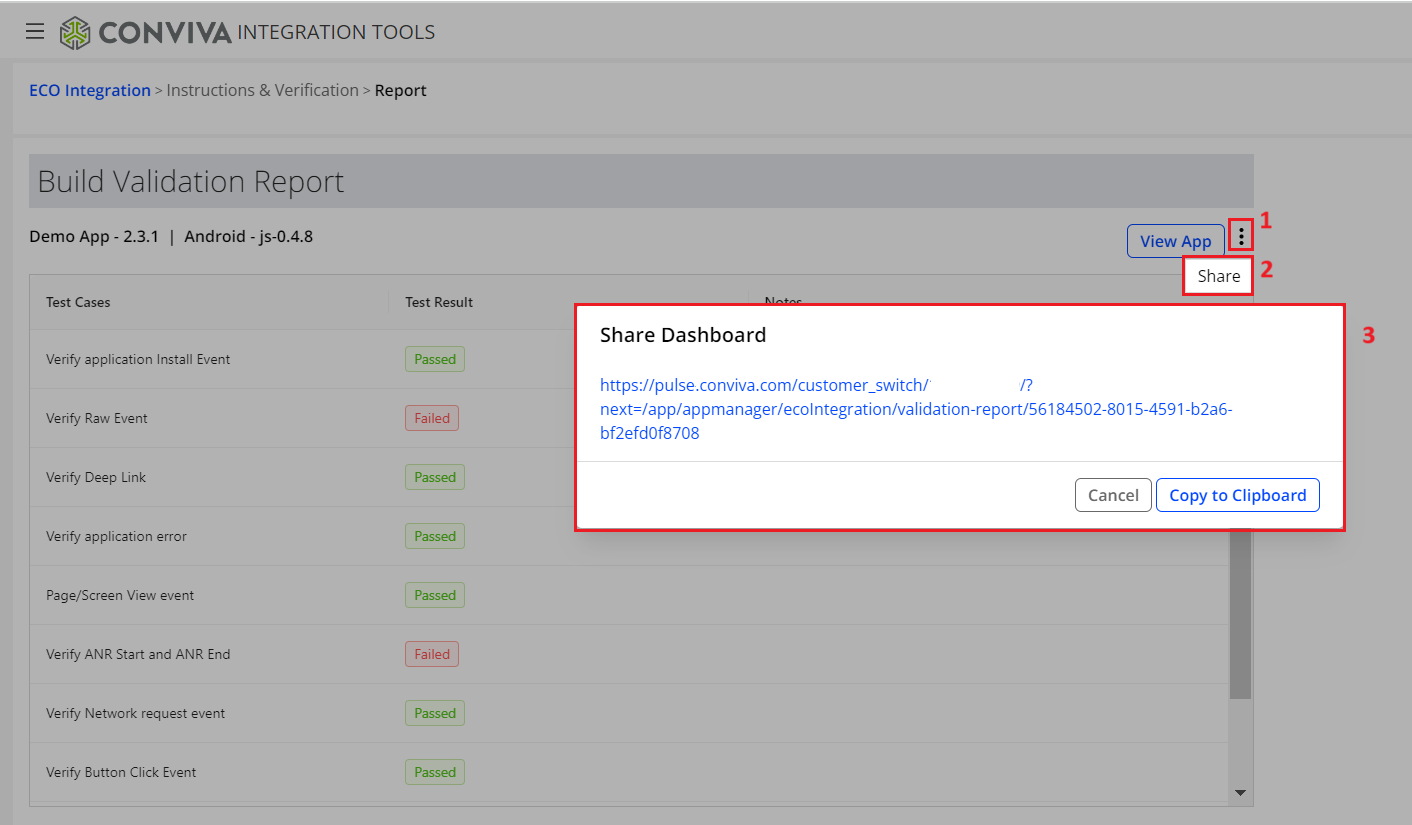
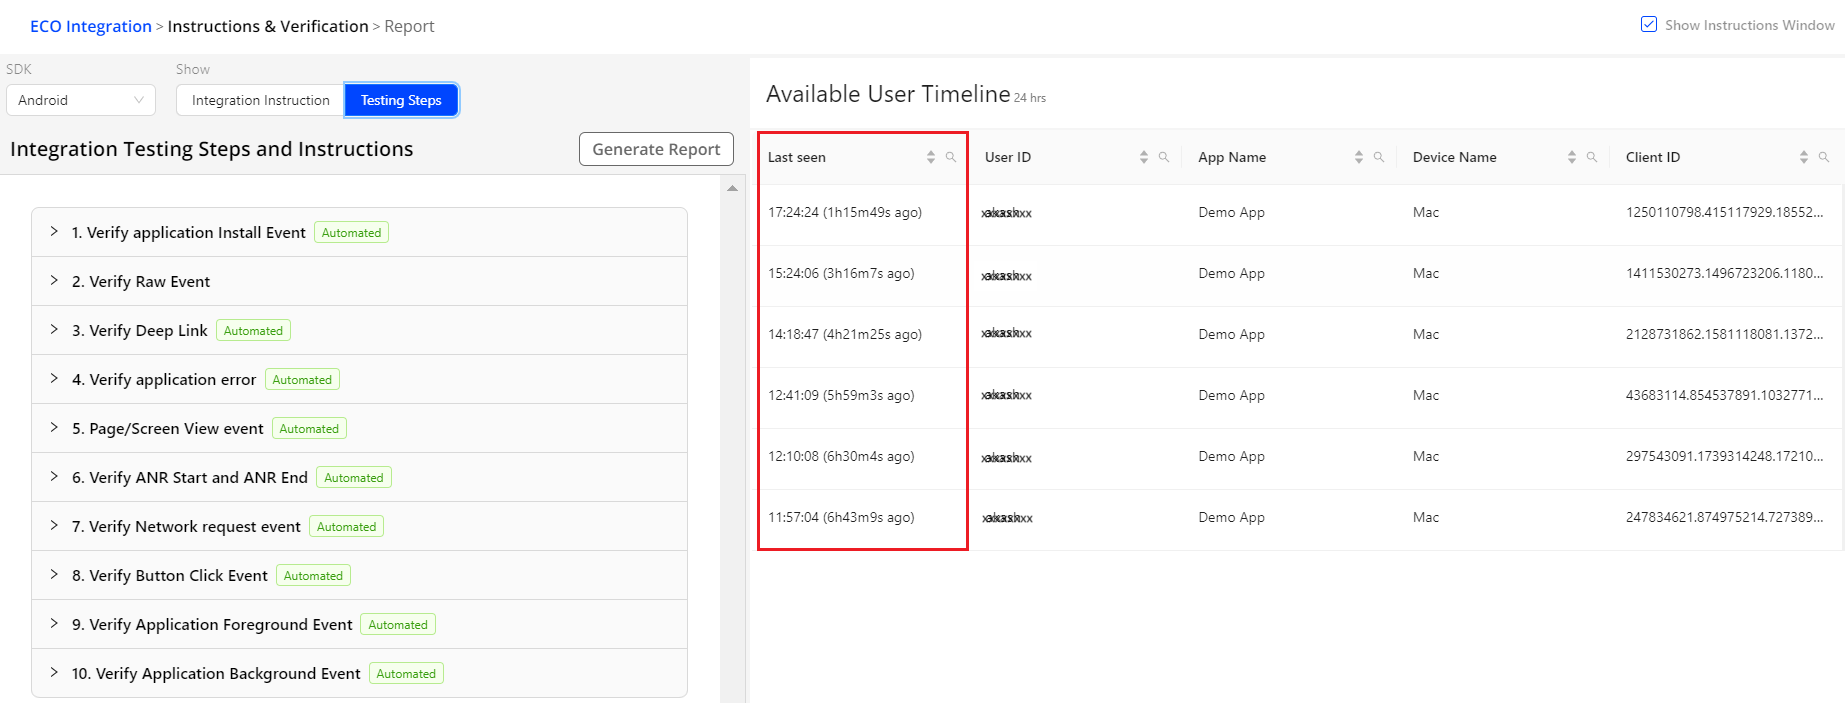
 if there is any datatype mismatch. Hover the mouse pointer on the icon to see the alert message, for example "Datatype mismatch. This field supports only "string" datatype".