
Viewer Acquisition
Viewer Acquisition enables streaming content publishers to analyze viewer acquisition patterns and viewer behaviors to better understand the factors driving new viewer engagement. The Viewer Acquisition widgets provide analysis across dimensional attributes that are best viewed in a time series, such as screen type, content category, genre, and other attributes in bar charts that drive the acquisition of new viewers, such as country, series, and channel.
Note: The Viewer Acquisition dashboard data refreshes every day and shows only new viewers in the data for the current date. The total number of viewers accumulates by adding the count of each day’s new viewers and is not impacted by the account retention period.
The insights from Viewer Acquisition are especially useful for Marketing teams to optimize their viewer acquisition strategies, such as identifying which assets and promotions drive the most new viewership.
Note: You can create a maximum of 31 cohorts at a time, and check the top 15 series as the very first sessions by new viewers in the selected period. If you want to check more top series as the very first sessions by new viewers, go to Analytics Workbench, create a data table using the First Watched option along with other options and dimensions, and check the top series from the created data table.
Note: With the Acquisition category in Analytics Workbench, you can extend the acquisition analysis beyond just the first content session watched. This allows you to do more customized analysis of viewer activity to understand the initial content watched (or any other attribute) to help drive acquisition, retention, and engagement. For more information on Analytics Workbench, see Analytics Workbench.
The dashboard consists of these widgets:
-
Identity level by time series
-
Identity level by bar charts
-
Identity level
-
Customize Cohorts
-
Filter
Note: The identity level specifies the type of displayed data, as Subscriber, Household, or App.
You can toggle the identity level to focus your analysis, such as an overview of household viewing patterns, subscriber acquisitions, and acquisition behaviors.
Toggling between subscriber and household identity levels is available only after Conviva enables stream ID and the client ID is not selected as the subscriber ID.
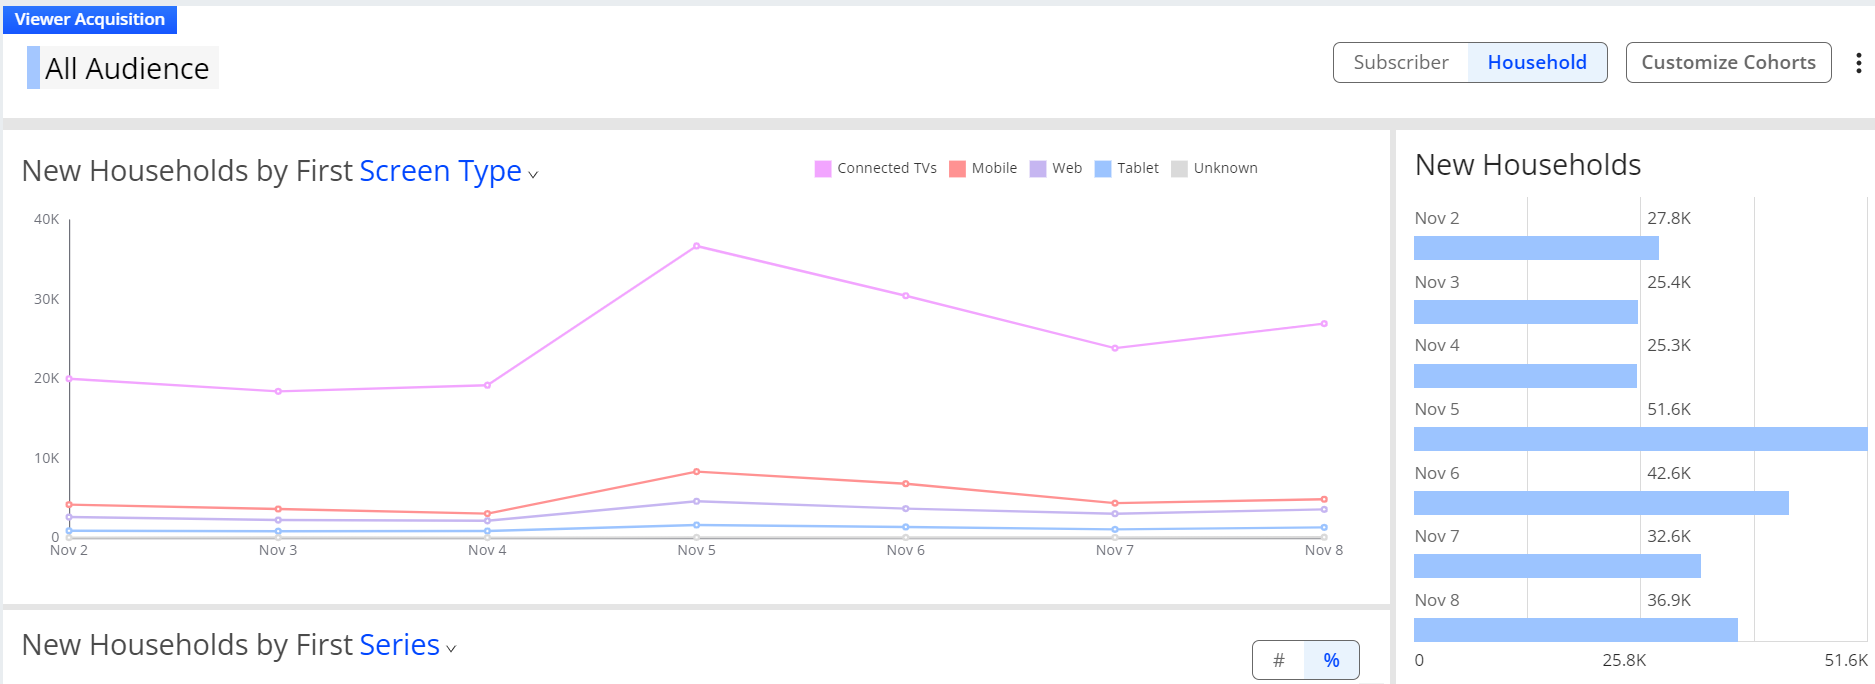
Note: Viewer Acquisition captures data about the first play only for subscribers or households who have not previously interacted with the platform.
Viewer Acquisition Widgets
Viewer Acquisition displays data in the following widgets:
-
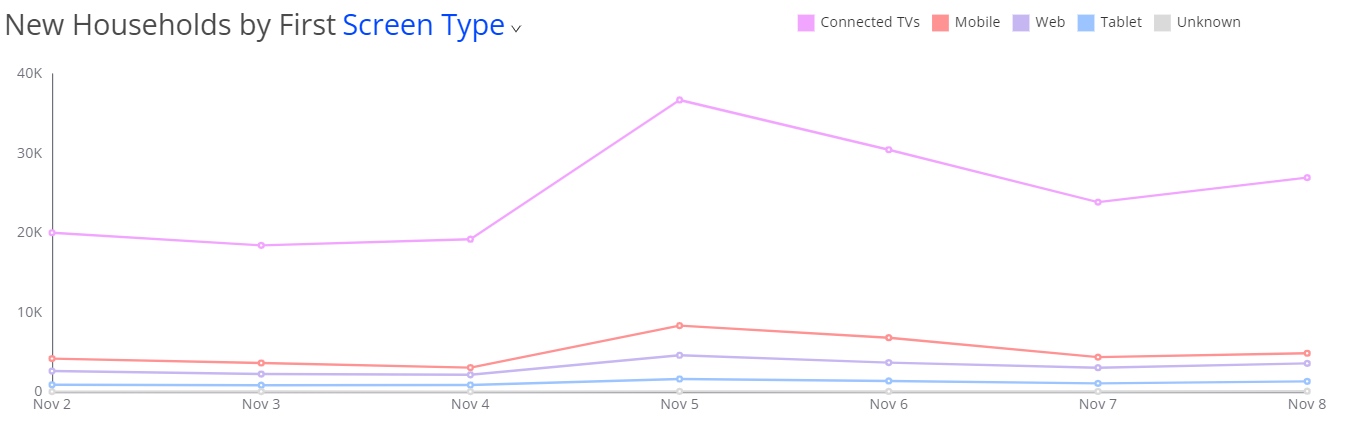
Identity level by time series provides analysis for the dimensions such as screen type, category, genre. This widget displays the data in a line graph for the top five values for the dimension.
To hide / show the data related to a value, select / deselect the value on the top-right of the widget.
-
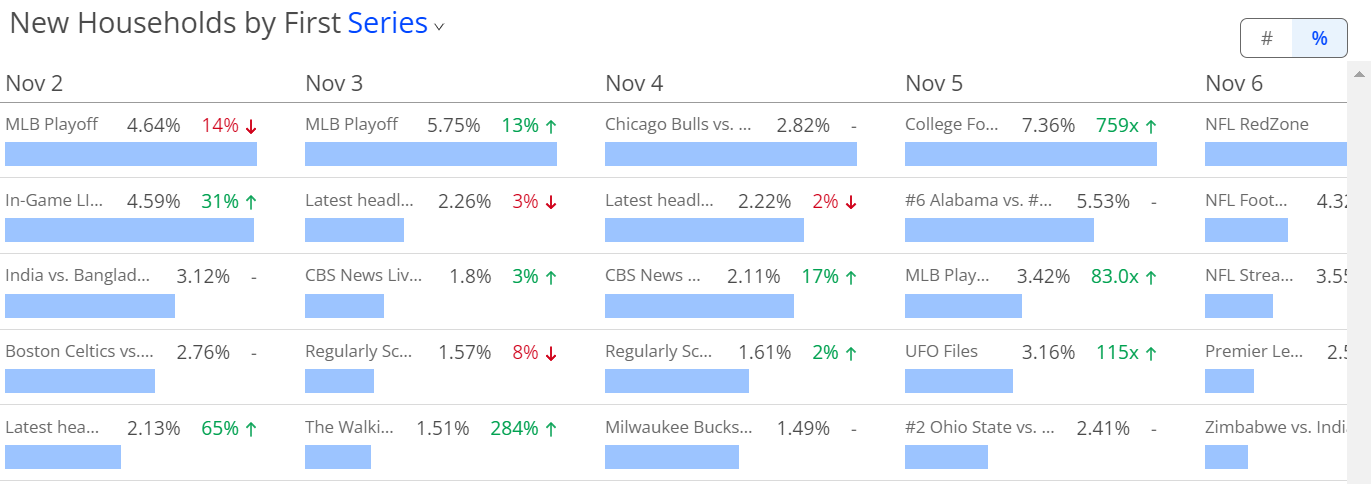
Identity level by bar charts provides analysis for the dimensions, such as country, series, channel. Apart from the available dimension, you can add specialized dimensions that are unique to your analytics, such as appversion, sourcetype. Use the toggle to switch between the number and percent of new viewers across cohort data.
The cohorts are shown in each column for the selected cohort size, with a ranking by new viewers of the selected dimension values, in this case movies ranked first, NBA on TNT ranked second, and Snowpiercer ranked third for the Jan 2021 cohort. The value after the dimensional value name shows the number or % of new viewers in the cohort for that dimension value. The percent in green/red shows the percent change in new viewers versus the previous cohort period. A dash (-) indicates data was unavailable. An asterisk (*) indicates the percent increase/decrease was more than 1000%.
-
Columns represent the cohorts of New Viewers for the selected cohort size, for example monthly from January to April 2021.
-
The value after the dimensional value name shows the number or % of new viewers in the cohort. For example, the Jan 2021 movies cohort (row1) had 285.4k new viewers.
-
The percent in green/red shows the percent change in new viewers versus the previous cohort period. For example, -4% for Snowpiercer (row 6) in the Mar 2021 column indicates 4% drop from Snowpiercer (row 3) in the Feb 2021 column.
This value appears even if the dimension value is not shown in the previous cohort period, such as All Elite Wrestling (row 5) in the Feb 2021 cohort.
-
-
The Customize Cohorts filter:
-
The Cohort Size is the granular time within the selected period. For example, you can choose Day to display day by day data or Week for week over week data.
-
The Initial Cohort Time Frame is the period for which you want to see the number of acquired subscribers or households. For example, new subscribers from Oct 11, 2021, to Oct 17, 2021.
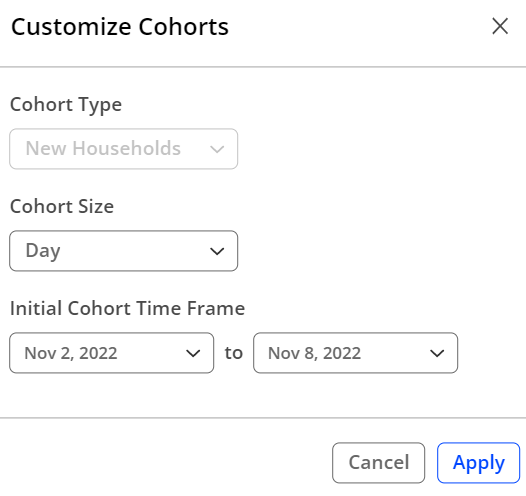
Note: You can create a maximum of 31 cohorts at a time. Each cohort appears as a separate column in the Identity level by bar charts.
-
-
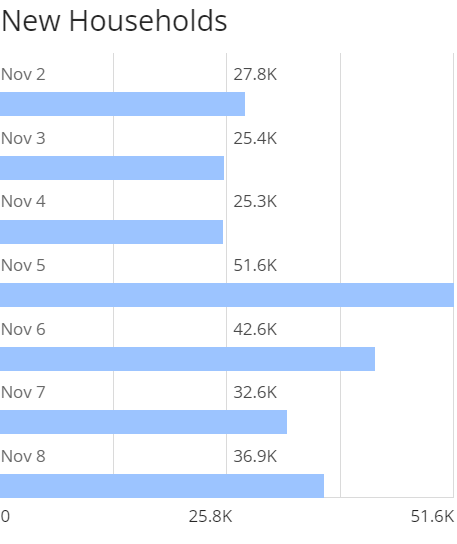
Identity level displays the number of subscribers or households acquired in the selected period.
Identity Level Details
Based on the data available in Audience, a new user is identified when a viewer plays a stream for the first time. Audience assigns a unique ID based on the type of configured primary viewer ID.
| Configured Primary ID | Identity level reference |
|---|---|
|
Subscriber ID |
new subscriber |
|
Stream ID |
new household Note: This means that it is the first time that Audience has identified the household stream content. |
|
Conviva Client ID |
new app |
Cohort Analysis
A cohort is an audience of users that are based on an attribute that does not change, for example, the date and conditions of their first or last stream. In Viewer Acquisition, cohort specifically refers to the new viewers acquired by your streaming platform based on the settings in Customise Cohorts.
The scope of new viewers acquired depends on how far back Conviva data is available in your account. Conducting a cohort analysis determines the acquisition characteristics of the specified cohort over time, the percentage of new viewers compared to the previous period, and the most common device type used by new viewers.
Working with Viewer Acquisition
To access Viewer Acquisition, from the Audience application menu, click Viewers, and then click Viewer Acquisition. By default, this page displays:
-
Identity level by time series with analysis for the last 7 days for the New Users by First Screen Type dimension.
-
Identity level by bar charts with analysis for the last 7 days for the New Users by Series dimension.
-
Identity level displays with the number of users acquired for the last 7 days.
To work with Viewer Acquisition, you must first define the cohort settings.
-
Click Customize Cohorts. The pre-selected Cohort Type is New Viewers.
-
In the Cohort Size menu, choose from the following cohorts:
-
Day: Use this cohort if, for example, you are running an acquisition campaign and you want to see the number of viewers acquired on a day-by-day basis.
You can view and compare the data for all the days between the two selected dates. For example, if you select the time frame from Oct 1, 2021 to Oct 5, 2021, the data displayed is for all the days between Oct 1 and Oct 5.
-
Week: Use this cohort for analysis based on weekly usage, for example, you want to gauge the number of acquisition as a result of a series that streams weekly, or you are tracking a particular segment of viewers and their weekly viewing pattern.
-
Month: Use this cohort or analysis based on monthly usage, for example, you have a monthly subscription model and you want to see the monthly audience growth.
-
-
In the Initial Cohort Time Frame menu, select the range of the cohort based on the cohort size.
-
Click Apply.
Viewer Acquisition displays the data for the selected cohort and the number of new viewers acquired in that period.
Note: The data displayed on this page are rounded off to the nearest decimal. For the exact values, export the report.
Working with Filters
You can perform acquisition analysis based on filters that include a segment of viewers and filters by the 'First Stream' attribute. First Stream refers to the first video session streamed by a new viewer and consists of filter attributes related to how the new viewer consumed that content, including:
- When: date / day / day-part
- What: series / episode / genre / category
- How: screen type / device type
- Where: country / state / DMA
- Who: viewer ID
Note: The computation of new viewers acquired is based on the data loaded in Audience' dataset. For example, if Audience has 3 months of data, the analysis is subject to that time period only.
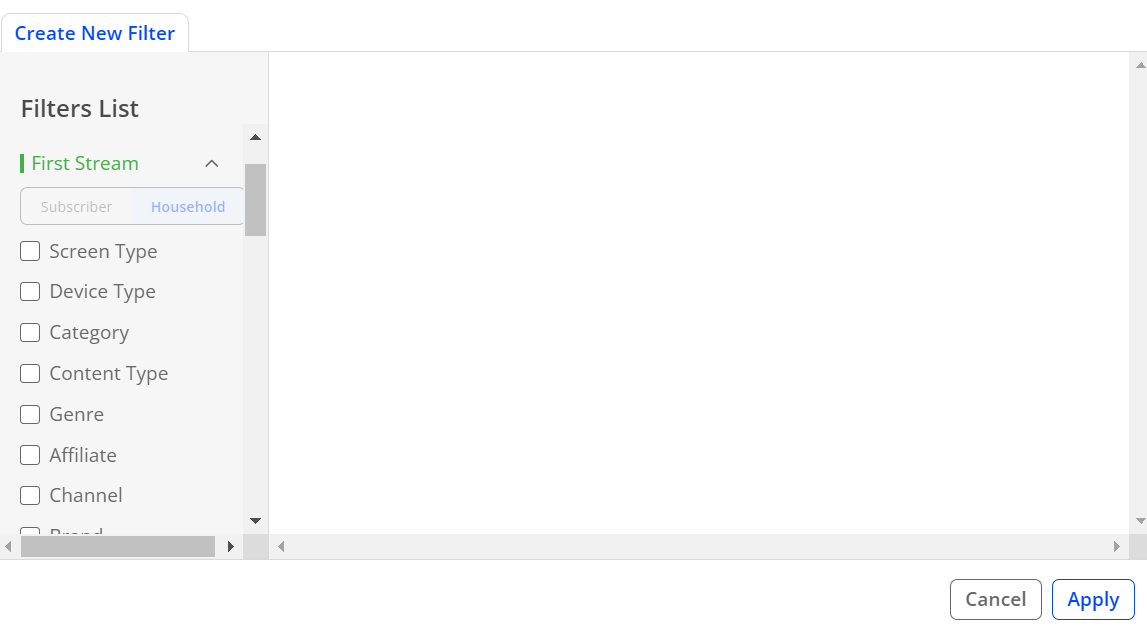
When a First Stream filter is applied, Viewer Acquisition displays the viewers whose first stream on the platform matches the selected dimension. All the dimensions in the First Stream category filter the viewers' first video session.
For example, if you filter by the dimension 'Screen Type = Mobile' and 'Content Type = VOD', the data displayed contains viewers whose first stream on the platform was a VOD streamed on a mobile device.
Note:
For more information about about applying filters and filter options, see Using Filters.
Exporting and Sharing Viewer Acquisition Analysis
When viewing and analyzing data, Viewer Acquisition enables data export and sharing for further analysis and data aggregation. Data is exported as a CVS file with data from the current display page. Exporting data from the current page creates the following export files:
- new_viewers_chart
- new_viewers_summary
- new_viewers_table
To export data, or copy and manually share the link to the display page, click the kebab menu next to Customize Cohorts and click Export or Copy Link.
Note: To access the shared link, the receiver of the link must have access to the c3 account.
Performing Drill-down Analysis
Viewer Acquisition widgets support single-click navigation so you can gauge how viewers that were acquired for a particular cohort engaged with your content and their retention of the same cohort across different time ranges.
Drilling down from Viewer Acquisition completes a workflow from acquisition to retention and content engagement. This enables you to seamlessly track a particular cohort’s performance through acquisition, retention, and other KPIs related to content consumption.
- To view data about viewer engagement with your platform and retention analytics, drill-down from any widget on Viewer Acquisition to the Viewer Retention page.
- To view data about metrics such as total minutes and plays, and to analyze content engagement from other dimensions, drill-down from any widget on Viewer Acquisition to the Overview page.
When drilling-down, the following context from Viewer Acquisition is carried over to the resultant page:
| Overview Dashboard | Viewer Retention Page |
|---|---|
|
|
Drill-down examples
- If you drill-down to the Overview / Viewer Retention page from a data point, the time frame and dimension you chose to analyze (for example, device type) are carried over to the resultant page.
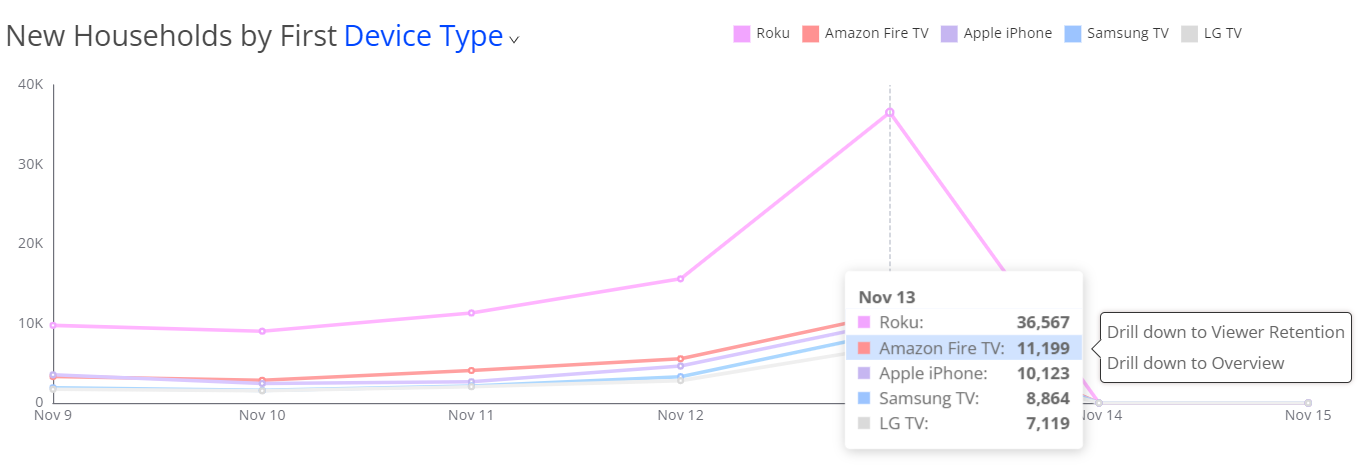
- If you drill-down to the Overview page from a cohort (New Households by First Series), the time frame and the two dimensions you chose to analyze (for example, device type and the name of the series) are carried over to the Overview page.

- If you drill-down to Viewer Retention from a cohort (New Households by First Series), the time frame and the name of the series are carried over for retention analysis.
- If you drill-down from New Households in Viewer Acquisition to the Overview / Viewer Retention page, the cohort size, time frame, and all the filters that you applied are carried over to the resultant pages.
Segments
You can create a segment on the Overview page for the analytical data based on the context and filters that you selected on the Viewer Acquisition page. For more information, see Create Segments.