
Pathing
Pathing helps you analyze engagement across your most frequently viewed content and quickly understand high-level content affinities. Audience monitors which content path were most frequently used in the selected period, and displays the top 10 viewing paths between the content. A content path is a sequence of up to three, continuously watched content within a single sitting. Sitting is an aggregate of all content played by a viewer in succession with no more than 60 minutes (configurable) break between each content played. For more information, see Sitting.
You can use pathing to:
-
Monitor your most engaging content paths to discover which 'lighthouse' assets increase viewership.
-
Identify content affinities to build engaging viewership flows to promote continuous viewing.
-
Quickly determine which assets can lead to higher pass-through and fewer drop-offs.
Note: Contact your Conviva representative to customize the default break duration required to define a single sitting.
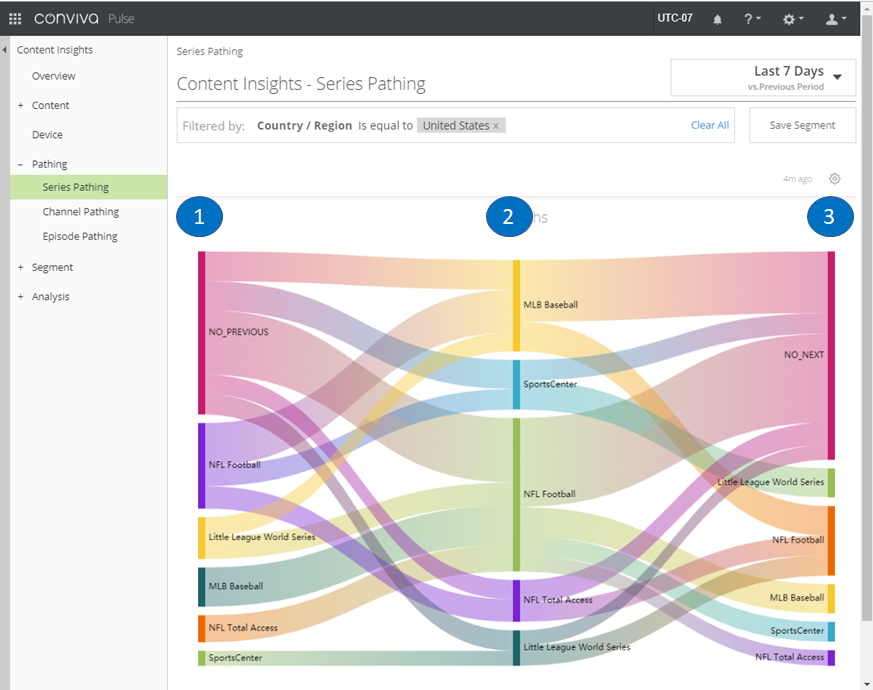
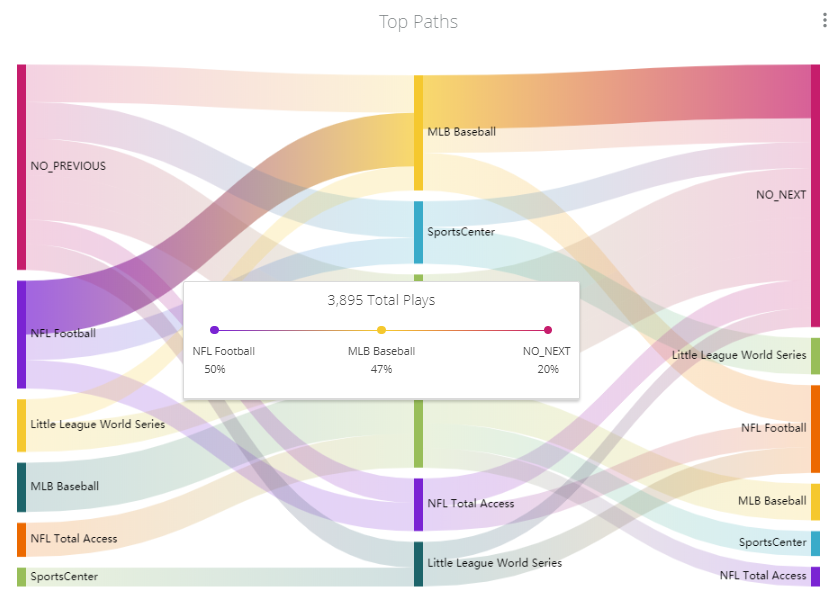
Audience present content paths using three progression points: (1) content of origin , (2) pass-through content , and (3) end content. The viewing paths connecting content are color coded to distinguish between flows, with flow widths indicating the relative amount of traffic. When viewing goes beyond the third content progression, Audience considers this as a new viewing path and compares this path with the other paths to select only the top 10 viewing paths.
Content of Origin
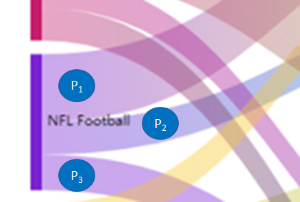
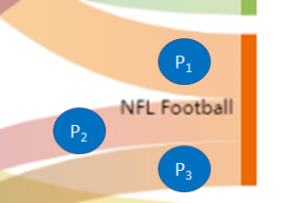
Depending on the selected path view, this point in the content path indicates the series, channel, or episode from which viewers started watching content during the selected interval. Hovering over a content of origin marker displays the top paths viewers took after watching that content. In this example, the top viewing paths that started watching NFL Football then continued to watch three other series: MLB Baseball (P1), NFL Total Access (P2), and Sports Center (P3).
Hover over a specific progression point in the content path to display the pathing details.
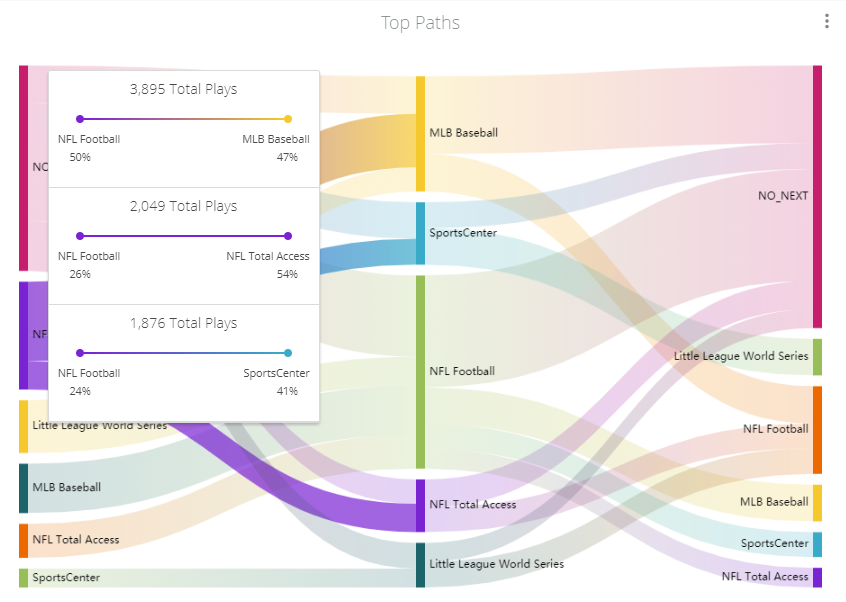
Audience displays path measurements for content of origin to help you analyze the content viewers watched after viewing this content.
|
Path Measurement |
Description |
|---|---|
|
Total Plays |
The total number of plays that occurred between the content of origin and the next watched content. In this case, 3,895 viewers watched NFL Football and then also watched MLB Baseball (P1), 2,049 viewers watched NFL Football and then also watched NFL Total Access (P2), and 1,876 viewers watched NFL Football and then also watched SportsCenter (P3). |
|
Content of Origin Percentage |
The percentage of this total content viewership participating in this content path. For NFL Football, 50% of the total NFL Football viewership followed viewing path (P1) to also watch MLB Baseball, 26% of the total NFL Football viewership followed viewing path (P2) to also watch NFL Total Access, and 24% of the total NFL Football viewership followed viewing path (P3) to also watch SportsCenter. As the selected path progression, the origin percentages represent 100% of the NFL Football viewers. |
|
Pass-Through Content Percentage |
The percentage of this total content viewership participating in this content path. For MLB Baseball, 47% of the total MLB Baseball viewership followed viewing path (P1) that previously watched NFL Football, 54% of the total NFL Total Access viewership followed viewing path (P2) that previously watched NFL Football, and 41% of the total SportsCenter viewership followed viewing path (P3) that previously watched NFL Football. |
Note: To highlight content affinities, the total percentages of origin content and pass-through content represent the traffic associated with only the top 10 content paths, and not all viewership.
Pass-through Content
Hovering on a pass-through marker displays viewer data about the origin, pass-through, and destination content viewership. In this example, the highlighted pass-through content shows viewers that started watching three other series options (NFL Football, No Previous, and Little League World Series) and, when finished watching the MLB Baseball series, then watched either 'No Exit' or NFL Football).
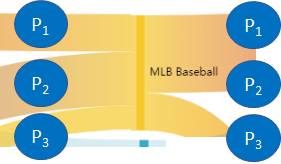
Hover over the pass-through content progression point in the content path to display the pathing details.
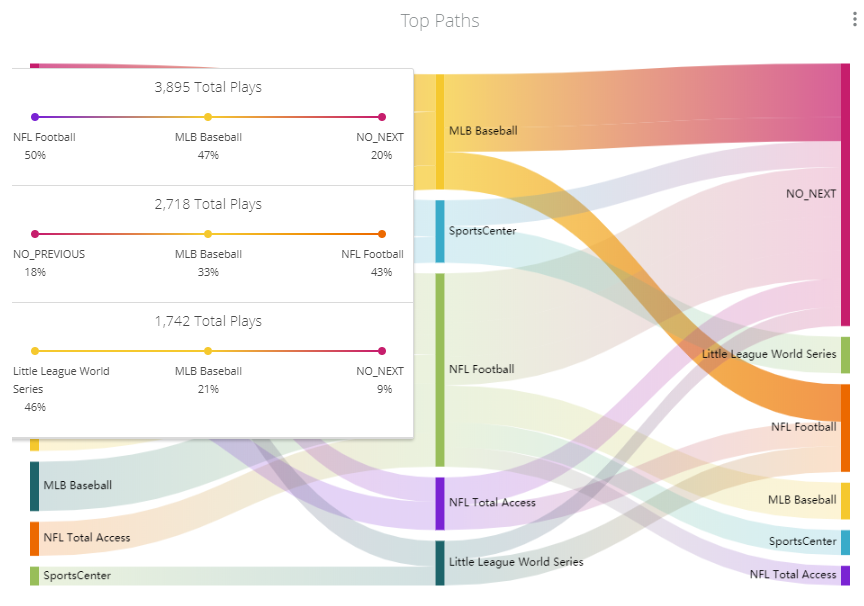
Audience displays path measurements for the entire pathing stream to help you analyze which paths led viewers to watch which content.
|
Path Measurement |
Description |
|---|---|
|
Total Plays |
The total number of plays that occurred between the content of origin, pass-through content, and the end content. In this case, 3895 viewers watched NFL Footbal, then watched MLB Baseball, and then ended the sitting (P1); 2718 viewers watched no previous content, and then watched MLB Baseball, and then watched NFL Football (P2), and 1,742 viewers watched Little League World Series, and then also watched MLB Baseball, and then ended the sitting (P3). |
|
Content of Origin Percentage |
The percentage of this total content viewership participating in this content path. For NFL Football, 50% of the total NFL Football viewership followed viewing path (P1) to also watch MLB Baseball, 18% of the viewers with no previous viewing followed viewing path (P2) to watch MLB Baseball, and 46% of the total Little League World Series viewership followed viewing path (P3) to also watch MLB Baseball. |
|
Pass-Through Content Percentage |
The percentage of this total content viewership participating in this content path. For MLB Baseball, 47% of the total viewership of MLB Baseball previously watched NFL Football, 33% of the total MLB Baseball viewership viewership followed viewing path (P2) to start watching without any previous viewing, and 21% of the total MLB Baseball viewership followed viewing path (P3) to start watching from the Little League World Series. As the selected path progression, the pass-through percentages represent 100% of the MLB Baseball viewers. |
|
End Content Percentage |
The percentage of this total content viewership participating in this content path. For 20% of the total viewership who watched no next series came from MLB Baseball, 43% of the total NFL Football viewership came from MLB Baseball, and 9% of the viewers with no next series came from MLB Baseball. |
Note: To highlight content affinities, the total percentages of origin content, pass-through content and end content represent the traffic associated with only the top 10 content paths, and not all viewership.
End Content
Depending on the selected path view, the end content point in the content path indicates the series, channel, or episode from which viewers ended a viewing path during the selected interval. Hovering over a end content marker displays the top paths viewers took that led to watching that content. In this example, the top viewing paths that ended watching NFL Football came from three other series: MLB Baseball (P1), Little League World (P2), and NFL Total Access (P3).
Hover over the end content progression point in the content path to display the pathing details.
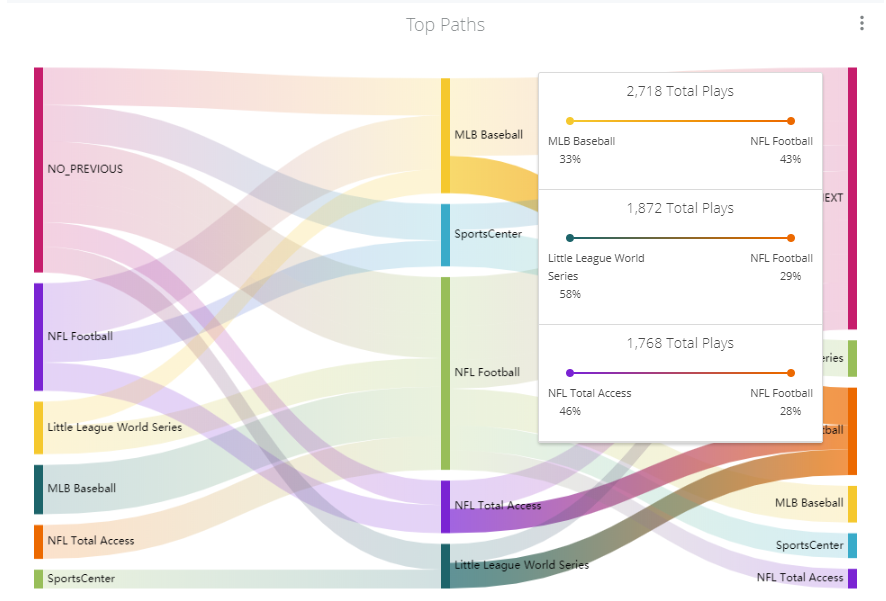
Audience displays path measurements for the end content to help you analyze which paths led viewers to watch this content.
|
Path Measurement |
Description |
|---|---|
|
Total Plays |
The total number of plays that occurred between the pass-through content and the end content. In this case, 2718 viewers watched MLB Baseball and then also watched NFL Football (P1), 1872 viewers watched Little League World Series and then also watched NFL Football (P2), and 1,768 viewers watched NFL Total Access and then also watched NFL Football (P3). |
|
Pass-Through Content Percentage |
The percentage of this total content viewership participating in this content path. For MLB Baseball, 33% of the total MLB Baseball viewership followed viewing path (P1) to also watch NFL Football, 58% of the total Little League World Series viewership followed viewing path (P2) to also watch NFL Football, and 46% of the total NFL Total Access viewership followed viewing path (P3) to also watch NFL Football. |
|
End Content Percentage |
The percentage of this total content viewership participating in this content path. For NFL Football, 43% of the total viewership previously watched MLB Baseball, 29% of the viewership previously watched Little League World Series, and 28% of the total viewership previously watched NFL Total Access. As the selected path progression, the end percentages represent 100% of the NFL Football viewers. |
Note: To highlight content affinities, the total percentages of pass-through content and end content represent the traffic associated with only the top 10 content paths, and not all viewership.
Paths Between Content
Hovering on a single path displays viewership data about the content of origin, pass-through content, and end content.
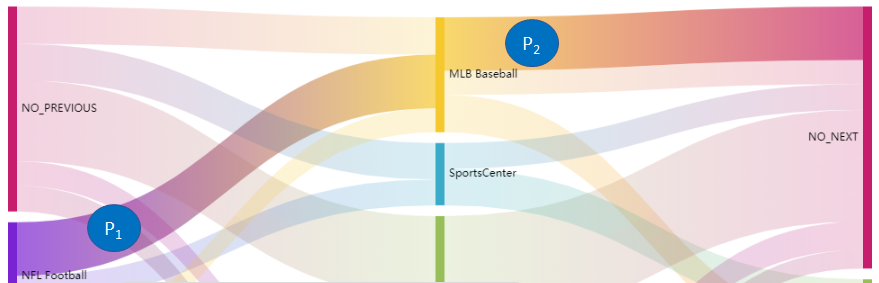
In this example, the highlighted path shows viewers that started watching NFL Football, then watched MLB Baseball, and ended the sitting with no next content.
Hover over a point in the content path to display the pathing details.
|
Path Measurement |
Description |
|---|---|
|
End Content Percentage |
The percentage of this total content viewership participating in this content path. For 20% of the total viewership who watched no next series came from MLB Baseball. |
|
Pass-Through Content Percentage |
The percentage of this total content viewership participating in this content path. For MLB Baseball, 47% of the total viewership of MLB Baseball previously watched NFL Football. As the selected path progression, the pass-through percentages represent 100% of the MLB Baseball viewers. |
|
Content of Origin Percentage |
The percentage of this total content viewership participating in this content path. For NFL Football, 50% of the total NFL Football viewership followed viewing path to also watch MLB Baseball. |
|
Total Plays |
The total number of plays that occurred between the content of origin, pass-through content, and the end content. In this case, 3895 viewers watched NFL Football, then watched MLB Baseball, and then ended the sitting. |
Note: To highlight content affinities, the total percentages of origin content, pass-through content, and end content represent the traffic associated with only the top 10 content paths, and not all viewership.