
Audience Basics
Audience helps leading streaming businesses build their audiences through advertising. Audience encapsulates the robustness of content analysis features.
Using Audience, you can monitor and measure household content consumption and viewership metrics so you can proactively analyze and respond to content drivers that create the most impact. Content and viewership data is also presented in multiple high-level dashboards so you can easily navigate to the most important data areas, such as content, device, pathing, and segment.
In addition to the overview dashboards, each dashboards enables drill-downs into more detailed data analysis, such as series drill-down to lead-in/lead-out and content pages, audience drill-down to unique viewers page, and device drill-down to device subtype page.
Audience provides overview pages so you can quickly analyze Series, Episode, and Affiliate performance, and also drill-down for detail analysis.
- Series contains a collection of all the shows (episodes) of a streaming video show. For example, the series of the The Big Bang Theory contains 275 episodes, which streamed over approximately 12 seasons. See Series Overview Dashboard.
- Episode is a single show within a series, typically streamed in a daily or weekly sequence of other episodes, such as The Excelsior Acquisition, which was episode 18 in the series of The Big Bang Theory. See Episode Overview Dashboard.
- Affiliate is an independent provider streams video from a media publisher, but is not owned by the publisher. See Affiliate Overview Dashboard.
For a complete list of the supported dashboards, see Audience Dashboards.
Note: To display data from the previous day, Audience starts generating data at 12:00 a.m. in your account's local time zone on the next day and completes data generation within 6 hours, depending on the volume of data received.
The Audience mutable metadata feature enables more precise data analysis of viewers with live program changes. With this feature, Audience tracks program changes when viewers watch different programs within the same session, so you can monitor continuous engagement associated with multiple programs. Mutable metadata supports data for up to 20 days prior to feature activation date. For more information regarding the mutable metadata feature, contact your Conviva representative.
Structure and Navigation
Audience displays content and viewership data in a series of high-level overview dashboards and drill-down pages.
| Dashboards | Widgets/Drill-Downs |
|---|---|
| Overview |
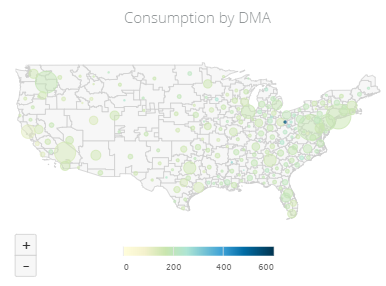
Total Unique Viewers Metric Widget: Unique Viewers page KPIs Over Time Widgets: Timestamp Time page, Audience Over Timestamp Time page Widgets: Unique Viewers page, Consumption by DMA Widget: DMA specific page Unique Devices Widget: Device specific page Plays by DayPart and Day of The Week Widget: DayPart Detail page |
| Content | |
| Series Overview |
Audience Over Time by Asset Category Widgets: Lead-in/Lead-out page, Content page Consumption by DMA Widget: DMA specific page Top Content By Engagement and Plays Widget: Device specific page Plays by DayPart and Day of The Week Widget: DayPart Detail page Content List---Series Name Widgets: Lead-in/Lead-out page, Content page, Lead-in/Lead-out page, Content page |
| Channel Overview |
Viewership over Time Widget: Day Part and Time page, Channel page Viewership by Channel Widgets: Day Part and Time page, Channel page Top Episodes Of Plays and Engagement Widgets: Lead-in/Lead-out page, Channel page Top Content Widgets: Channel page, Unique Viewers page |
| Episode Overview |
Viewership over Time Widgets: Day Part and Time page, Channel page Viewership by Video Type Widgets: Day Part and Time page, Channel page Top Episodes Of Plays and Engagement Widgets: Lead-in/Lead-out page, Channel page Top Episodes Widgets: Episode page name, Lead-in/Lead-out page, Channel page, Unique Viewers page |
| Affiliate Overview |
Viewership over Time Widgets: Day Part and Time page, Channel page Viewership by Affiliate Widgets: Day Part and Time page, Affiliate page Top Affiliate by Plays and Engagement Widgets: Lead-in/Lead-out page, Channel page Top Affiliates Widgets: Affiliates page, Unique Viewers page |
| Device | |
| Device |
Content Plays by Device Type Widget: Device page Devices by Viewership and Engagement Widget: Device page Devices. Widgets: Device page, Unique Viewers page Devices over Time Widgets: By Timestamp Time Device page, Unique Viewers page |
| Pathing | |
| Series Pathing |
No drill downs. |
| Channel Pathing | No drill downs. |
| Episode Pathing | No drill downs. |
| Segment | |
| Viewer Acquisition |
Widgets: Cohort settings, New Viewers, Line graph, Bar graph. Drill-downs: Overview Dashboard, Viewer Retention page. Note: This page does not support creating of segments. |
| Viewer Retention |
Widgets: Total Viewer Retention, Viewer Retention by Cohort, Customize Cohorts, Active Viewers. Note: This page does not support creating of segments. |
| Segment Overview Dashboard |
Segment Name Widget: Segment page |
| Segment Management Dashboard | No drill-downs. |
| Analytics Workbench | |
| Analytics Workbench | No drill-downs. |
Overview Dashboards
The Overview dashboards provide high-level overviews of key data areas (overall viewership, series, channel, episode, affiliate, segment, and device) and contain sections that combine data visualizations with filtering / segment options to provide a variety of viewership, content analysis, and data correlations.
Interval Settings
The default interval is the Last 7 Days. Click the Interval drop-down to select an interval. The complete interval options include:
- Yesterday.
- Last 7 Days.
- Last Week.
- Last 30 Days.
- Last Month.
- Custom.
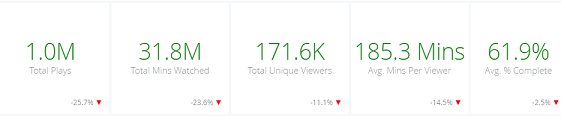
The Comparison options include similar intervals so you can also customize the comparison period. The results of the period comparisons appear as percentage values under each metric.
Filters
You can use these filters to get granular data based on, for example, demographics and the type of content that is consumed by your viewers. For example, you can perform analysis based on a segment of viewers and the genre of content. The filters are global, and the selected dimensions are carried across all the pages in Audience.
You can also analyze data on the concept of 'First Stream'. First Stream refers to the first video session streamed by a new viewer. When you apply a first stream attribute to your analysis, the resultant data consists of all the information related to how the new viewer consumed the content, including:
- When: date / day / day-part
- What: series / episode / genre / category
- How: screen type / device type
- Where: country / state / DMA
- Who: viewer ID
- Ad dimensions
- Demographic data
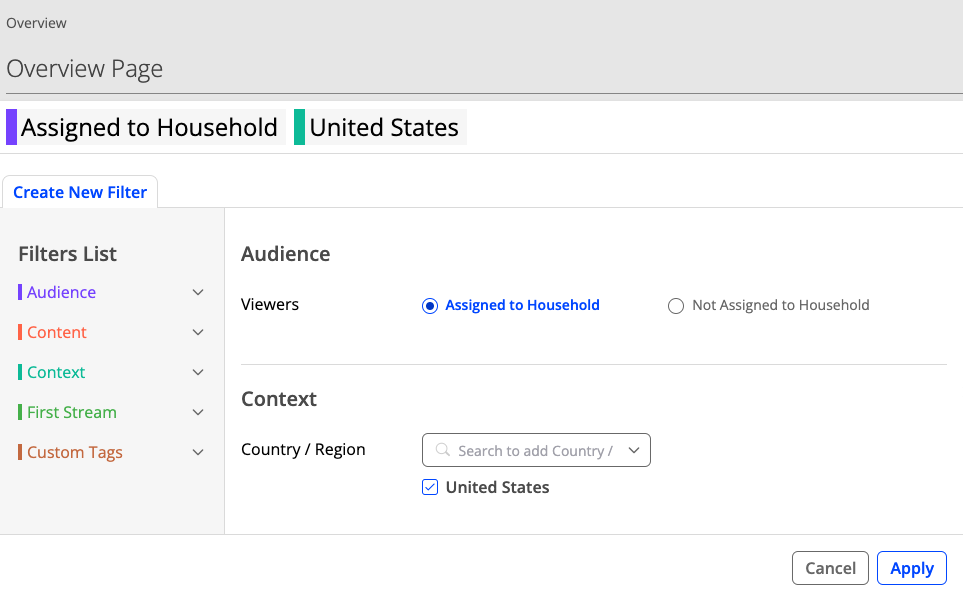
For more information, refer to Filters and Segements and Using Filters.
Segments
Segments create collections of viewers based on viewing behaviors, to help you analyze viewership based on custom viewer groups. Options for behavioral viewer segmentation include consumed content, consumption attributes, specific behaviors, and custom attributes, along with OR logic rules.
The Segment Audience shown during segment creation defines the percent of unique viewers and the percent of total sessions in a given period selected based on the segment settings.
For more details about segments, see Audience Segments.
Viewership metrics
Each overview dashboard displays viewership metrics with metric values for the current interval along with a comparison percentage that indicates the change in the metric value from the current interval to the comparison interval. By default, the comparison period matched the current interval.
Data Visualizations
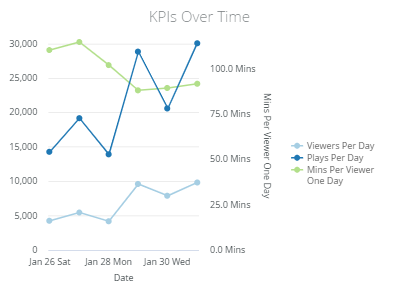
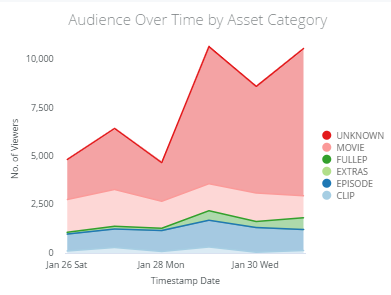
Each overview dashboard also contains a number of data visualization charts that present related data for comparison and analysis.
Mouse over any data point in a data chart to display the data details. You can also click a metric name to toggle the display of that metric.
Many data charts also support clicking a data point to drill-down to more detailed data. For example, clicking a data point on the Content Plays by Device Type, displays a link to the Device Drill-Down page for detailed device viewership and analysis.
For more details about drill-downs, see the Drill-down section.
Drill-Down Pages
Most metrics and data points in the Overview dashboards provide drill-down access to display data by timestamp and/or access a detailed analysis page. Drill-downs provide important navigation aids to guide you from top-level data to more detailed data analysis related to a specific data point. To enable the detailed analysis, each drill-down applies a filter for the selected data point. Filters persists through multiple drill-down levels providing an easy navigation page to customized
For example, clicking the Total Unique Viewers metric in the Overview page provides access to the Unique Viewers page for all viewers, while clicking the Total Unique Viewers metric in a Content page applies a content filter and displays the Unique Viewers page for only that content.
Segments
Segments function as differentiated viewer groups that help you categorize and analyze data based on different levels content and viewer activity, for example loyal viewers, occasional viewers, and infrequent viewers.
There are three kinds of data segmentation and data sets:
- Viewer based segments (segment-based basic and complex data sets by viewer attribute matching)
- Joined segments (viewer selection based on the intersection of different segments)
- Session based data sets (filter-based session criteria only)
For more details and examples of segmentation, see Filters and Segments and Complex Segments.
A built-in set of advanced behavioral segments is provided to enable a better understanding of your viewers behavior and viewership impacts. For a detailed description of these segments, see Audience Segments.
You can also create additional segments based on customized viewer behaviors. Options for creating viewer behavioral segmentation include consumed content, consumption attributes, specific viewing behaviors, and custom attributes. You can also use OR logic rules to combined specific viewer behavior settings to build your own customized behavior segments.
Segments are viewer-based and identify a set of viewers based on a specific set of attributes of the viewers, for example people who watched a given episode, in a particular DMA, on a particular device. Because the segments are viewer-based, the data set is inclusive of the viewer consumption. As a result, the viewer data also includes data for consumption outside of the prescribed set attributes (episode, DMA, and device in this example).
Ad impact based on ad metrics, such as ad impressions, and ad dimensions can also be applied to segments.
Creating a Segment
To create a segment, click Create Segment and choose one of the following options:
-
Click Create a new segment to select the filters and create a segment.
-
Click Save filters as a segment to create a segment from the current set of applied filters.
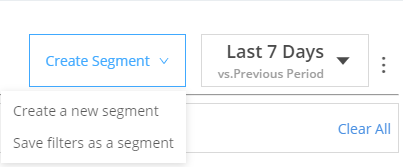
You can also create a segment and apply as a filter which ensures that you can perform a drill-down from any streaming widget to the detailed page, such as Device Overview, with the specified filter settings applied seamlessly. For more information about applying a segment as a filter, see the .
For details about creating joined and complex segments, see Complex Segments.
- To set a one-time static time range selection, use the time range selector to specify a global time period as a one-time static time range or a rolling time range that updates daily. In the Behavior tab, you can also specify behavior-based time ranges and dynamic intervals, such as First Watched, Last Watched, and In the Past x Days.
-
Rolling time ranges can be useful to track and compare segment behavior over periodic intervals, such as monitoring the loyalty of viewers of a previous segment, such as Game of Thrones viewers, to determine which assets they continue to watch each week. Another example can be to monitor a segment of trial viewers to determine monthly conversion rates.
For more details about segment management, see Segment Management.
Dimensions
Dimensions are attributes of your data that are used to categorize and correlate your data. For example, the daypart dimension is often applied to a data set to correlate viewer activities with the time of day, for example, which devices are most commonly used by late night watchers. Dimensions require sensor data that is defined during player integration.
The following dimensions are supported:
- Geo-location: Conviva uses IP lookup services such as Quova and Maxmind to identify the geo-location of viewers.
-
Time attribution: Conviva uses actual time of play to attribute metrics to specific hours etc. When a content extends across multiple hours or days only the section of play belonging to that particular time period is counted.
- Content Day Part (local time): Conviva uses Nielsen day parts to classify viewer behavior based on time of day. Users' local time zone is used to normalize the data.
- DMA/Region: Conviva uses Nielsen DMA definition. See: https://www.nielsen.com/us/en/contact-us/intl-campaigns/dma-maps/.
-
Device Category: Conviva uses a high-level classification of devices based on these common business categories:
- Web: Any desktop-based consumption including MacOS, Windows.
- Mobile: Devices including Android based phones and iPhone devices.
- Connected Device: Large screen devices includes TVs (Samsung, LG) as well as set top boxes such as AppleTV, Android TV, FireTV, Chromecast, Roku etc.
- Tablet: Tablet device including IPAD and Android devices including Fire Tablet.
- Device: Provides the type of device used, for example Apple TV, Android TV, Roku, Amazon Fire TV, and Apple iPhone.
- Device Marketing Name: Provides the name of the device, for example Roku3000, iPhone 7, and iPhone 8.
- Connection Type: Describes the type of connection used: mobile, wired, wireless.
-
Content Hour (local time): The hour interval within which the content started based on device local time, ranging from 0 to 23. For example, a value of 3 means that the content started between 3 a.m. and 4 a.m. based on the device’s local time.
- Content Start Time (local time): The time, in local time zone, when viewers started watching content. It accepts integer and decimal values. To convert decimal value to minutes, multiply the decimal value by 60. For example, 8.3 converts to 8:18 AM.
- Session Percent Complete: The percentage of the session watched, computed as "Session Duration" divided by “Content Length”. For example, 0.1 for 10 percent complete for a single session.
Demographic Widgets
The Demographic widgets empower optimal audience targeting through Audience viewership data, customized through Audience filters and segments.
These widgets include data breakouts for residential demographics (gender, age, education level, and others) and household demographics (income, household size, parental status, and others), to help you identify and understand the key audience characteristics of your viewership.
For example, the household widget displays viewership household income levels along with other data such as household size and ownership status.
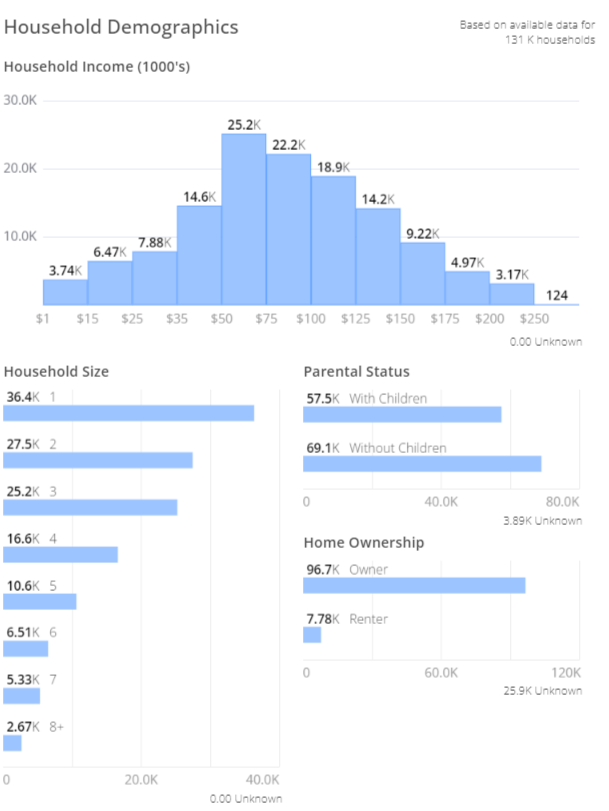
For more information, refer to Demographic Widgets.
Ad Placement Performance and Demographics
To help track and determine the overall effectiveness of the delivered ad placements, Audience provides Ads and Ad Details dashboards with a list of ad placements (line items) delivered in the selected period along with the corresponding metadata, such as advertiser and campaign, and metrics, such as household reach, ad impressions, and average frequency. The Ads Dashboard helps you quickly determine the overall effectiveness of the delivered ad placements. The Ad Detail dashboard displays a high-level view of your ad's reach, frequency, and impression delivery across device, content, and audience demographics
In addition, the Ad Impressions metric appears in most dashboards to display the sum of ad sessions that successfully started in the selected interval to help correlate viewership and ad performance.

You can also create filters and segments based on sessions with or without ads, along with ad dimensions. Ad impact based on ad metrics, such as ad impressions, and ad dimensions can also be applied to segments. For more details, see Filters and Segments. For more details about advertising capabilities, see Advertising Capabilities.
Sitting
Sitting is an aggregate of all content played by a viewer in succession with no more than 60 minutes (configurable) break between each content played. Sittings are separated by daily, 24-hour boundaries; playing content continuously across a day boundary is considered as 2 sittings. For more information, see Sitting.
Pathing
Pathing helps you analyze engagement across your most frequently viewed content and quickly understand high-level content affinities. Audience monitors which content path were most frequently used in the selected period, and displays the top 10 viewing paths between the content. A Path is a sequence of up to three, continuously watched content within a single sitting. Sitting is an aggregate of all content played by a viewer in succession with no more than 60 minutes (configurable) break between each content played.
You can use pathing to:
-
Monitor your most engaging content paths to discover which 'lighthouse' assets increase viewership.
- Identify content affinities to build engaging viewership flows to promote continuous viewing.
-
Quickly determine which assets can lead to higher pass-through and fewer drop-offs.
For more details about pathing analysis, see Pathing.
Intervals
Audience supports up to 15 months of data. All dates and times are based on the single time zone setting for your account. This means that if your account is set to Eastern Standard Time and you're in California, you will still see all data based on the Eastern Standard Time. The time zone setting for your account, in UTC designation, appears on each page in the Pulse menu bar.
Audience supports standard intervals for Yesterday, Last week, Last 7 Days, Last Month, Last 30 Days, and custom date ranges. Use the Time Period selection to apply a standard or custom time period to the display and comparison intervals. The display and comparison intervals can be set to different periods, for example display the last 30 days and compare this period with any previous 30 days for month over month analysis.
Reach Across Multiple Identity Levels
The unique viewer reach level is displayed in the KPI bar across multiple identity levels:
-
App Count – count of unique client IDs (this is automatically assigned by the sensor and will change when the app is reinstalled)
-
Subscribers – count of unique viewer IDs (requires customer to pass in an appropriate viewer ID)
Note: In Conviva, Subscribers is a default label for the viewer ID level metrics as well as for the viewer ID identity level. You can contact your Conviva representative to rename the default label.
-
Households – count of unique household IDs (requires Audience Module add-on)
Note: Households often have multiple attributes, and it is possible to identify the same household using different attributes. As a result, some household data may overlap. For example, many of the same households may be obtained when using filters for age ranges greater than 18, and less than or equal to 18 because households have members from both age ranges. Additionally, when combining two separate groups of households, the combined total may not reach 100% of the separate household groups due to the variation of demographic attributes across households.

These identity metrics appear in the Overview page and other detail pages, such as Series and Channel detail pages.
For more details using the household ID, see Household ID White Paper.
Data Export
Depending on you analysis needs, you might want to export the data from a dashboard or another page for use elsewhere in .CSV or PDF format. It's easy to do: just click the options or settings icon at the top of the data area and select the download option. The download file can be a PDF file for controlled viewing or a comma-separated text file that you can import into a spreadsheet or analysis application.
Data Sharing
You can share snapshots of dashboards and widgets with other Audience users.
To share a dashboard, click the gear button. The data output options appear for the page.
When a user opens the link and logs in, they see an exact copy of the item you sent. They can change how the data is presented in the snapshot. For example, the user can deselect metrics to hide them, but they can't change the dimension or time series.
Data Customization
The Analytics Workbench enables users to build customized visualizations and reports, based on filter settings and a selected set of dimension and metric measurements.
In Analytics Workbench, dimensions represent the data categories for which data is displayed in the Data Table. Metrics represent the data measures applied to the dimensions that also appear in the Data Table. Users can customize the data based on the selected measurement metrics and dimensions. Custom visualization options change how the data is displayed, for example bar char, line chart, and KPI chart. The Analytics Workbench also supports advanced features, such as spreadsheet-like data formulas and segmentation pivots.
For more details, see the Analytics Workbench Dashboard.
Viewer Acquisition
Viewer Acquisition enables streaming content publishers to dwell deeper into analyzing viewer acquisition patterns to better understand the factors that drive new viewer engagement. The Viewer Acquisition widgets provide analysis across dimensional attributes that are best viewed in a time series, such as screen type, content category, genre, and other attributes in bar charts that drive the acquisition of new viewers, such as country, series, and channel.
From Viewer Acquisition, you can drill-down to Viewer Retention and seamlessly track a particular cohort’s performance through acquisition, retention, and other KPIs related to content consumption.
For more details, see Viewer Acquisition.
Viewer Retention
Viewer Retention enables streaming content publishers to gain more insights into viewer retention and engagement patterns and better understand content performance to optimize viewer retention strategies. Based on the specified cohort settings and retention time frame, this page displays cohort and viewership data arranged by the selected cohort size , active user summary (new and existing), and retention breakout across the retention period.
For more details, see Viewer Retention.