
Viewer Retention
Viewer Retention enables streaming content publishers to analyze viewer retention and engagement patterns to better understand content performance and optimize viewer retention strategies. For example, Marketing teams can discover which promotions had the highest impact on viewership along with opportunities to further promote under-performing content with declining viewership.
The dashboard consists of these widgets:
-
Total identity level Retention
-
Identity level Retention by Cohort
-
Active identity level
-
Customize Cohorts
-
Filter
Note: The identity level specifies the type of displayed data, as Subscriber, Household, or App.
You can toggle the identity level to focus your analysis, such as an overview of household viewing patterns, subscriber retentions, and retention behaviors.
Toggling between subscriber and household identity levels is available only after Conviva enables stream ID and the client ID is not selected as the subscriber ID.
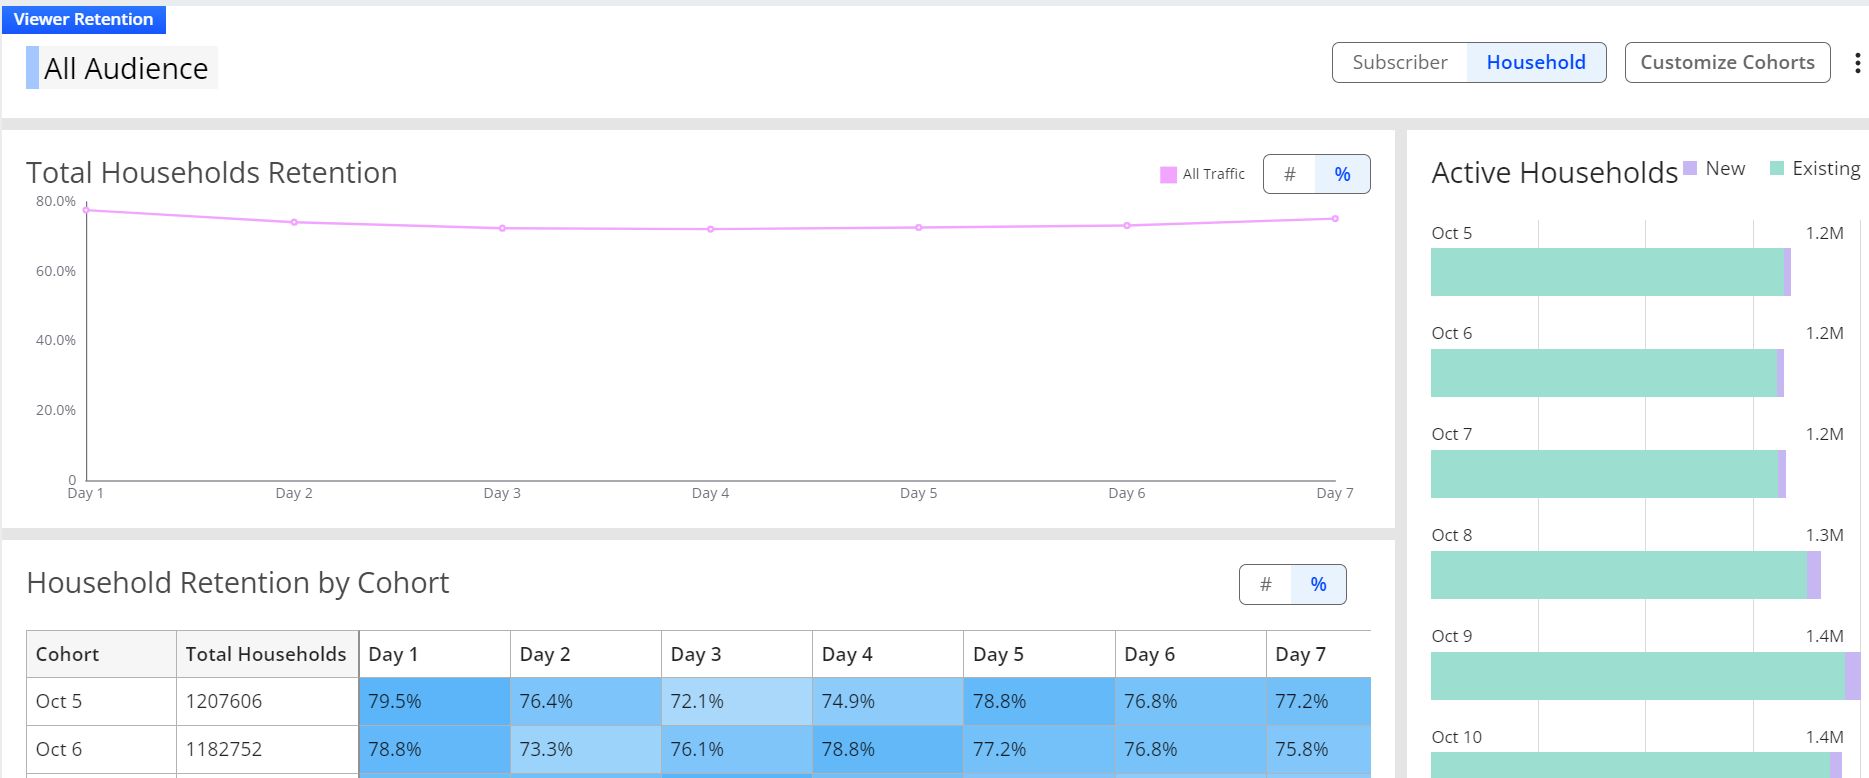
Note: Based on the specified cohort settings and retention time frame, this page displays cohort and viewership data arranged by the selected cohort size , active user summary (new and existing), and retention breakout across the retention period. By default, Viewer Retention displays active viewers and retention data for the last 7 days.
Note: You can drill-down to this page from the Viewer Acquisition page to track user growth, engagement, and retention analytics. For more information, see Viewer Acquisition.
Viewer Retention Widgets
Viewer Retention displays the retention rate and cohort data in the following widgets:
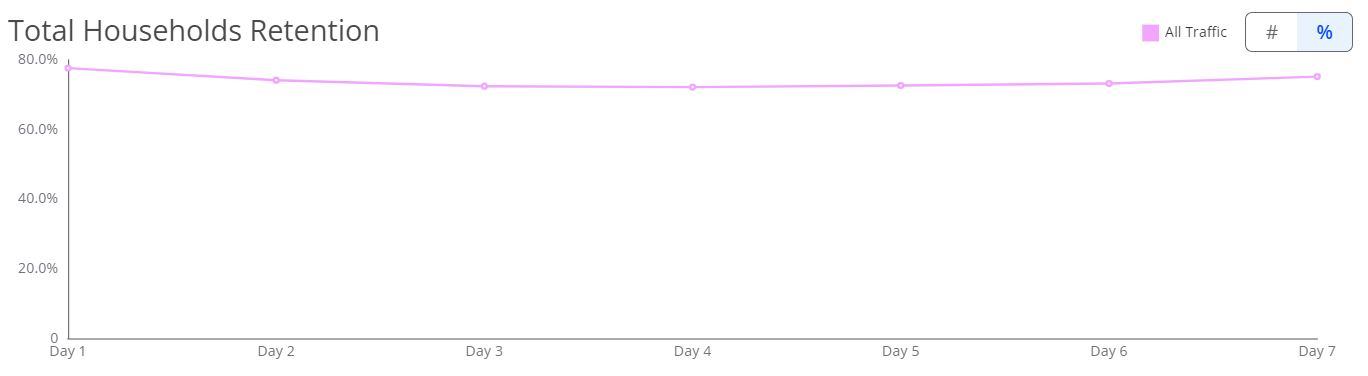
- Total identity level Retention: This widget displays the count or percentage of total identity level in a trend line that shows the summary of the overall retention rates across all the cohorts for a selected time period. In the following example, the widget displays a 7-day trend.
- Identity level Retention by Cohort: This widget displays the following data points:
Data Point Description Cohort The cohort size selected in the Customize Cohorts widget.
A cohort is viewers grouped according to their first stream during the same retention period.
Total identity level The total number of active identity level(new + existing) for the corresponding cohort column. Retention breakout by Day # / Week # / Month # The breakout of the specified period according to the cohort size. For each period within the retention breakout, the columns shows the number of identity level who returned and engaged with the platform during the breakout period.
Total The total number of identity level for the retention breakout along with the overall total viewers.
The Total identity level Retention widget uses the data from this row to generate the graph.
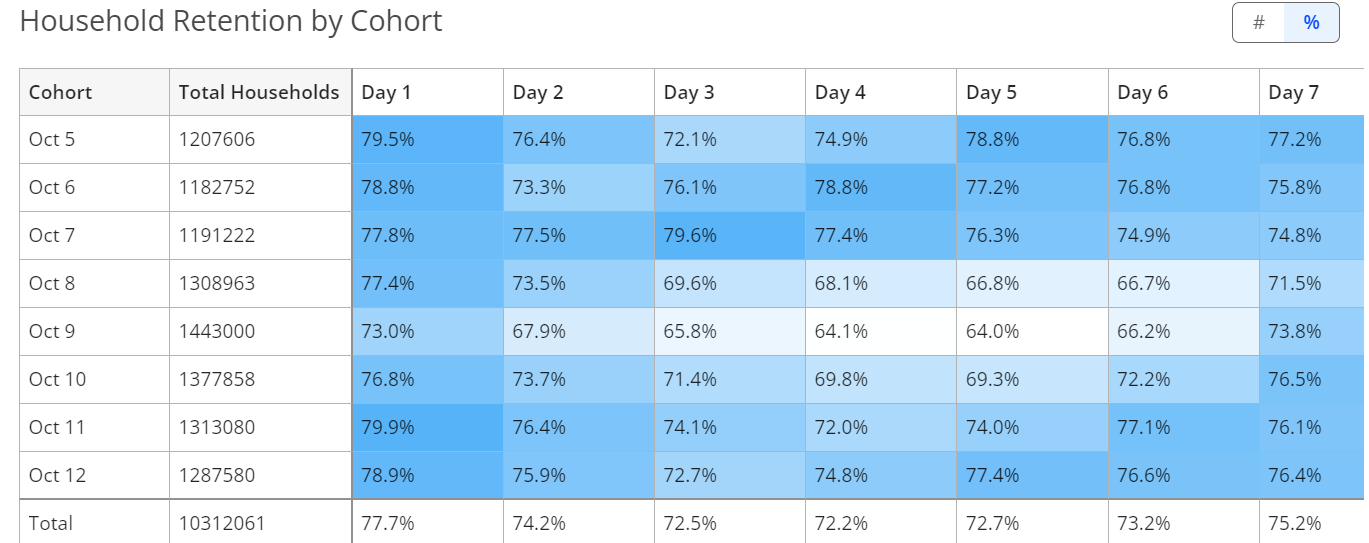
Darker shading highlights the cohorts that have a higher retention rate.
-
Active identity level: This widget displays the total number of identity level broken up by new and existing identity level for each cohort.
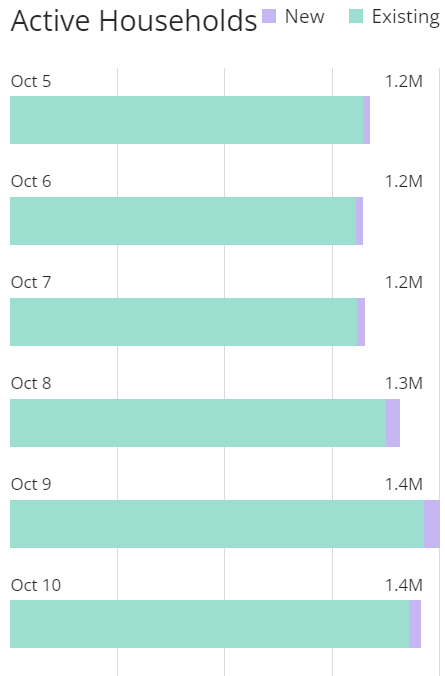
New identity level are the identity level who streamed on the streaming platform for the first time during the selected breakout period.
-
Customize Cohorts: This widget allows you to define the cohorts that you want to perform analysis on.
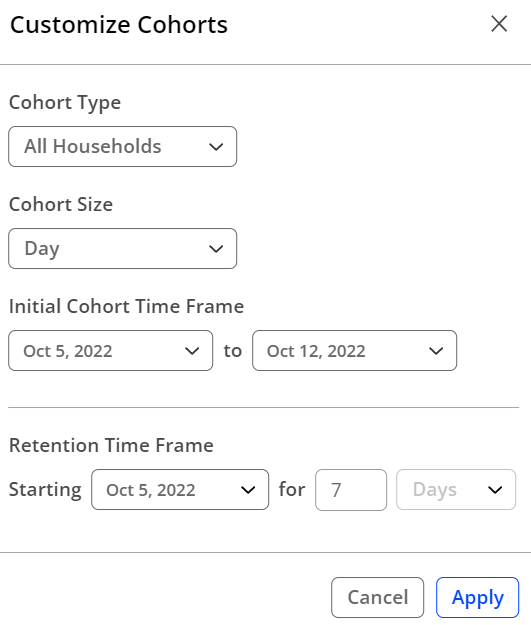
Field Description Cohort Type Select the identity level group that you want to analyze.
- All identity level - the total number of identity level who engaged with the platform.
- New identity level - the identity level who streamed on the platform for the first time.
- Existing identity level - the identity level who continued to engage with the platform after streaming for the first time.
Cohort Size Select the granularity by which you want to analyze your identity level.
- Day
- Week
- Month
For more information on how the cohort size impacts your output data, see examples for cohort size.
Initial Cohort Time Frame Select the time range for the cohort.
This is the time period that is used to group viewers into cohorts.
Note: You can create a maximum of 30 cohorts at a time. The number of cohorts is determined by the values you choose for the Initial Cohort Time Frame and Cohort Size fields.
Retention Time Frame Select the time period to determine the duration of the retention rate you want to track based on the granularity selected in the Cohort Size widget.
-
Filter: Use the filter to select dimensions that allow you to narrow your focus to only include those video sessions that match certain attributes. For example, you can perform retention analysis based on a segment of viewers and the genre of content. For more information, see Using Filters.
Cohort Size
For a daily cohort breakout, the first day of retention breakout is the following day of the selected cohort. For example, day 1 of analysis for Jan 7 daily cohort is Jan 8, day 2 of analysis is Jan 9.
For a weekly cohort breakout, the first week of retention breakout is the following week of the selected cohort. For example, week 1 of analysis for Jan 3 - 8 weekly cohort is Jan 9 -15, week 2 of analysis is Jan 15 - 22.
Note: The configuration of your c3 account determines the start day of the week (Sunday or Monday).
Working with Viewer Retention
To access Viewer Retention, from the Audience application menu, click Viewers and then click Viewer Retention.
By default, this page displays:
- Number of active viewers for the last 7 days.
- Retention data for the next 7 days.
- To access Viewer Retention, from the Audience application menu, click Viewers and then click Viewer Retention.
The default view displays the active viewers in the last 7 days, the Cohort Size as Day, and display the retention data for the next 7 days.
-
Click Customize Cohorts to define your cohort settings.
-
After selecting the desired cohort options, click Apply.
Viewer Retention refreshes to display the resultant data.
-
Optional. To ingest the Viewer Retention dashboard data into other systems, such as marketing tools, or share the data with other stakeholders, click Download from the kebab icon to download the Viewer Retention dashboard data.
-
Optional. To share the Viewer Retention dashboard page data with others, click Copy Link from the kebab icon and share the link to the page with others. Users who has access to Audience can double-click the shared link to view the Viewer Retention dashboard with the same data.
The Total Retention and Viewer Retention by Cohort widgets display the output as follows:
To analyze the table correctly, we make the following assumptions:
- There are two new viewers, Viewer A and Viewer B.
- Viewer A’s first stream was on February 2 and the second stream was on February 5.
- Viewer B’s first stream was on February 3 and the second stream was on February 5.
Based on the input cohort settings and the assumptions, we can analyze that Viewer A will be included in the February 2 cohort and Day 3 cohort, and Viewer B will be included in the February 3 cohort and Day 3 cohort.
Every cell in the table represents a cohort.
Sharing Viewer Retention Analysis
You can share retention data for further analysis and collaborate with other Audience users by manually sharing the link to the display page. Click the kebab menu next to Customize Cohorts, and click Copy Link.
To access the link, the receiver of the link must have access to the c3 account.
Use Case
As a Content Marketer for a streaming platform that is about to launch a new series by releasing one episode per day, you want the following insights:
- The impact of the show in driving households growth
- The number of new households that come back after streaming the first episode
- The next day and 7-days retention analysis
Assumption: You have created a filter with the name of the series "The Good Men".
To perform the analysis, configure the cohort settings with the following values:
- In the dashboard filter, select Series Name = The Good Men
- Cohort Type = New households
- Cohort Size = Day
- Initial Cohort Time Frame = January 7 to January 14
- Retention Time Frame = Starting from Jan 7 for 7 days
Households Retention displays the output:
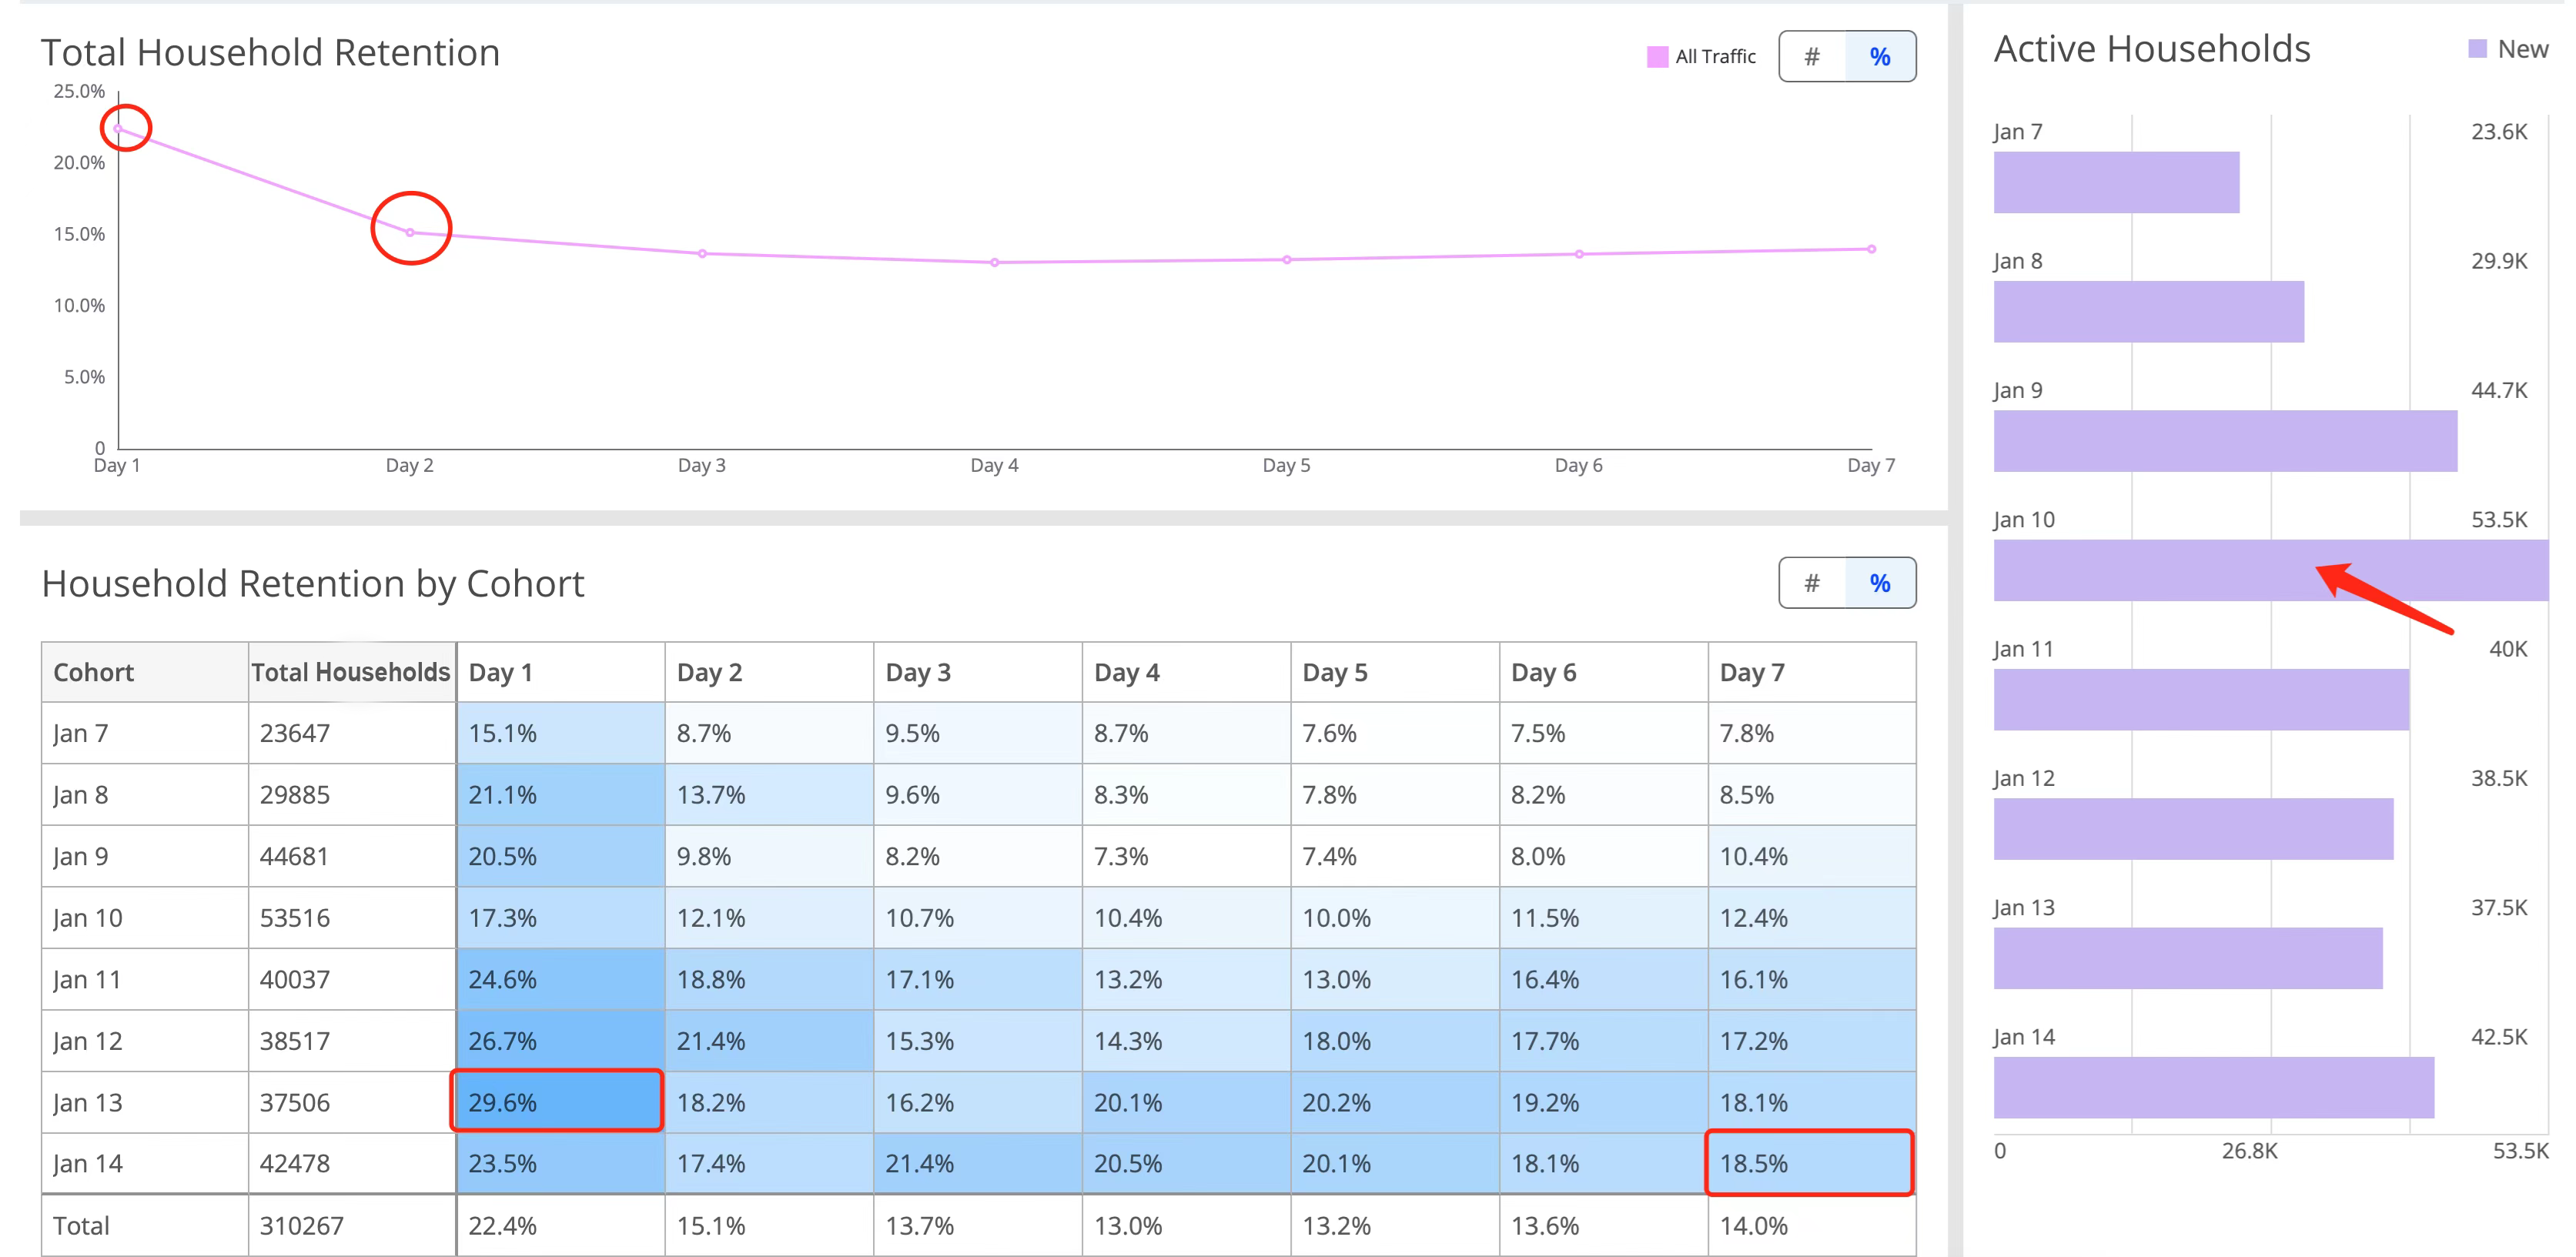
- To determine the households growth, the Active Households widget displays the number of new households that this series has attracted based on the Cohort Type = New Households . You can also identify the day when your streaming platform attracted the most number of households, which is, Jan 10.
- To determine the optimal time to reach out to households, by analyzing the trend line in the Total Household Retention widget, you can identify the critical point where the retention rate starts dropping significantly.
As the sample data reveals:
- Day 1 thru day 2 is the best time to engage households because the trend line remains almost flat after day 2.
- Jan 13 cohort has the highest retention rate of day, which is Jan 14.
- To determine the number of returning households, in the Household Retention by Cohort widget, the table displays a daily analysis of new households who continued to stream. The sample data reveals that there are two important retention periods:
- For the next day retention analysis, Jan 13 cohort shows the highest next day retention rate of 29.6%
- For the 7-day retention analysis, Jan 14 cohort shows the highest 7-day retention of 18.5%.