Episode Pathing Dashboard
A Path is a sequence of up to three, continuously watched content within a single sitting. For more information, see Sitting.
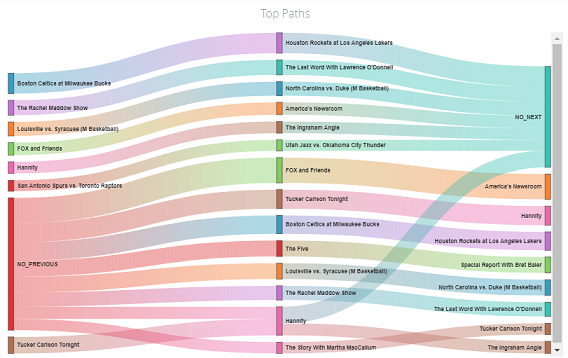
The Episode Pathing dashboard illustrates the episode paths used by your viewers so you can quickly gain insights into which episodes lead to episode pass-throughs or drop-offs, discover affinities between content and episode viewing, and determine which episodes promoted 'lighthouse' assets that increased viewership. You can also monitor the pathing decisions across episodes for the selected viewer segment.
This dashboard contains the following data areas:
Interval and Filter Settings
The default interval is Last 7 Days. Click the drop-down to customize the intervals for the current interval and the comparison interval. See Intervals for more details.
The filter bar shows the current filter settings and the Create Segment button.
Filters
You can use the filters on every page of Audience to select dimensions that allow you to narrow your focus to include video sessions that match certain attributes. For more information, see Using Filters.
Top Paths
The color-coded paths illustrate the episode selection decisions within the selected segment.
- Mouse over paths to display the pathing data between episodes. For example, this sample episode diagram shows that 100% of the viewers continued watching the following episode.
-
Mouse over the episode markers to display the episode pathing.