Device Overview Dashboard
The Device Overview dashboard displays a high-level view of the consumption on your supported devices. This data enables quick insights into consumption breakouts and patterns across device types, and device popularity; and helps you measure the drivers of viewership trends by device type, such as the most widely-used devices for sporting events, and the relative popularity of device types across viewing times, such as day parts.
Based on this analysis, you can also click a metric or data graph to drill-down into more data details. Click the data options to download data from the page or any widget for ingestion into other systems, such as marketing tools or sharing with other stakeholders.
This dashboard contains the following data areas:
Interval settings
The default interval is Last 7 Days. Click the drop-down to customize the intervals for the current interval and the comparison interval. See Intervals for more details.
The filter bar shows the current filter settings and the Create Segment button.
Filters
You can use the filters on every page of Audience to select dimensions that allow you to narrow your focus to include video sessions that match certain attributes. For more information, see Using Filters.
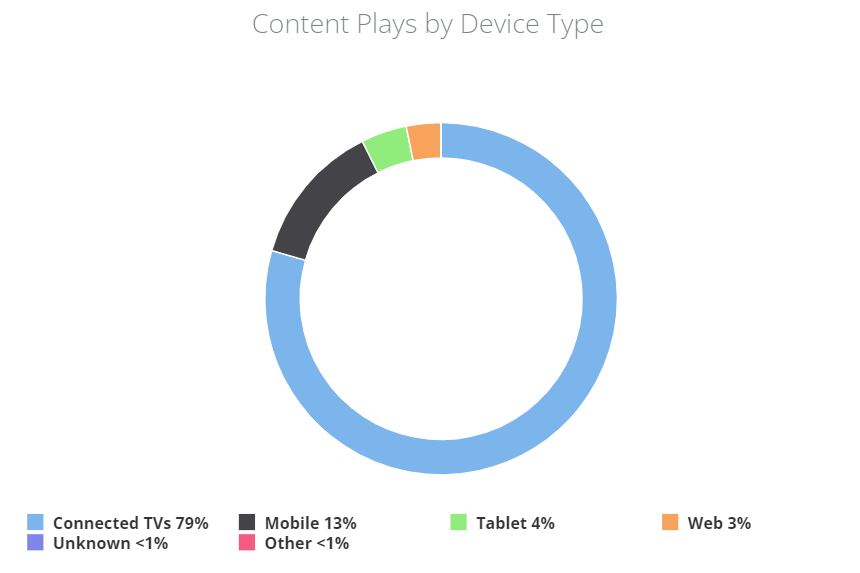
Content Plays by Device Type
This plays chart displays consumption by device type, so you can quickly determine the proportion of usage by each device type. Mouse over any data point to display the data details.
Click a data area and select the option to open the Device page with detailed plays data for that device.
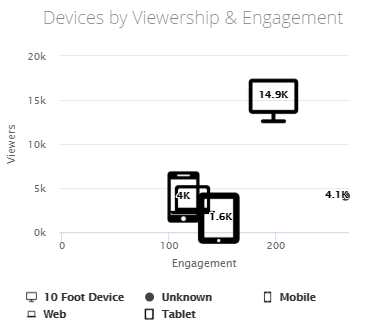
Devices by Viewership and Engagement
This info graphic shows number of the viewers for each device type over the selected interval. Mouse over any data point to display the data details. Click a metric name to toggle the metric display.
For additional analysis, click a device image to launch the Device page for that device type.
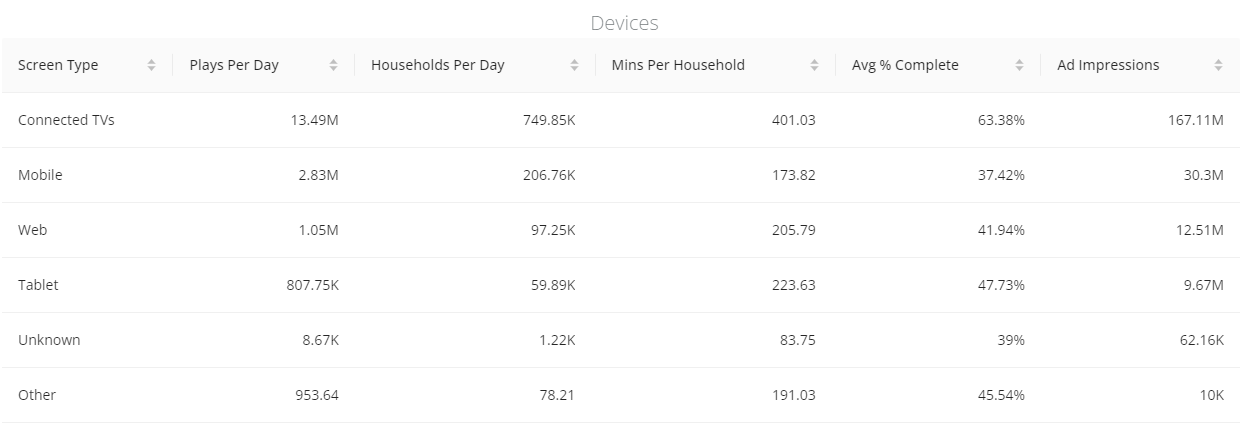
Devices
This device data table shows the device plays and viewership data in the selected interval.
- Click a device to launch the Device page to display detailed analysis for that device type.
- Click a Households Per Day value to access the Unique Viewers analysis page.
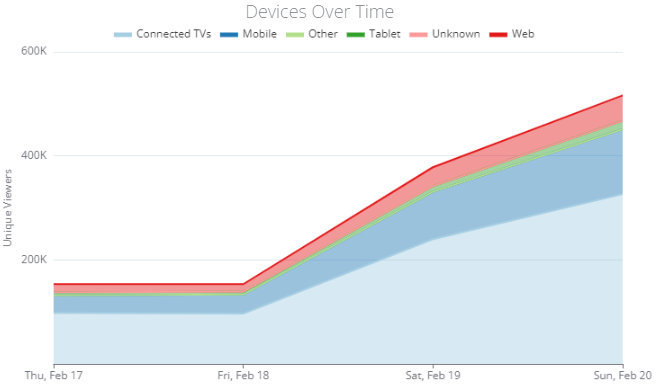
Devices Over Time
This time series shows the device usage trends over the selected interval. Mouse over any data point to display the data details. Click a metric name to toggle the metric display.
Click a time series to access time stamp data for the time series, detailed data for that device type or unique viewers using that device type.