Overview Dashboard
The Overview dashboard displays a high-level view of your content consumption and consumption metrics that enables quick insights into viewership changes, patterns for video consumption, and audience profiles. This data can help you measure the impact of strategic content decisions, such a pricing changes, on viewer consumption as well as monitor consumption trends across time periods, including device, day parts, days of the week, DMA / Region.
Based on this analysis, you can also click a metric or data point in the widgets to drill-down into more data details. Click the data options to download data from the page or any widget for ingestion into other systems, such as marketing tools or sharing with other stakeholders.
Note: You can drill-down to this dashboard from the Viewer Acquisition page to view data about metrics such as total minutes and plays, and to analyze content engagement. For more information, see Viewer Acquisition.
This dashboard contains the following widgets:
Interval Settings
The default interval is Last 7 Days. Click the drop-down to customize the intervals for the current interval and the comparison interval. See Intervals for more details.
The filter bar shows the current filter settings and the Create Segment button.
Filters
You can use the filters on every page of Audience to select dimensions that allow you to narrow your focus to include video sessions that match certain attributes. For more information, see Using Filters.
Viewership Metrics
These viewership metrics display the metric values for the current interval. The percentage below each metric indicates the change in value from the previous interval.
- Click the kebab icon on the top right of each metric tile to download the data for that metric.
-
Click the unique viewer metrics to jump to the Unique Viewers page for detailed viewer analysis. Unique viewers are shown across multiple identity levels:
-
App Count – count of unique client IDs (this is automatically assigned by the sensor and will change when the app is reinstalled)
-
Subscribers – count of unique subscriber IDs (requires customer to pass in an appropriate subscriber ID)
-
Households – count of unique household IDs (requires Audience Module add-on)

-
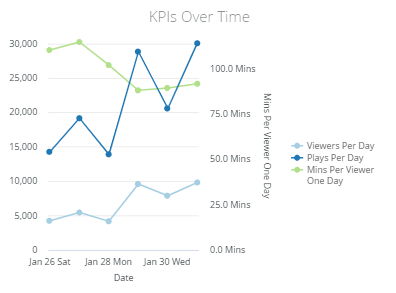
KPIs Over Time
These KPIs show time series of the viewers, plays, and minutes per viewer over the selected interval. Mouse over any data point to display the data details.
- Click a metric name to toggle the metric display.
-
Click a data point on the timeline to analyze the related data by timestamp. The Viewers Per Day timeline also jumps to the Unique Viewers page for detailed viewer analysis.
Demographic Widgets
The Demographic widget empowers optimal audience targeting through Audience viewership data, customized through Audience filters and segments.
For more information, refer Demographic Widgets.
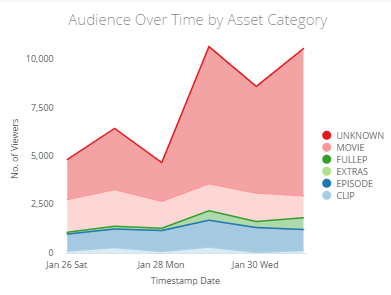
Audience Over Time by Asset Category
These asset category time series of the number of viewers for each asset type in the selected interval.
- Mouse over any data point to display the data details.
-
Click an asset name to toggle the metric display.
-
Click a data point on the time line to analyze the related data by time stamp. These time lines also jump to the Unique Viewers page for detailed viewer analysis.
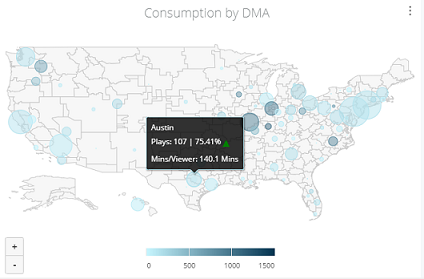
Consumption by DMA
This consumption map shows the color-coded data points that highlights areas with the most viewership (minutes/per viewer) by color and circle size.
- Mouse over any data point to display the data details.
-
Click a metric name to toggle the metric display.
-
Click a data area and select the option to open the detailed consumption data page for that DMA.
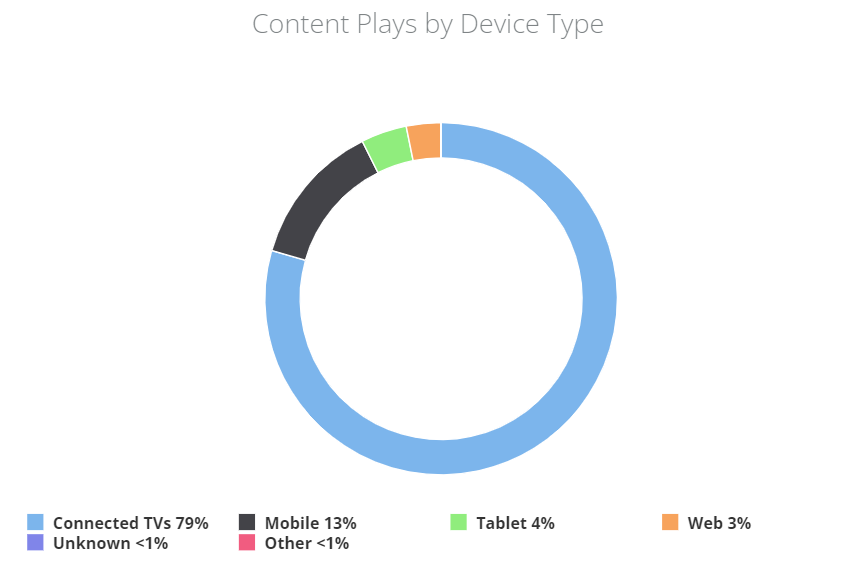
Content Plays by Device Type
This plays chart displays consumption by device type, so you can quickly determine the proportion of usage by each device type.
- Mouse over any data point to display the data details.
-
Click a data area and select the option to open the Device Page with detailed plays data for that device.
Plays by Day Part and Day of the Week
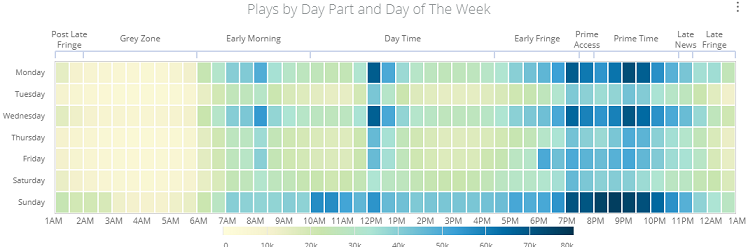
This consumption chart displays consumption data over days and day parts, so you can quickly analyze patterns in the consumption times for the current segment over the last 7 days.
The Day Part feature reports the actual plays in consistent 30 minute intervals based on the start of the play.
The advantages of this feature are:
- Realistic: truly reflects streamers’ viewing behaviors.
- Granular: offers detailed reporting of content consumption and not just time blocks of viewership.
- Hover over any data point to display the data details.
-
Click a data area and select the option to open the Day Part Detail page with detailed consumption data during that period.