
The Social + Streaming dashboard helps you, a leading streaming business, to grow your business through social media and advertising. This dashboard combines the comprehensive social platform coverage of Social and the robust streaming data driven features of Audience.
The Social + Streaming dashboard displays your streaming and social campaigns in one executive-level view:
View the platforms and content that drove viewership and engagement.
Measure audience demographic and behavioral data.
Determine the content that was viewed across social platforms, devices, and locations.
Drill-down by content consumption, viewing behavior, demographics, and more.
Some of the key points that the Social + Streaming dashboard helps you to analyze about your audience composition, data comparison, and content consumption are:
| Total Audience | Trends and Comparisons | Factors Driving Consumption |
|---|---|---|
| Which audience demographics (age / gender groups) are consuming content? ** Are there differences between social and apps? | Which social platforms and profiles are driving the most viewership or engagement? | Which content had the biggest pull of viewers into my apps? |
| Where geographically is my audience coming from? | What is the engagement correlation between my audience and my apps and social platforms? | Which activities had the biggest impact in bringing me viewers? (social media posts, new releases, ads, in-app messaging, email messages, push notifications, etc.) |
| What is my total audience across my streaming apps (O&O) and social media (viewers, views, engagement)? | Where is my audience coming from? - Apps vs social media? - Which apps are driving the most audience? | What is driving viewership in each of these segments (apps, social platforms, social profiles, etc.)? - What are the shifts in viewership? |
Widgets and Data | Dashboard Filter |Viewer Drill-Down | Exporting Data | Customizing Dashboard Widgets |Key Questions |
Widgets and Data
The widgets and data in the Social + Streaming dashboard display easy-to-analyze time series and data trends in social and streaming content consumption and key consumption metrics, along with the comparative percentages that empower a wide scope of analysis across your social and streaming content consumption and key consumption metrics.
A summary of the key KPI metrics is displayed for the selected period, along with the change in percentage for the period you are comparing the data to. The KPI metrics are categorized into Social and Streaming.

For more information about Social metrics, refer to Social .

For more information about Streaming metrics, refer to Audience Metrics.
The following widgets display the analysis of your streaming and social engagements:
Social vs. Streaming
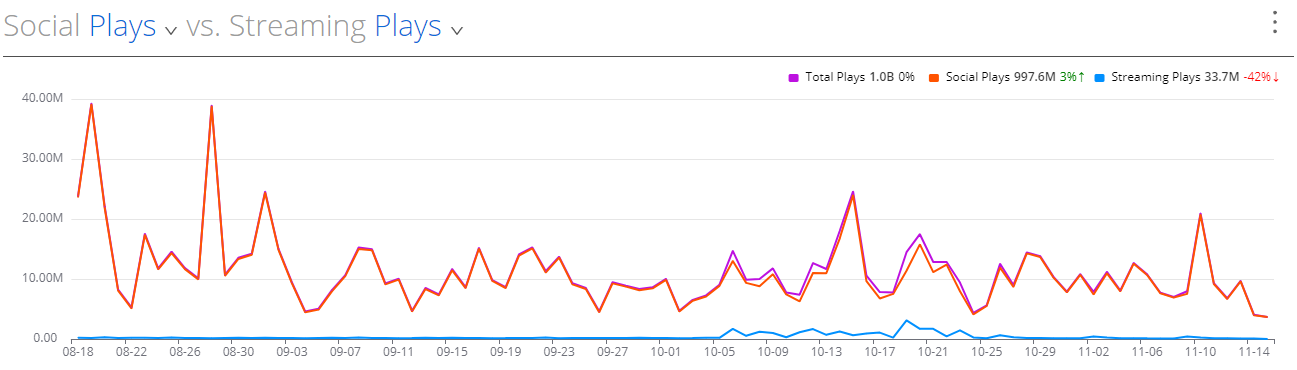
The metrics by which you can analyze social performance are Plays, Impressions, Posts, Engagements, Minutes Consumed, Average Watch Time.
The metrics by which you can analyze streaming performance are Plays, Unique Viewers, Minutes Consumed, Average Watch Time.
by Social Platforms
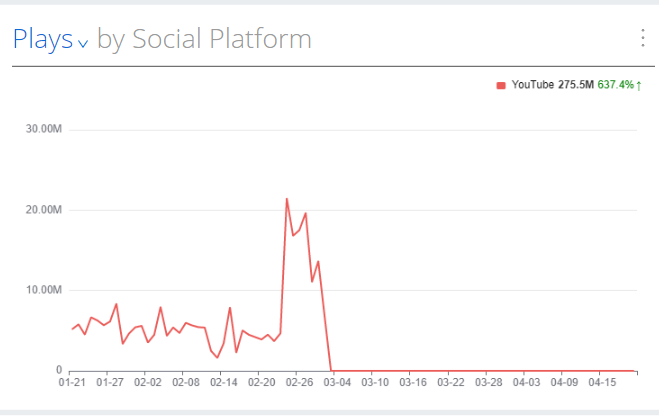
The metrics by which you can analyze social platforms are Plays, Impressions, Assets, Engagements, Minutes Consumed
Top Streaming Device
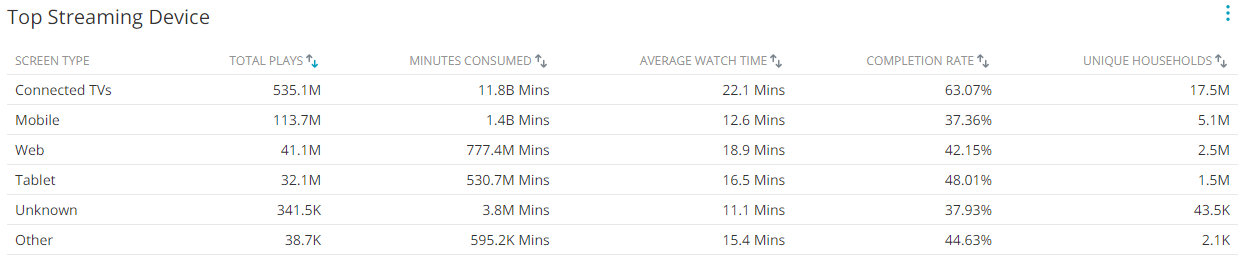
Clicking a device in the Screen Type row displays the Device page where you can gather more details about the device. For example, if you click Connected TV, the Device page displays the key metrics associated with Connected TV such as the percentage of each sub-type of Connected TV such as ROKU, Apple TV, and more.
Top Social Posts by
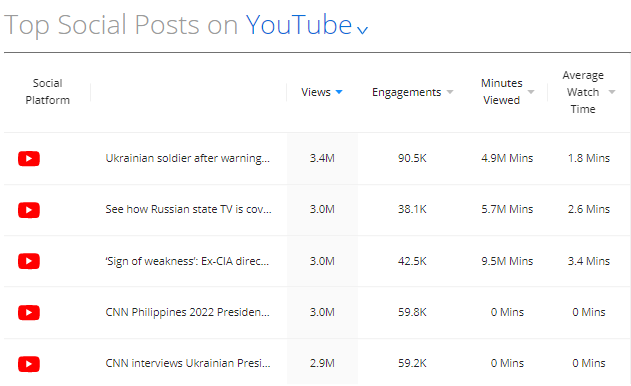
The metrics by which you can analyze social posts are All Platforms, Facebook, YouTube, Instagram, Twitter.
Clicking a post in the Social Platform row displays the post, the key metrics associated with it, audience demographics, and more.
Top Streaming Content on
The metrics by which you can analyze the performance of streaming content on devices are All Devices, Connected TVs, Mobile, Web, and Tablet.
Clicking a post in the Content row displays the Episode page and key metrics about the post such as content consumption by location and device type.
Social Profiles
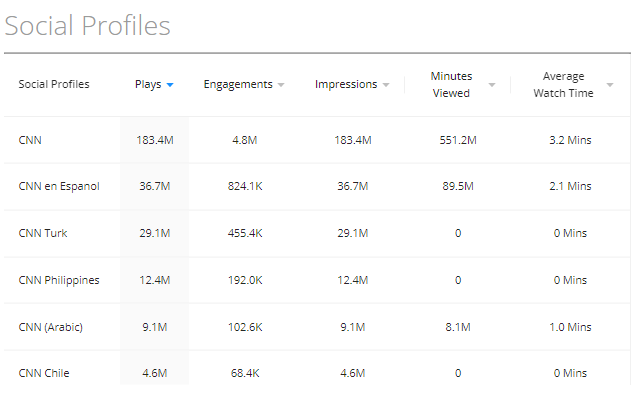
Clicking a social profile displays the Overview page of the profile.
Streaming Device by
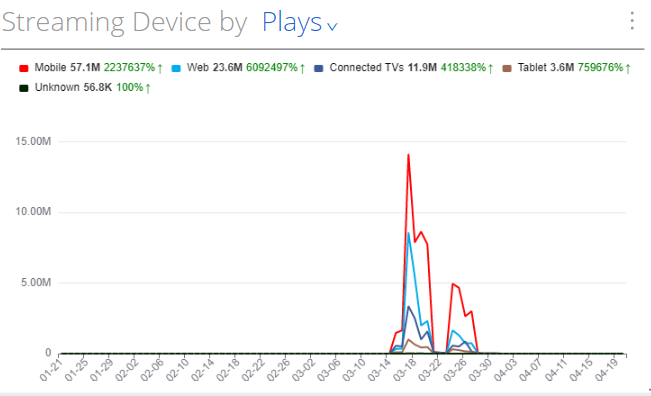
The metrics by which you can analyze devices are Plays, Average Watch Time, Minutes Consumed, Completion Rate, Unique Viewers.
Clicking a device on the hover window displays the Device page where you can gather more details about the device. For example, if you click Mobile, the Device page displays the key metrics associated with that device such as the percentage of each sub-type of mobile such as Android, iPhone, and so on.
Social Locations by Minutes Consumed
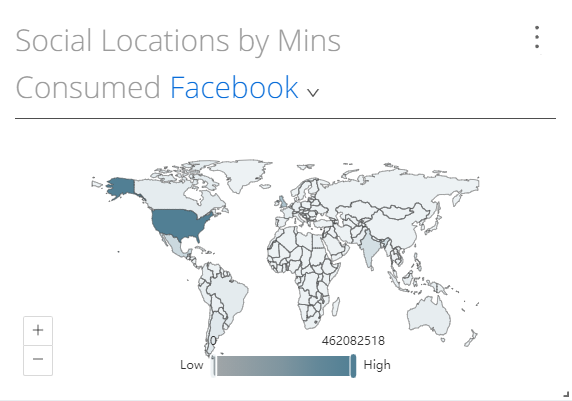
The social platforms on which you can analyze the locations are Facebook and YouTube.
Streaming Locations by
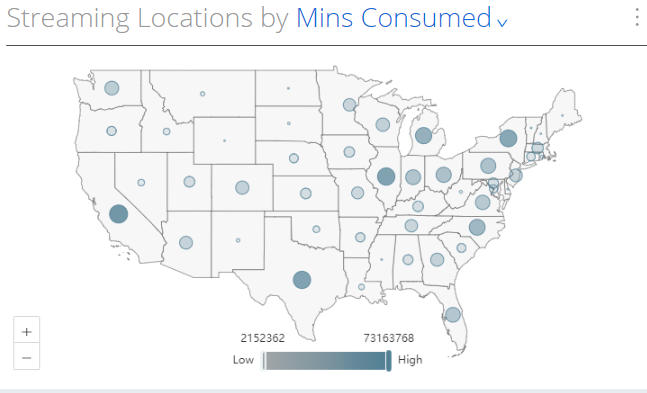
The metrics by which you perform analysis is Plays, Average Watch Time, Minutes Consumed, Completion Rate, and Unique Viewers.
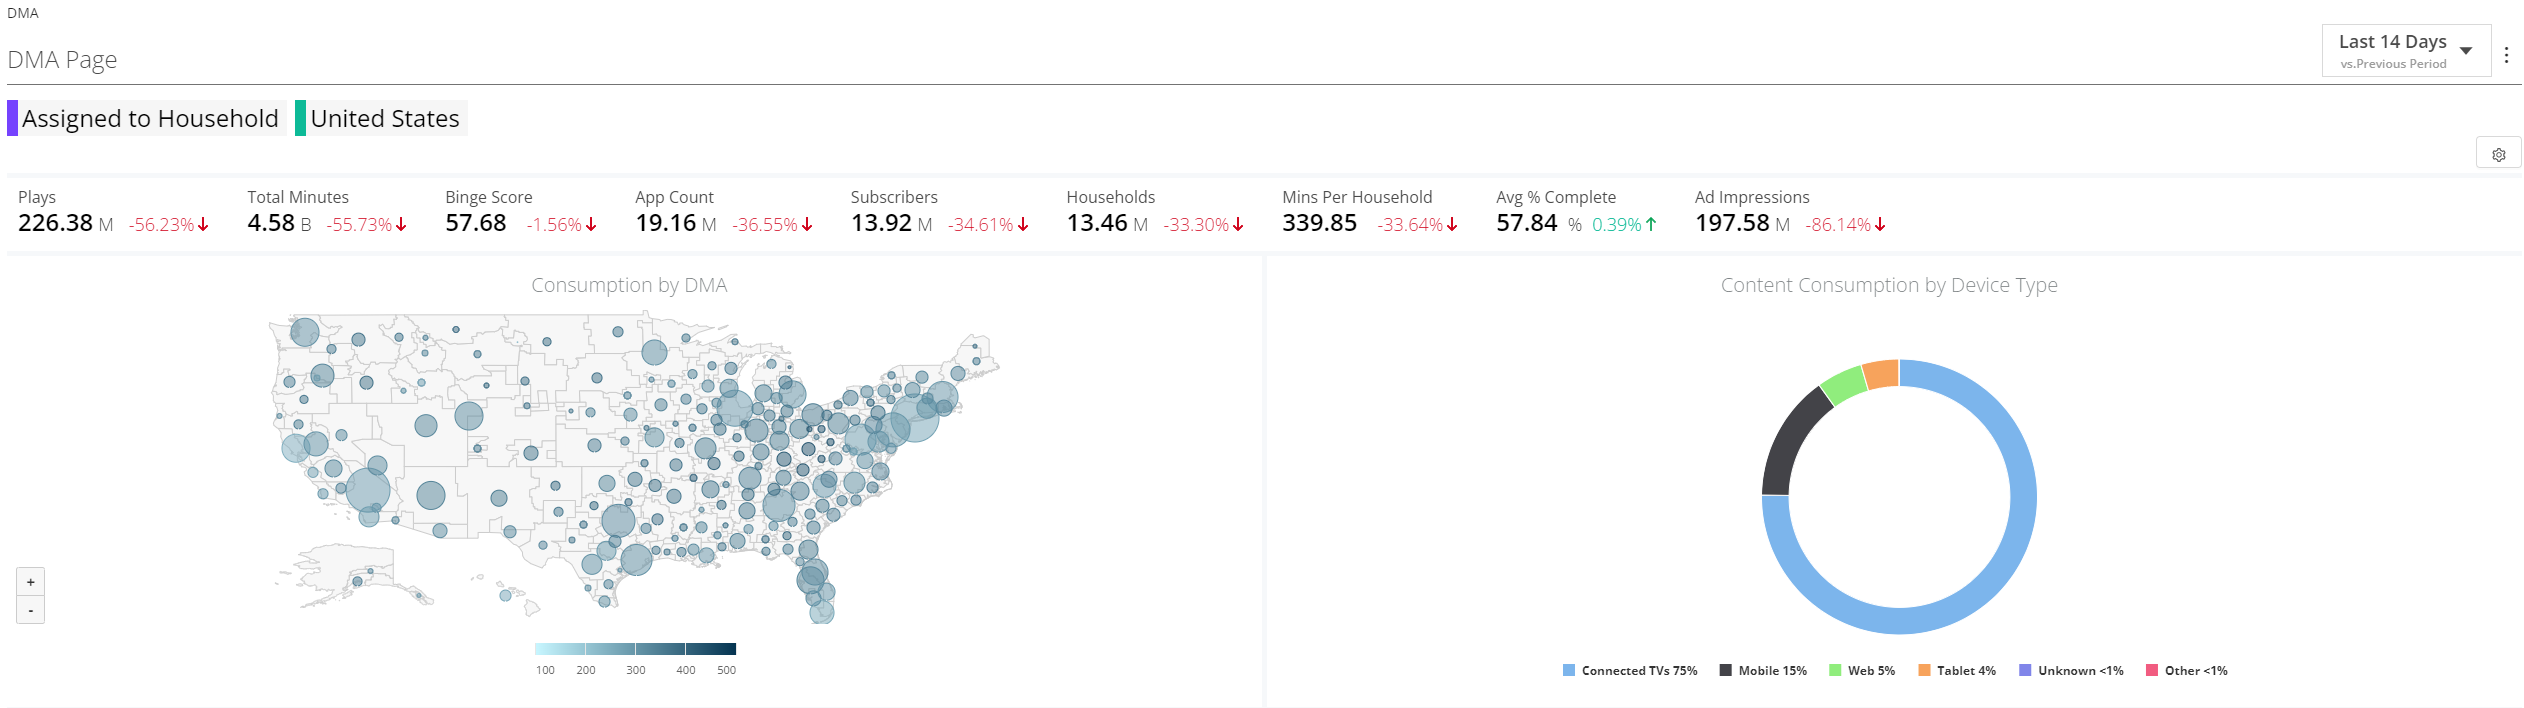
Clicking a bubble, which represents a country / state / DMA displays the DMA page and the key metrics.
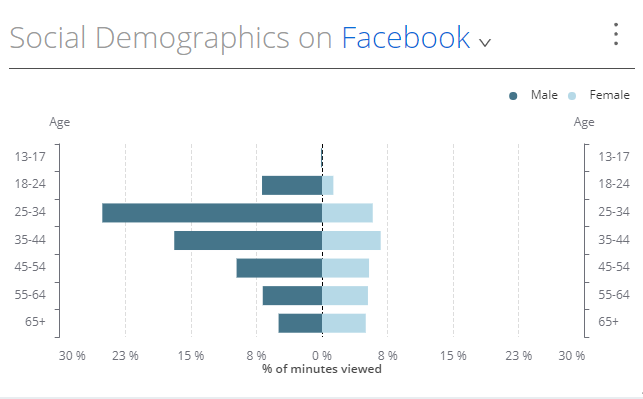
Social Demographics on
You can perform social demographics analysis on Facebook and YouTube.
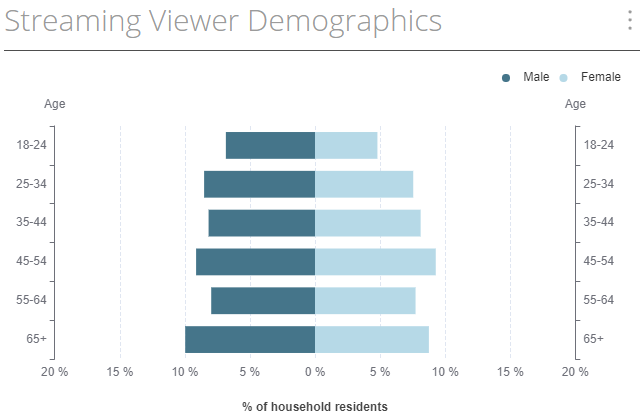
Streaming Viewer Demographics
You can analyze viewer demographics data based on the metrics Male and Female.
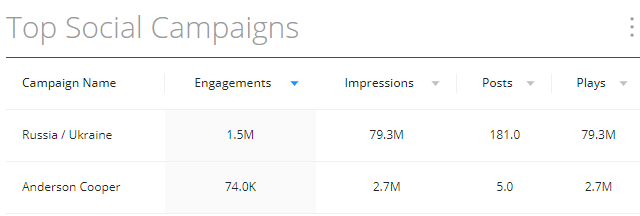
Top Social Campaigns
This widget displays the top campaigns in your social agency for the chosen time period.
Dashboard Filter
The filter options allow you to set social and streaming rules to focus your analysis on specific target campaigns, social platforms, and streaming series / episodes. Clicking All Traffic opens the filter menu and with options to filter your data by social rule (metadata from the Social platform) and streaming rule (metadata collected by the Conviva sensor from your various websites, applications, and video players).
The dashboard filters are associated with a c3 account and / or Social agency.
The dashboard filter is global, and the selected dimensions are carried across all the pages in Audience.
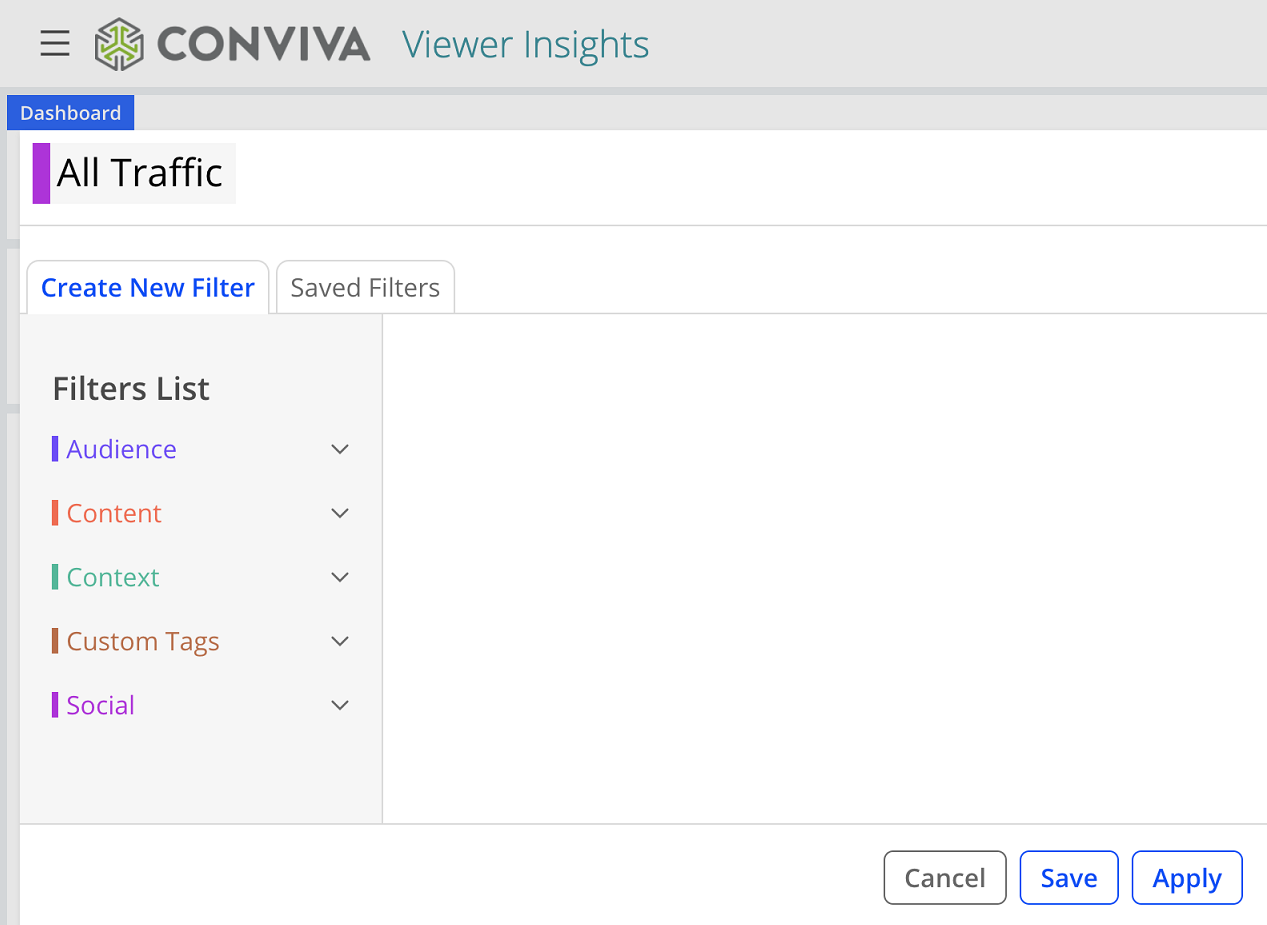
The dashboard filter consists of Simple and Advanced modes.
Simple mode: This mode contains only one rule - Is Equal To. This filter is ideal for scenarios where you want the data to display the sum of all the selected attributes of the various filters.
Advanced mode: This mode contains four rules - Is Equal To, Contains, Begins With, and Is Not Equal To. This filter is ideal for scenarios where you want to apply multiple rules within the same filter attribute.
Working with the Dashboard Filter
To access the filter, click All Traffic or the filter attributes. **The dashboard filter is displayed.
To add a filter attribute, select it from the Filters List on the left pane. The selected attributes are displayed on the right pane.**1. When you filter by Viewers, the attributes are displayed based on the following parameter:
- If the unique ID for an account is configured with Stream ID, the attributes are:
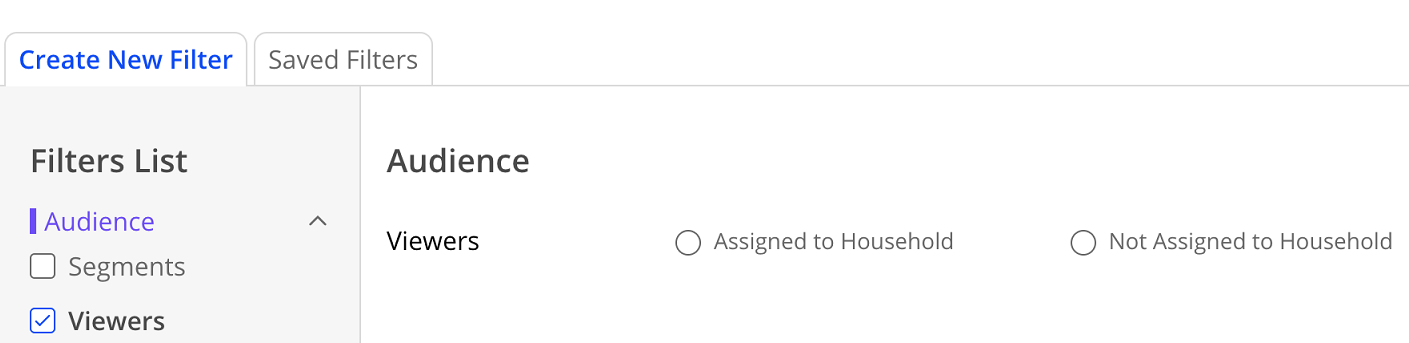
- If the unique ID for an account is configured with Subscriber ID, the attributes are:
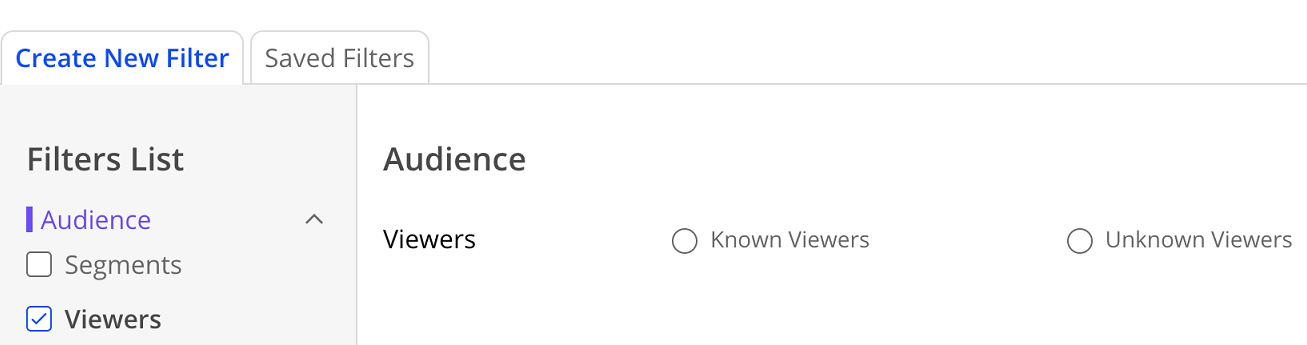
- To add values to the selected filter attributes:
-
Click in the field. The values are auto-populated and displayed in a list. You can choose as many values as you like, and the default rule that connects the values is **Is Equal To**. For example, If you choose attributes A, B, and C for **Series** filter, then Series is equal to A or B or C.**
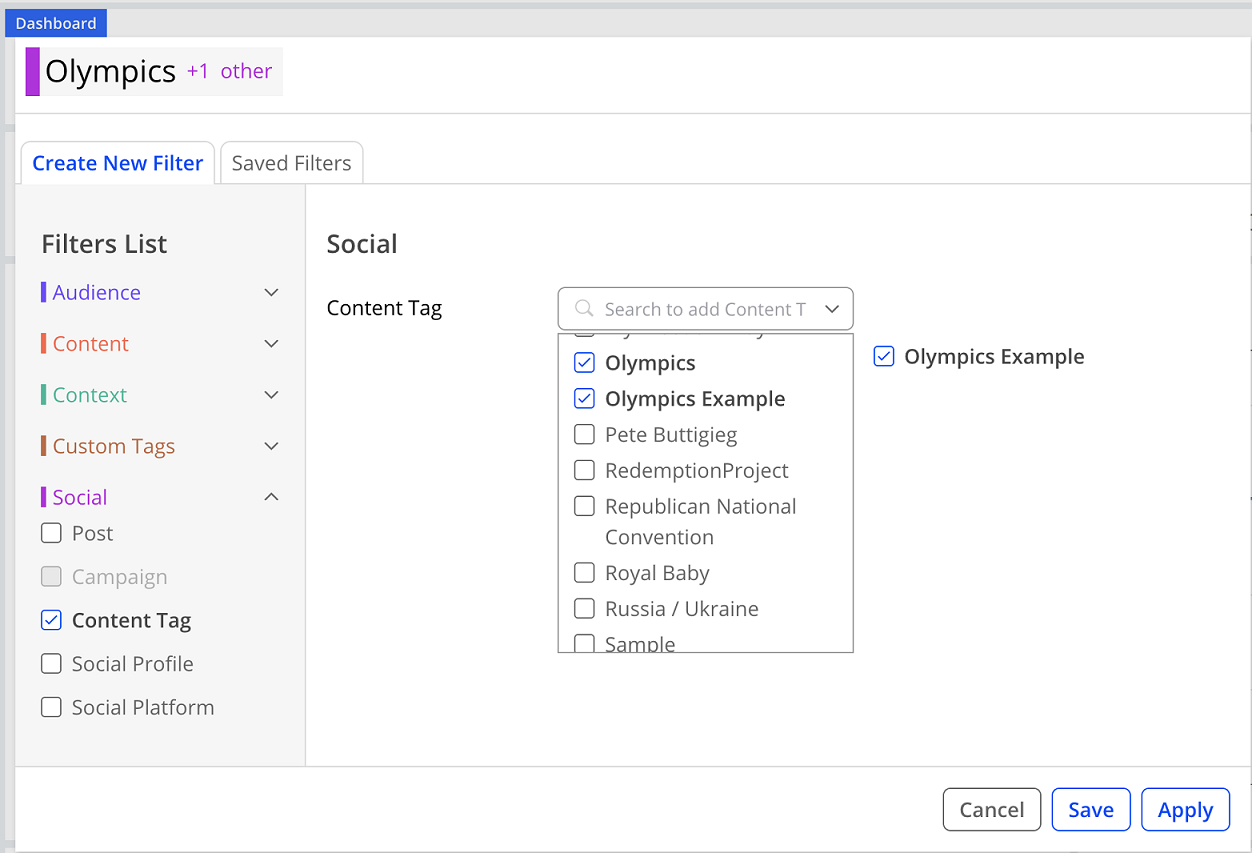
- To remove a filter attribute from the right-pane, hover over the attribute, click the kebab icon that appears on the right of the attribute, and click Remove.**
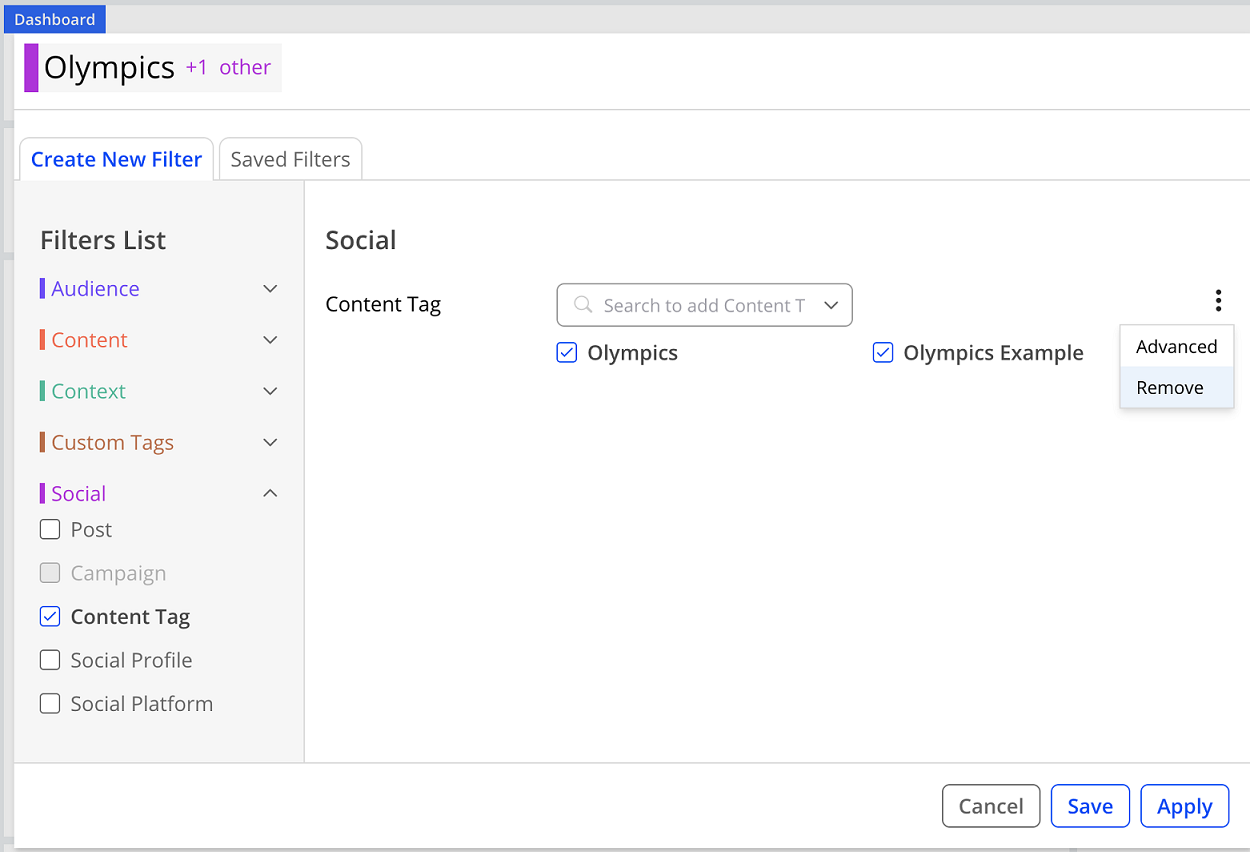
- To remove a filter attribute from the right-pane, hover over the attribute, click the kebab icon that appears on the right of the attribute, and click Remove.**
-
To convert a filter from simple mode to advanced mode, select a filter attribute. The Is Equal To rule is applied by default. Click the kebab icon that appears on the right of the attribute and click Advanced. For reference, see the screenshot in step 4 (b).
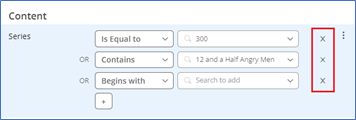
You can convert a filter from a simple mode to advanced mode seamlessly, but you cannot switch back to simple mode if any other condition apart from Is Equal To is used in the advanced mode.To remove an attribute from an advanced mode, click the X which is displayed to the right of the value field.**
Saving Filters
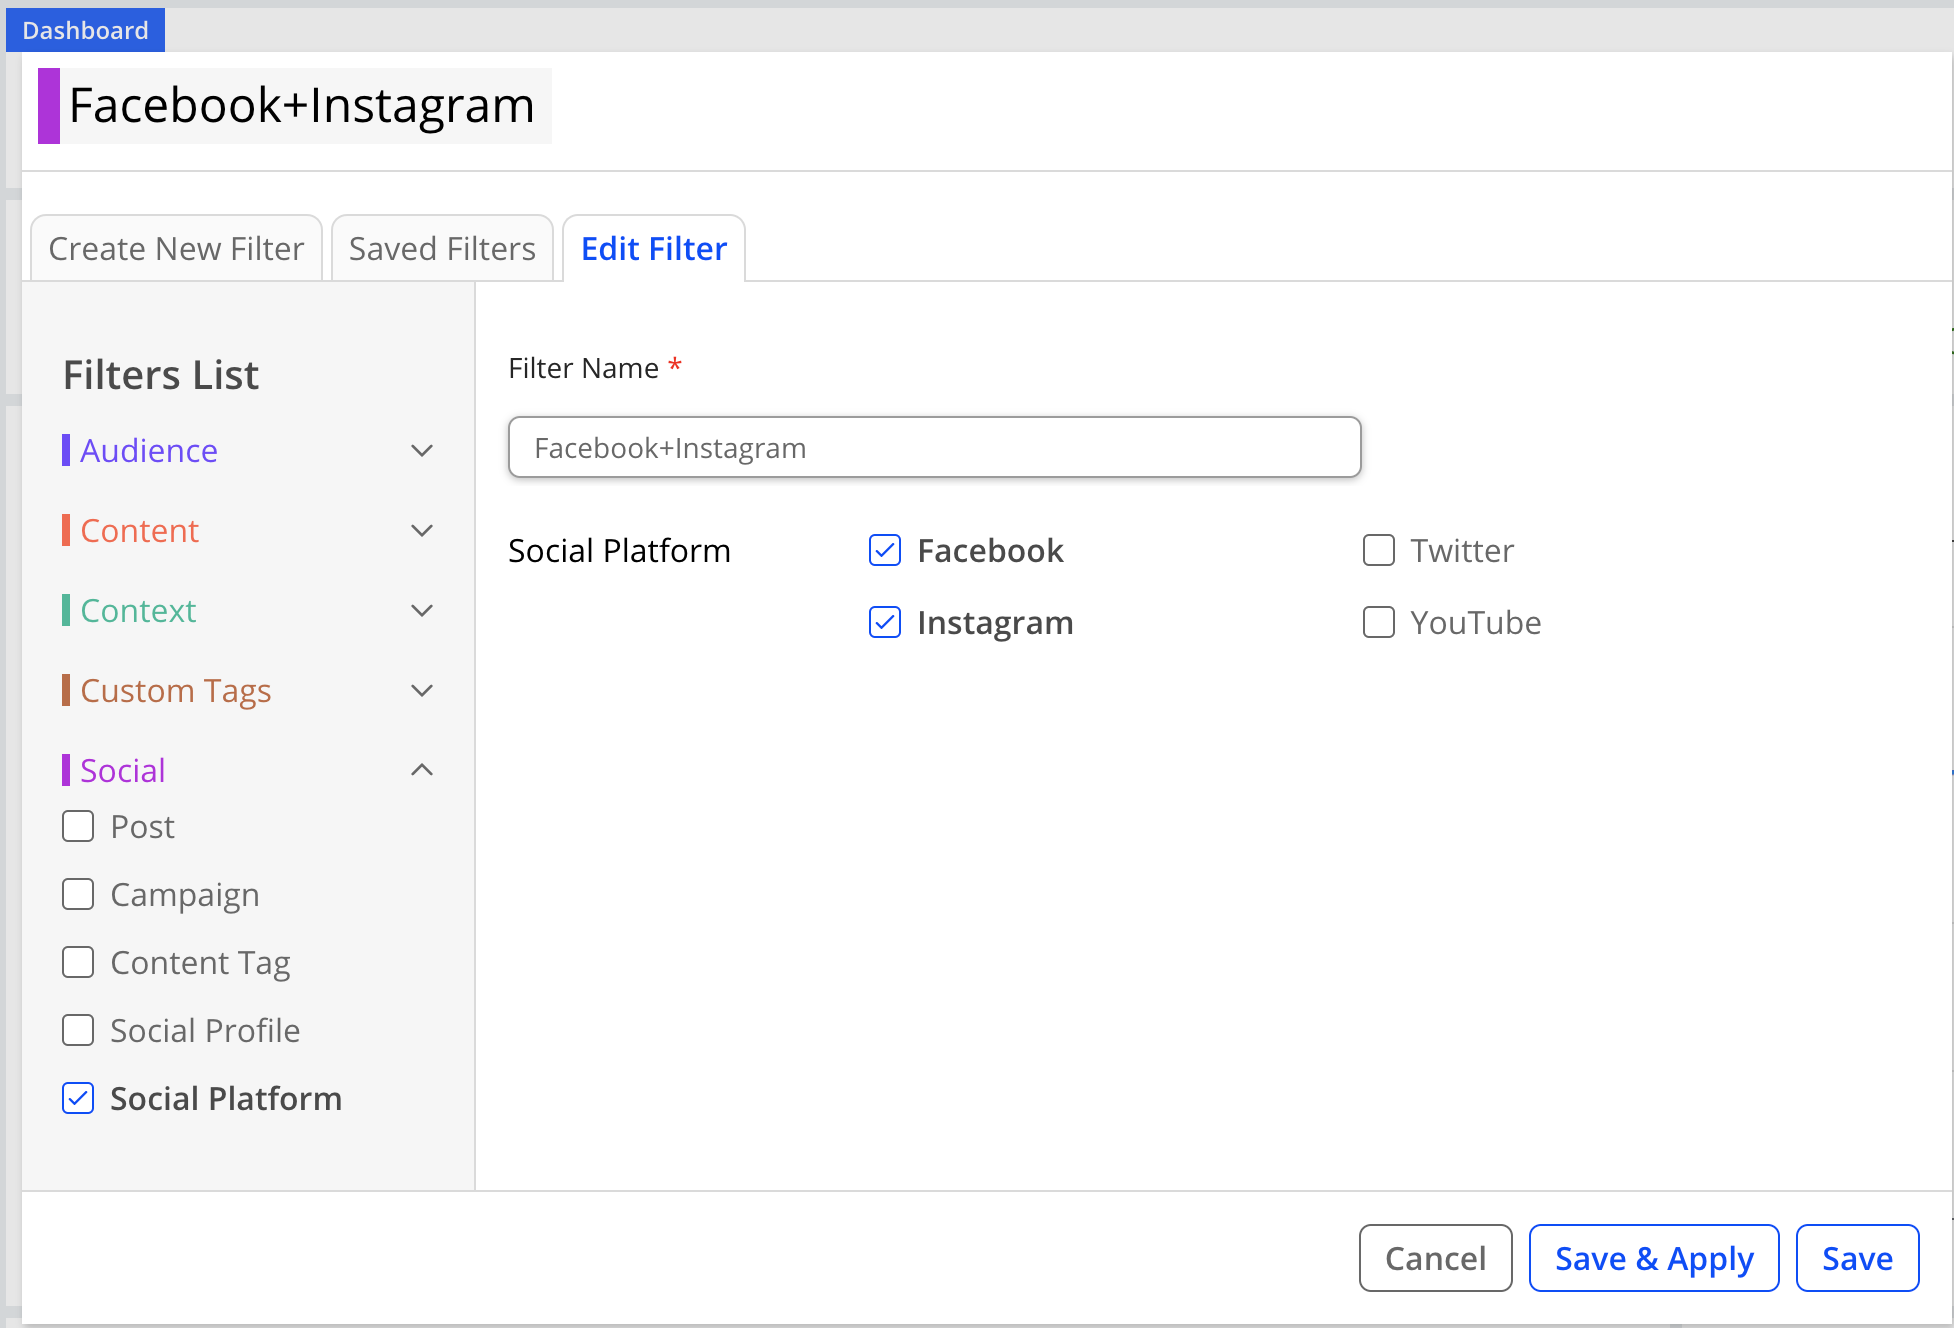
Click the Saved Filters tab to access all the filters that were saved by you and other users.
The All Filters section contains the filters that were created by all the users under the current combination of social agency and c3 container. The My Filters section displays the filters that were created by you.
In the All Filters section, you can only view and apply the filters created by others. In the My Filters section, you can edit and delete the filters that you created.
To edit or delete a filter, click the kebab icon next to the name of the filter, and click the desired option.
Viewer Drill-Down
The drill-down feature in the widgets delivers the most granular insight into everyday streaming performance from the perspective of each viewer. The dashboard provides a deep-dive view along with content discovery from the Audience application.
Match your social streaming performance with the social metrics most related to your content.
Discover detailed observations linking directly to the related Audience pages for advanced analysis.
Navigate to drill-downs without losing the context of the selected time range, asset name, social platform and profile, and other filters.
For example, drill-down from the Streaming Locations widget to the DMA details page.
Viewer drill-down can be performed for the following widgets:
| Audience | Drill-Down Link |
|---|---|
| Top Streaming Device (row view) | Displays the Device page and key metrics associated with the selected device type. |
| Top Social Posts (row view) | Displays the details of the selected post including analytics such as Viewer Demographics and Viewer Location. |
| Top Streaming Content (row view) | Displays streaming metrics such as Plays, Unique Viewers, and more on the Episode page. |
| Social Profiles by (row view) | Displays the Overview dashboard with analytics about the selected profile. |
| Streaming Device by (row view) | Displays the drill-down analysis on the Device page. |
| Streaming Locations by (map view) | Perform a drill-down analysis by clicking the bubbles, which represent a country / state / DMA depending on the selected country. Details about the selected DMA are displayed on the DMA page. |
If the Campaign filter is applied, the drill-down analysis displays the Campaigns dashboard.
If the Tag filter is applied, the drill-down analysis displays the Analytics dashboard.
Viewer Drill-Down Use Cases
Use case: Campaign Performance
You want to check the performance of a campaign that you recently started across social media platforms. To do that, on the dashboard, filter for the campaign and find a top post (for example, on Facebook) that matches your metrics. When you click the post, the viewer drill-down feature takes you to the details page in Social Insights with all the selected filters and content. On that page, you can take a closer look at the details and metrics of that post.
Use case: Device Details
You are a social media content creator and you want to find out on which platform your newly released content is being viewed the most. To do that, on the dashboard, filter for your content, and the data reveals that Connected TV is getting the most traffic. You can then click that row and the viewer drill-down feature displays the Device Detail page where you can gather more details, such as the percentage of each sub-type of Connected TV such as ROKU, Apple TV, and so on.
Exporting Data
To export data for your streaming and social channels for the selected date range and from all the widgets, click the kebab icon in the upper-right corner of the dashboard, and click Export.
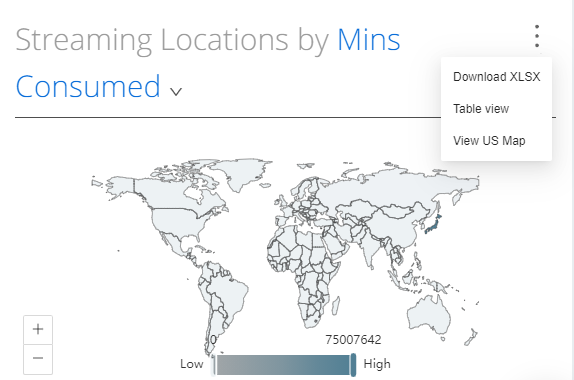
To export data from a specific widget, click the kebab icon in the upper-right corner of the widget, and then click Download XLSX or one of the available file formats.
Customizing Dashboard Widgets
Your customizations and settings on this dashboard are specific to your user profile. The dimensions that you set for the widgets will remain the same the next time you log in.
The Social + Streaming dashboard supports the following options for customizing the widgets:
Switching the widget display between visual and table views.
Resizing the widgets.
Rearranging the widgets.
Customizing Widgets
Switching Between Visual and Table View
Several widgets support toggling between table and visual graph views of the data.
To toggle the data display, click the kebab icon in the upper right corner of a widget, and from the dropdown select Table view or Visual view.
Resizing Widgets
To resize a widget, hover your mouse over the bottom-right corner of any widget. Dragging down or right will make the widget larger, up to the full width of the dashboard.
Rearranging Widgets
To rearrange widget placement, hover over the top of any widget and the cursor changes to the crosshair icon. Drag the widget to the desired location on the dashboard.
Key Questions
Total Audience & Composition
- What is my total audience across my streaming apps (O&O) and social media (viewers, views, engagement)?
- Where is my audience coming from?
- Apps vs social media?
- Which social platforms are driving the most viewership or engagement?
- Which social profiles are driving the most viewership or engagement?
- Which apps are driving the most audience?
- What audience demographics (age / gender groups) am I getting through each of these? What are the similarities and what are the differences between social and apps?
- Geographically, where is my audience coming from?
- What is the engagement of my audience and how does it correlate between apps and social platforms?
- Where is my audience coming from?
Factors Driving the Trends
- What is driving viewership in each of these segments (apps, social platforms, social profiles, etc.)?
-
Which activities had the biggest impact in bringing me viewers? (social media posts, new releases, ads, in-app messaging, email messages, push notifications, etc.)
Which content had the biggest pull of viewers into my apps?
What are the shifts in viewership?