-
Easily create custom metrics and dimensions to analyze the most critical performance areas
-
Monitor detailed metrics and related dimensions to determine the health of the app ecosystem
Analyzing & Reporting Teams Task Details
|
Data Science Tasks |
Description |
|---|---|
|
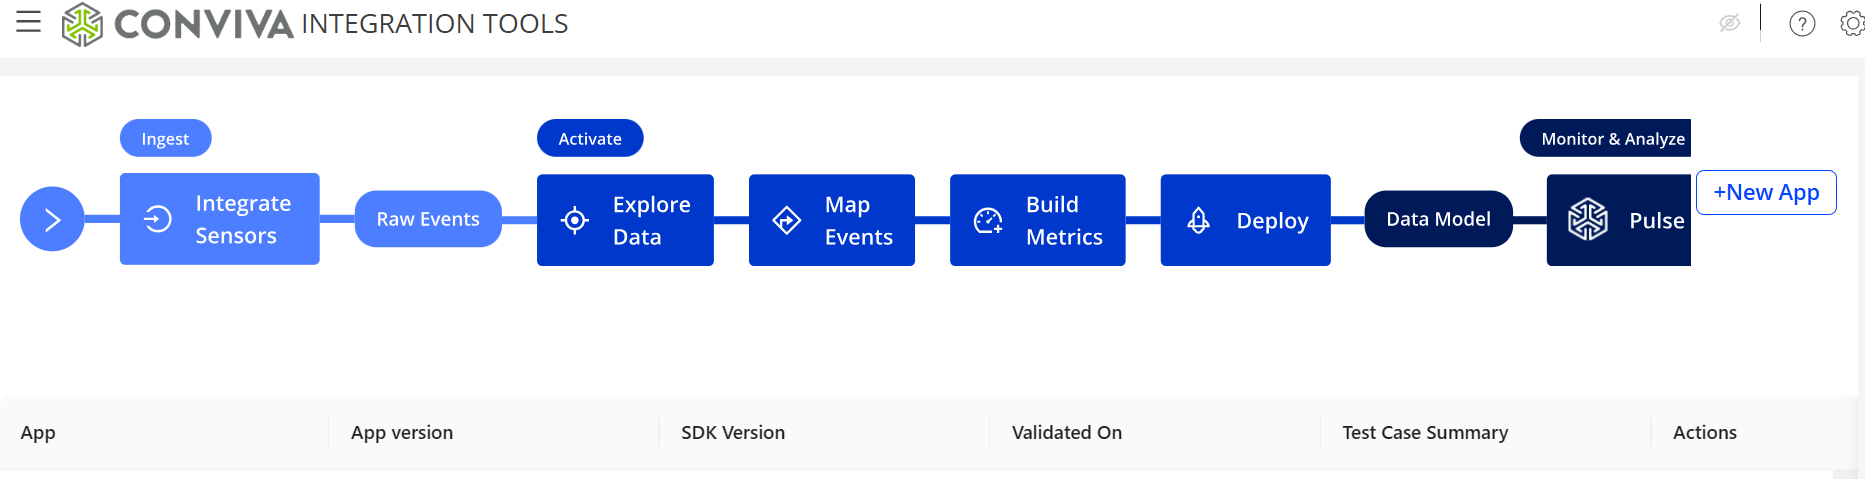
Ingest Data
Access Pulse: Integration Tools |
With the Conviva App Sensor, collect data automatically. For more details, see DPI Integration. |
|
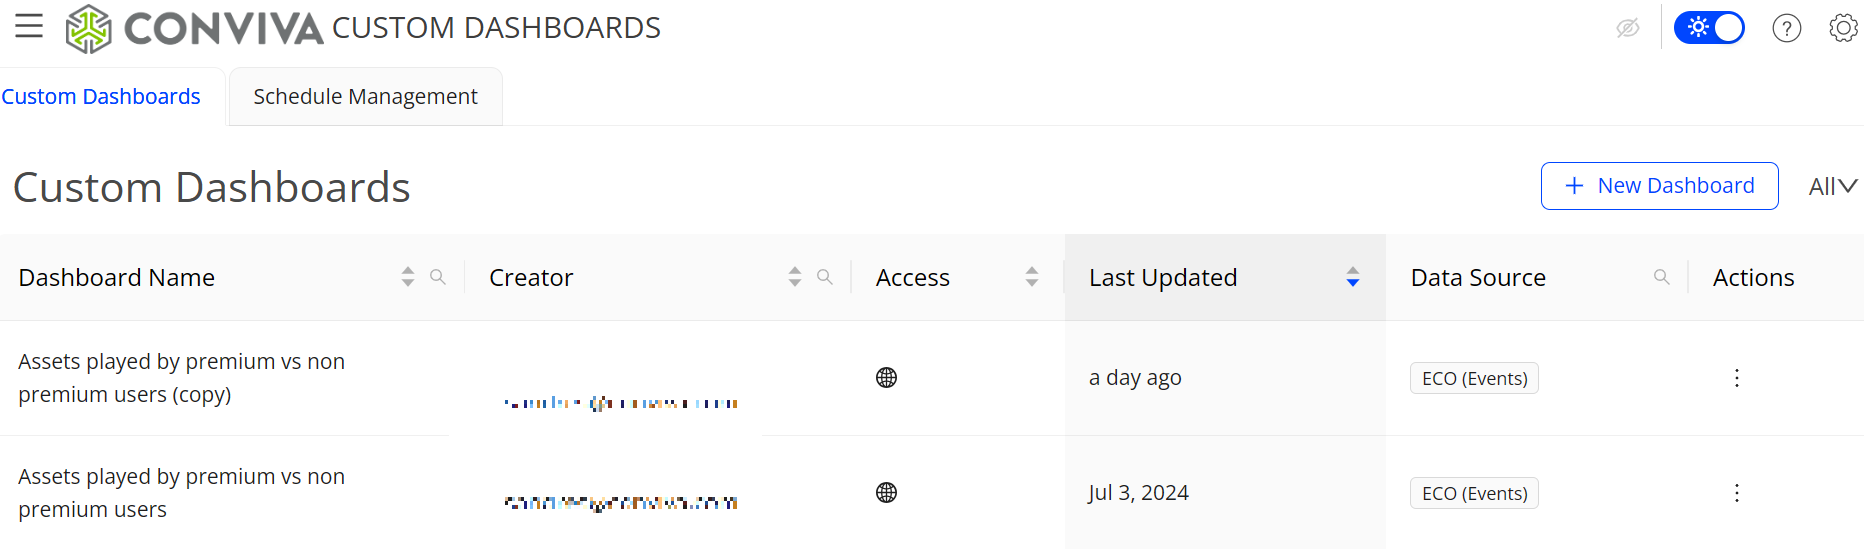
Create Custom Dashboard
Access Pulse: Custom Dashboards |
Create personalized dashboards and discover new insights by combining widgets and display options to emphasize key insights.
For more details, see Custom Dashboards. |
|
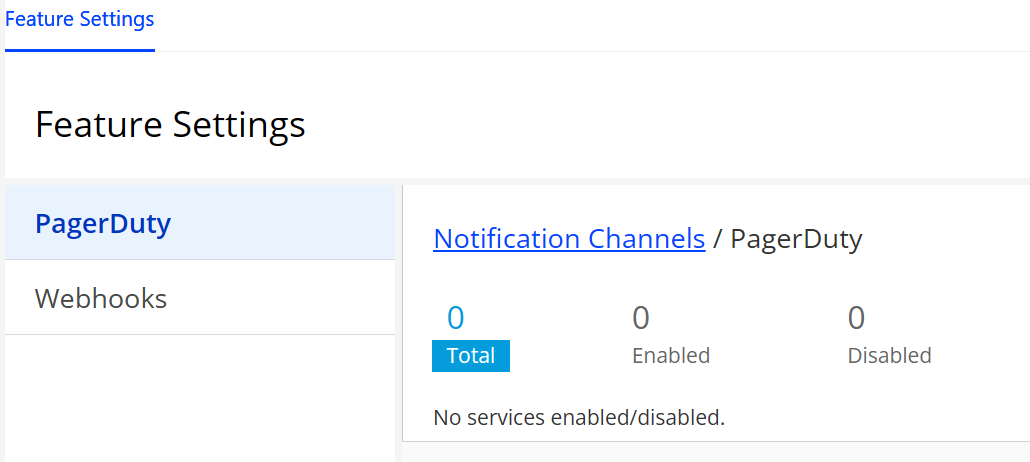
Integrate AI alerts with PagerDuty
Access Pulse: Settings > PagerDuty |
Integrate AI alerts with PagerDuty to enhance DPI AI alerts with PagerDuty escalation management and notifications. You need a PagerDuty account with configured services to integrate Conviva alerts with the configured PagerDuty services. For more details, see Conviva PagerDuty Integration Guide for DPI. |
|
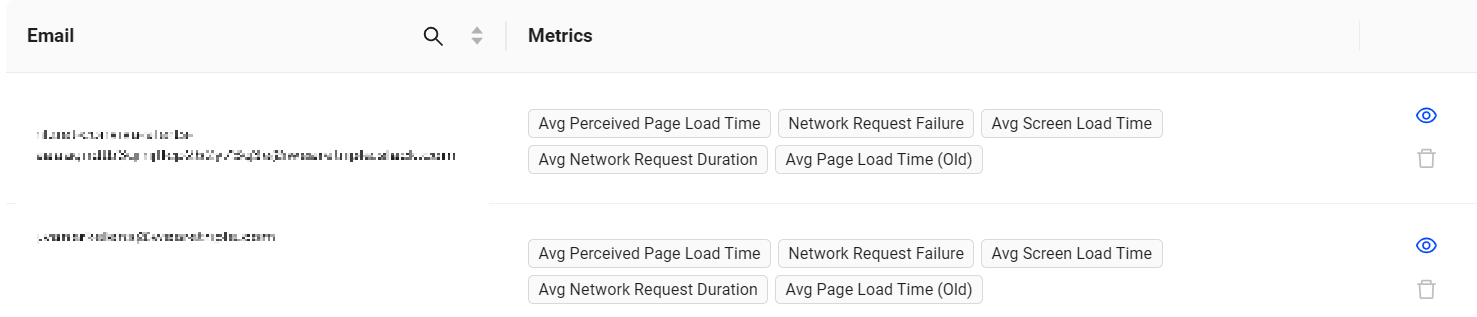
Set AI Alerts Email Subscriptions
Access Pulse: Settings > Email Subscriptions |
Sets up email notifications for prompt updates when performance issues meet AI alert conditions.
For more details, see AI Alert Email Subscription. |
|
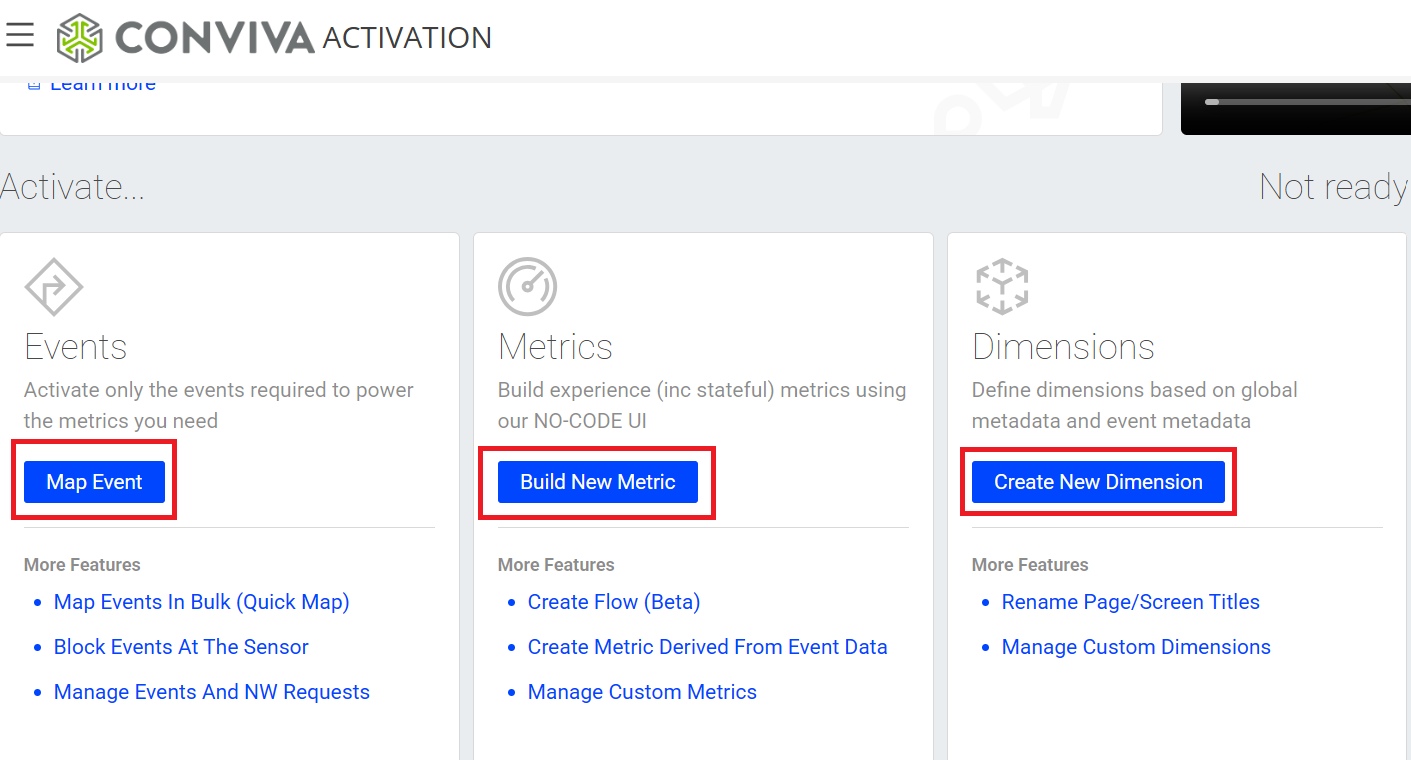
Build Custom Metrics and Dimensions for Advanced Analysis
Access Pulse: Activation |
With the activation tools, set up event mappings to build customized metrics and add new dimensions to efficiently transform application events into advanced data insights. For example, map new live video attempt events and create the Live Video Attempt to Play Time metric based on the live video attempt and live video play events to identify user engagement with video content and facilitate analysis of any underlying factors contributing to delays in playback. For more details, see Semantic Mapper and Metric Builder. |