-
Gain a complete, real-time view of engagement, experience, and performance
-
Compute experience metrics for critical user flows
-
Seamlessly blend real-time and historical analytics
-
Discover how feature changes impact customers
Product Teams Task Details
| Product Manager Tasks | Description |
|---|---|
|
Get Started With Presets Dashboards
Access Pulse: Presets |
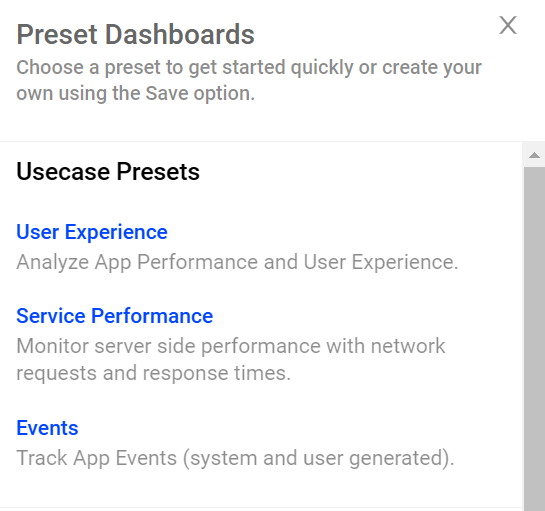
Check pre-defined dashboards as quick starting points to have access to commonly used metrics and metadata use cases from these aspects:
For more details, see Presets. |
|
Analyze Metrics and Dimension Data
Access Pulse: Trends |
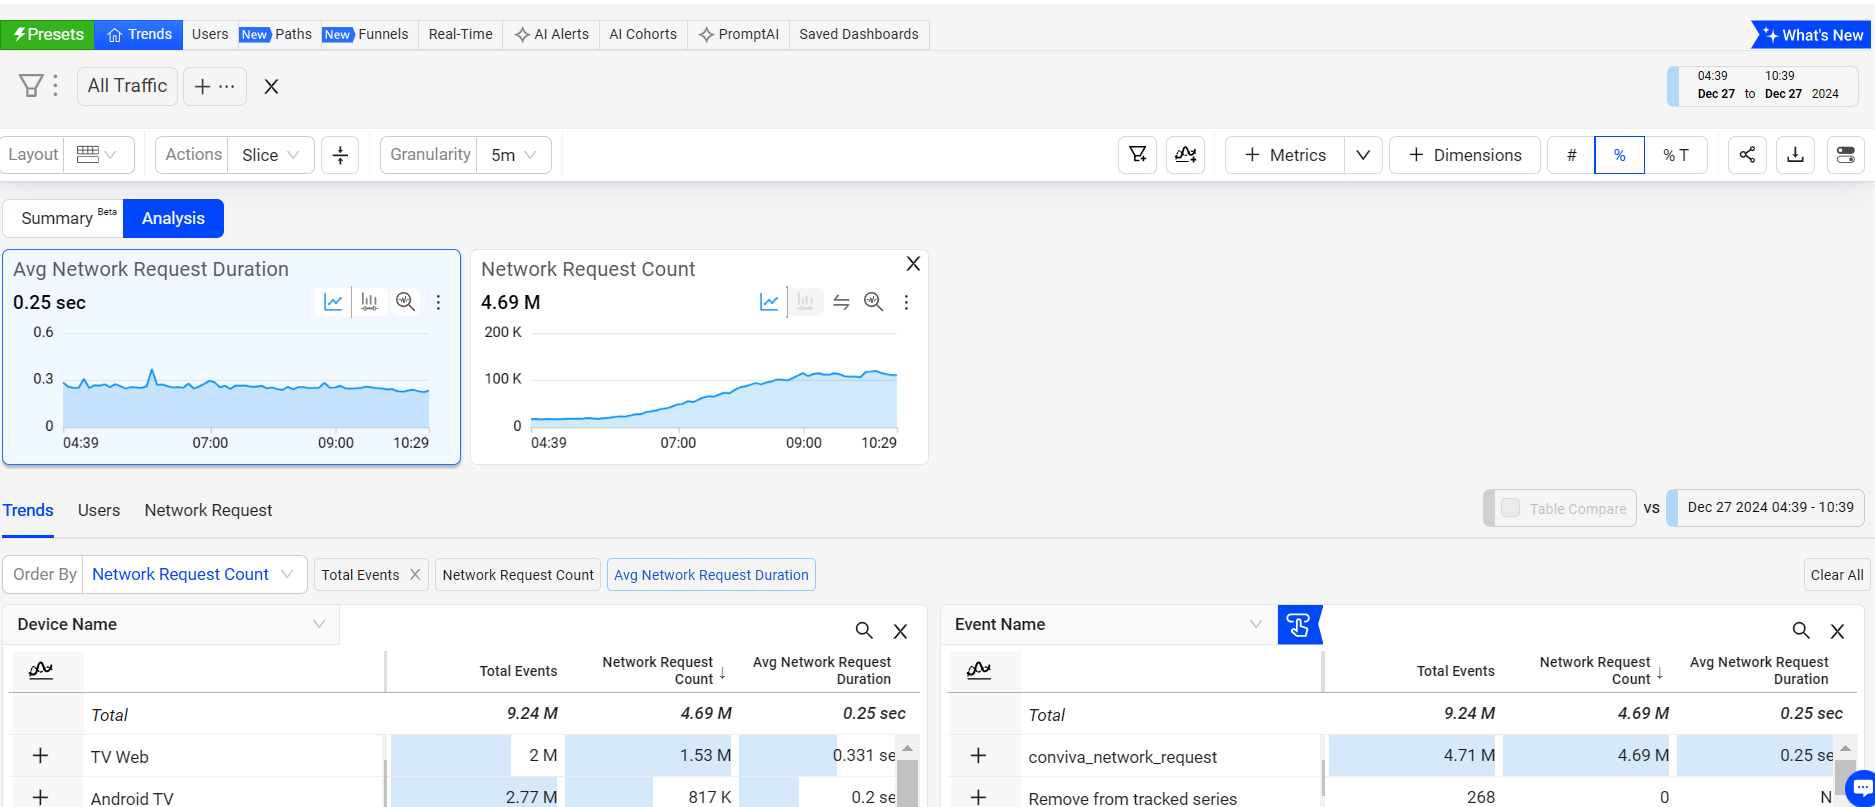
Gain a complete view of customer engagement, experience, and performance in real time with the functions:
For more details, see Trends and Summary Tab. |
|
Analyze Data in Live Mode or Over a Specific Time Range
Access Pulse: Trends |
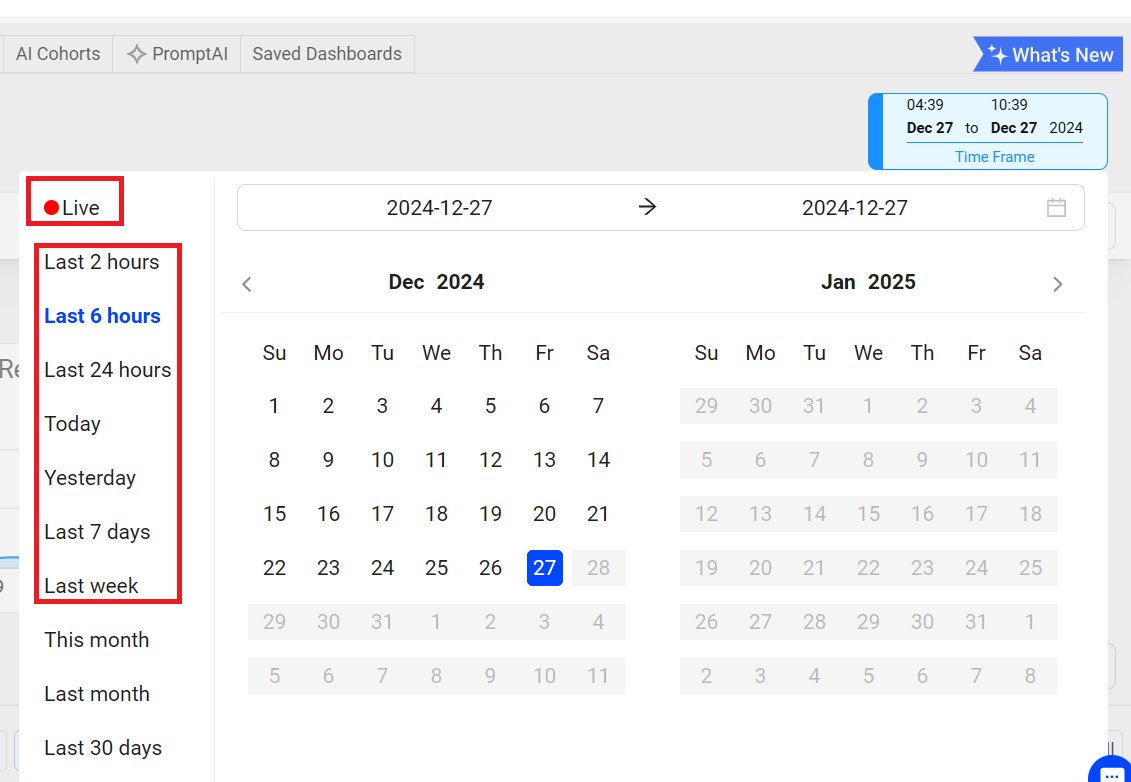
Conduct real-time and historical customer engagement analytics in a single pane of glass by selecting the Live mode or a specific time range. For more details, see Trends. |
|
Build Custom Metrics and Dimensions for Advanced Analysis
Access Pulse: Activation |
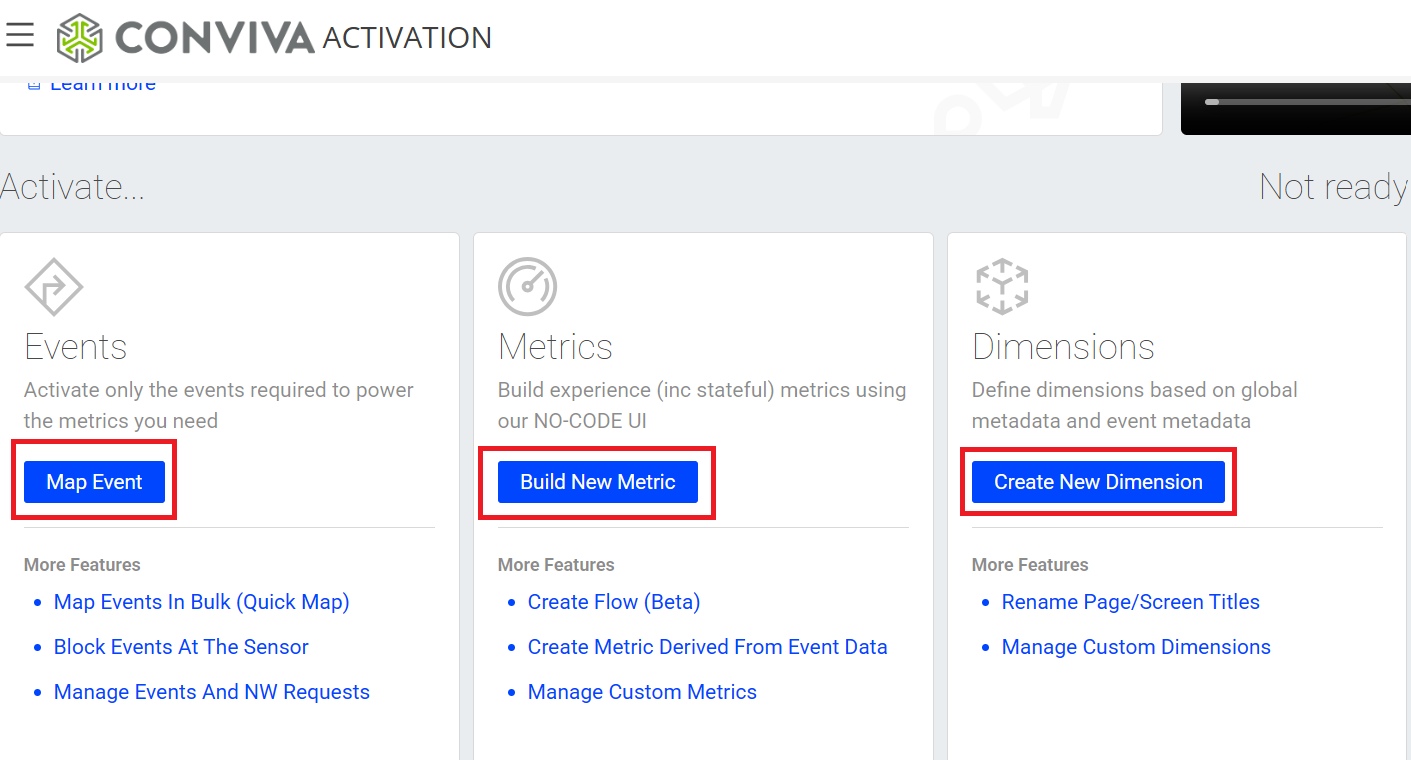
With the activation tools, set up event mappings to build customized metrics and add new dimensions to efficiently transform application events into advanced data insights. For example, map new registration events and create the Full Registration Time metric based on the registration start and completion events to gain visibility into existing registration bottlenecks and identify network requests for processing improvements. For more details, see Semantic Mapper and Metric Builder. |
|
Access cohort replays of impacted sessions
Access Pulse: Cohort Replay |
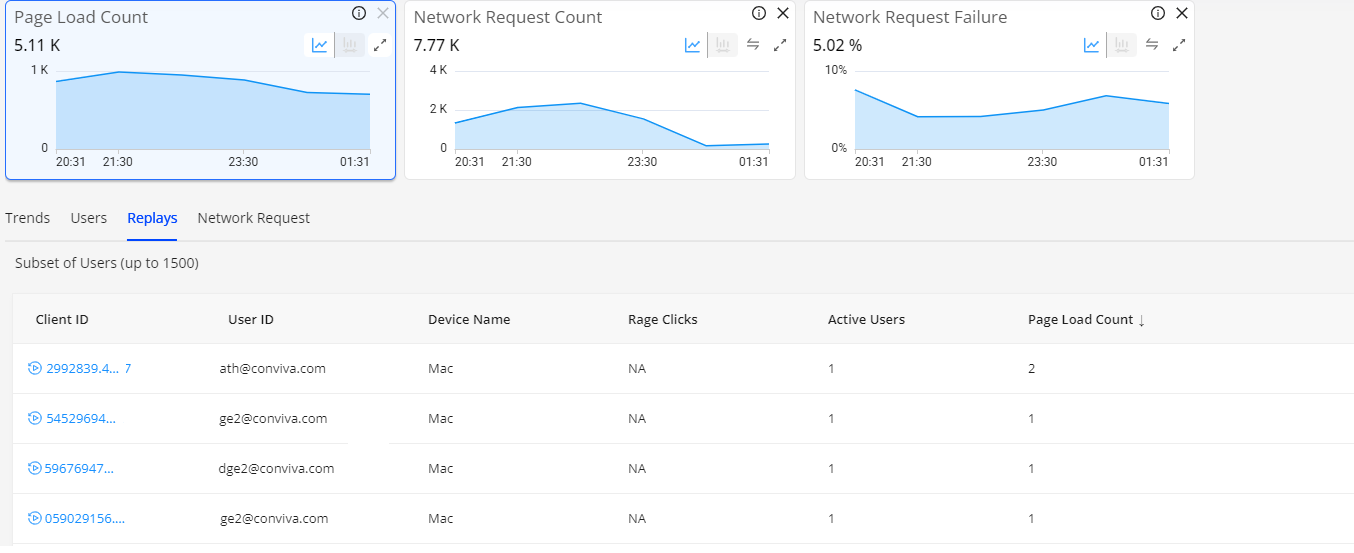
In Trends, select a metric time series and then click the Cohort Replay tab to view the available sessions and access session replays. For more details, see Cohort Replays. |