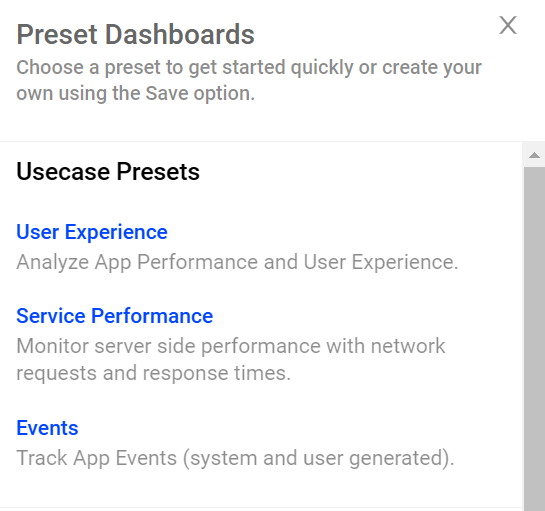
Operation Teams check the pre-defined Service Performance dashboard as quick starting points to have access to commonly used metrics and metadata use cases.
Customer Support Teams check pre-defined dashboards as quick starting points to have access to commonly used metrics and metadata use cases from these aspects:
Operation Teams and Customer Support Teams use these functions to do deep analysis:
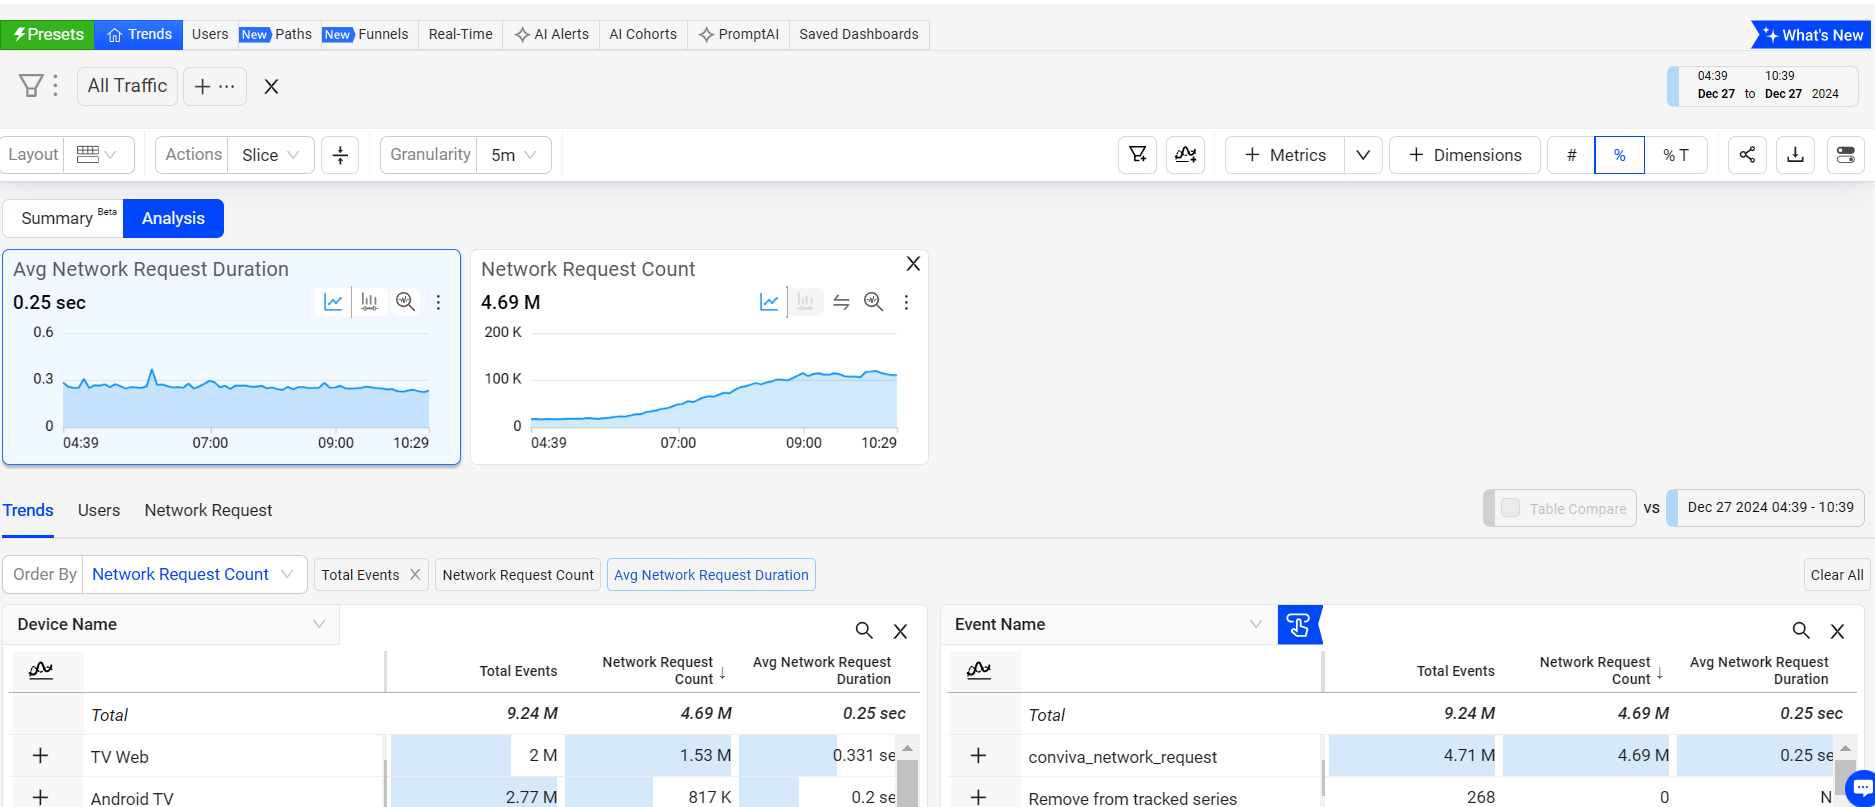
Quickly diagnose app performance based on the dimensional drill-downs, impacted users, and network requests.
Click a metric in the Summary panel or a metric widget, such as Avg Page Load Time, to filter the displayed data to the related impacted users and display secondary and companion metrics in the dimension tables.
Click a user ID to go to the user timeline for comprehensive, and granular analysis of a session.
Click the Focus icon in a metric time series to display an expanded view of the time series above the trend data.
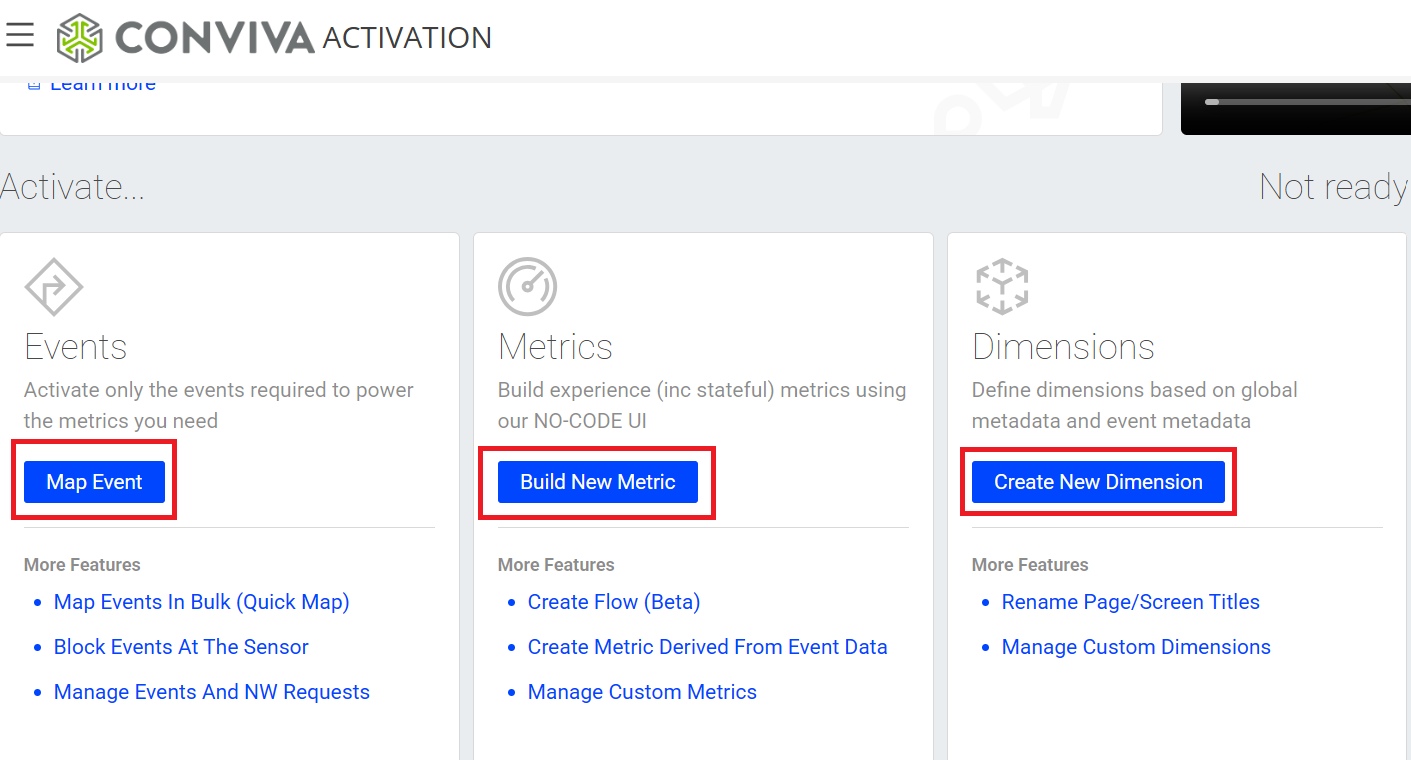
With the activation tools, set up event mappings to build customized metrics and add new dimensions to efficiently transform application events into advanced data insights.
For example, Operation Teams maps new login events and creates the Full Login Time metric based on the login start and completion events to gain visibility into existing application performance issues and identify the root causes of slow login times.
For example, Customer Support Teams map new login process error events and create the Login Process Error metric based on the login error events to analyze application performance and identify the root causes of these errors.
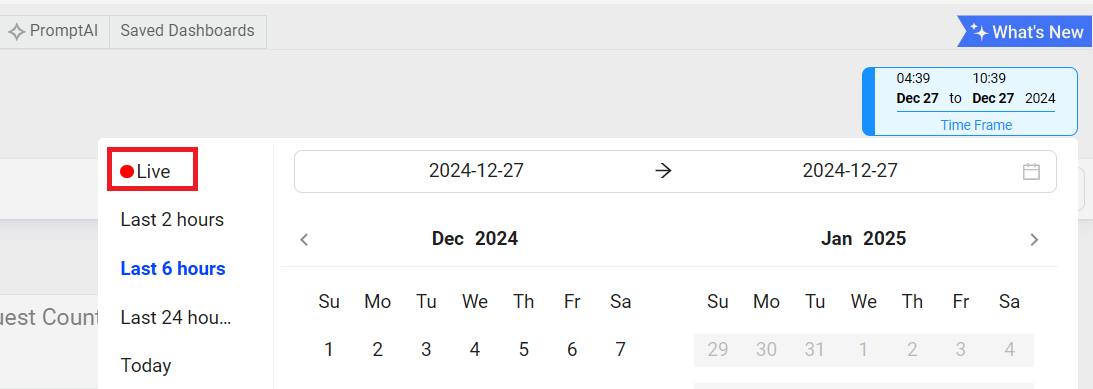
In the Trends dashboard, Operation Teams use the date picker to select the live mode. The Live mode shows the time series along with the aggregated metric numbers and percentages on the metric widget, aligning the aggregate values with the metric values in the dimension table.
For more details, see Trends.
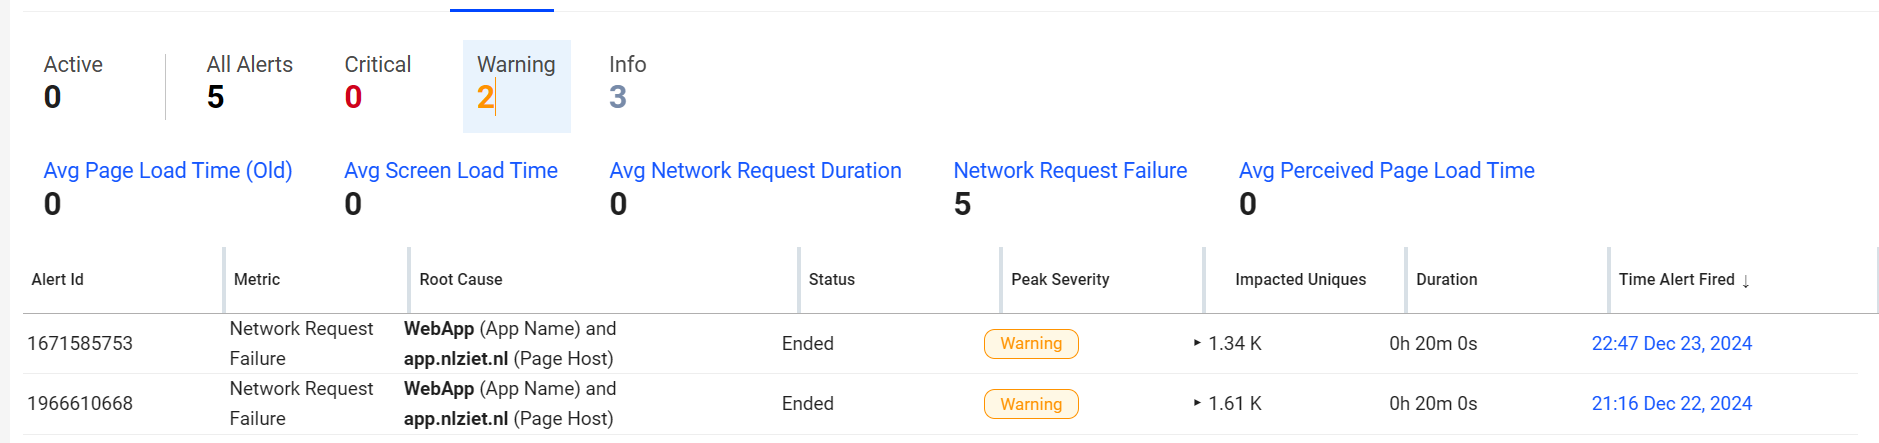
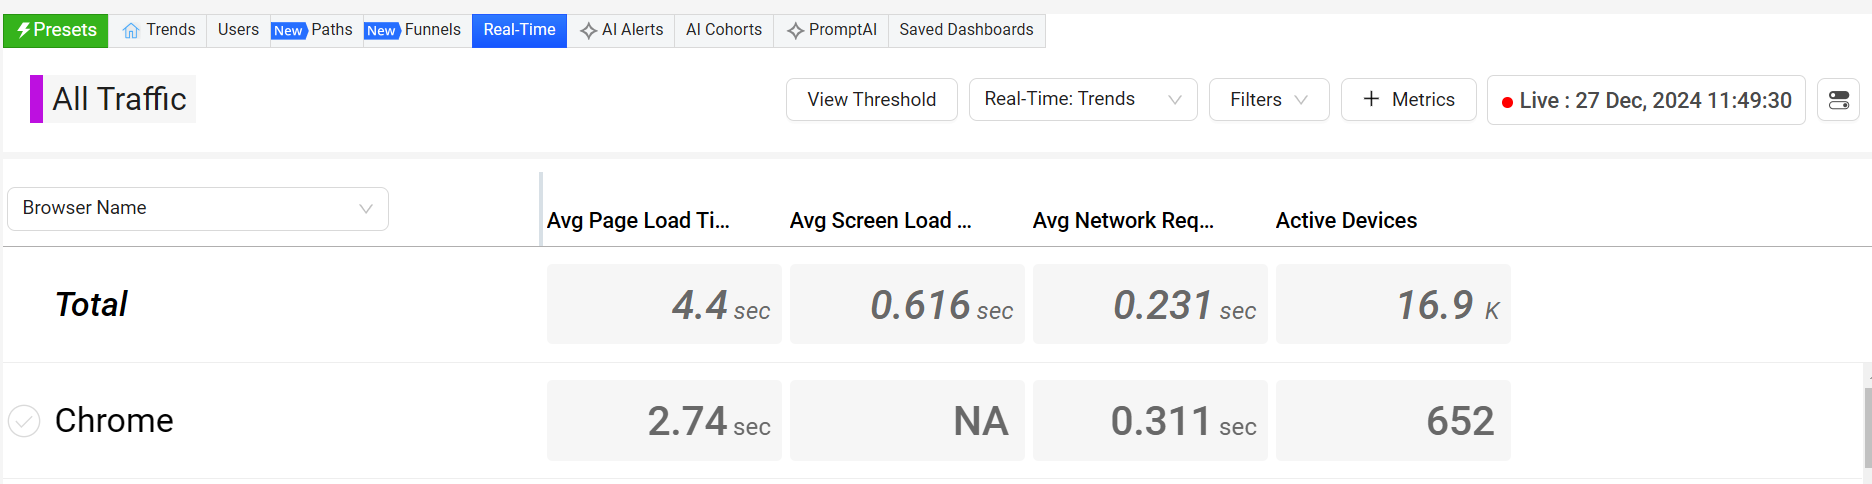
In the Real-Time dashboard, Operation Teams monitor the performance of your most critical metrics with visual threshold crossing indicators to quickly identify and correlate changes in metrics. For more details, see Real-Time Dashboard.
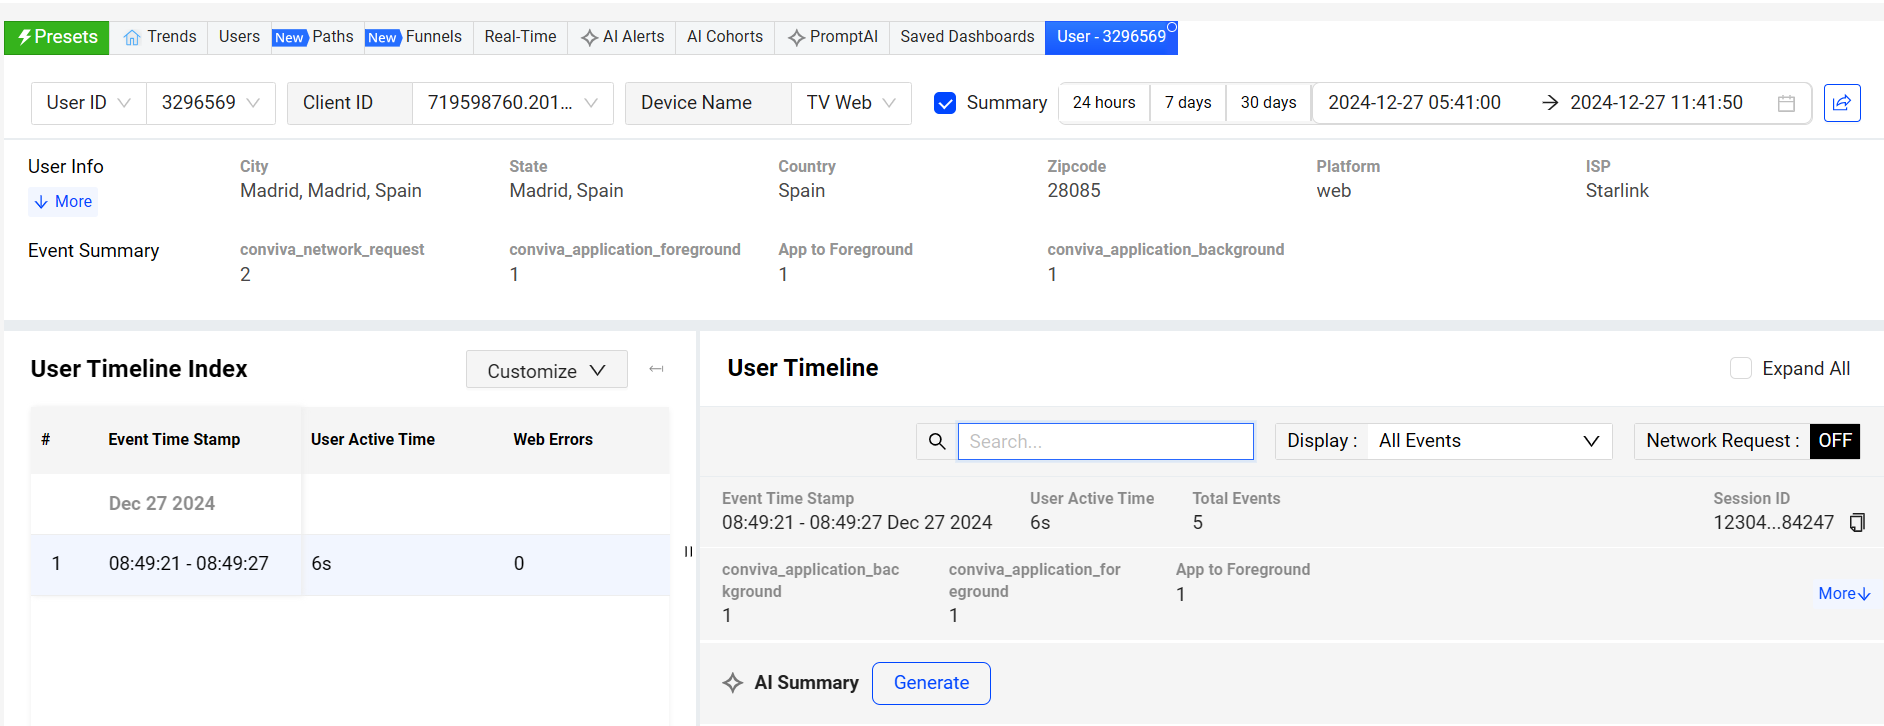
Customer Support Teams view detailed messages of an event time stamp and all events within that time stamp by clicking the time stamp in the User Timeline Index. In the User dashboard, leverage AI-generated summaries of customers' quality of experience to make it easier for agents to engage with them.