
With Activation, build Flows and metrics to efficiently transform application events into measured user journeys (Flows) and actionable user experience insights, connecting user engagement, experience quality, and technical performance.
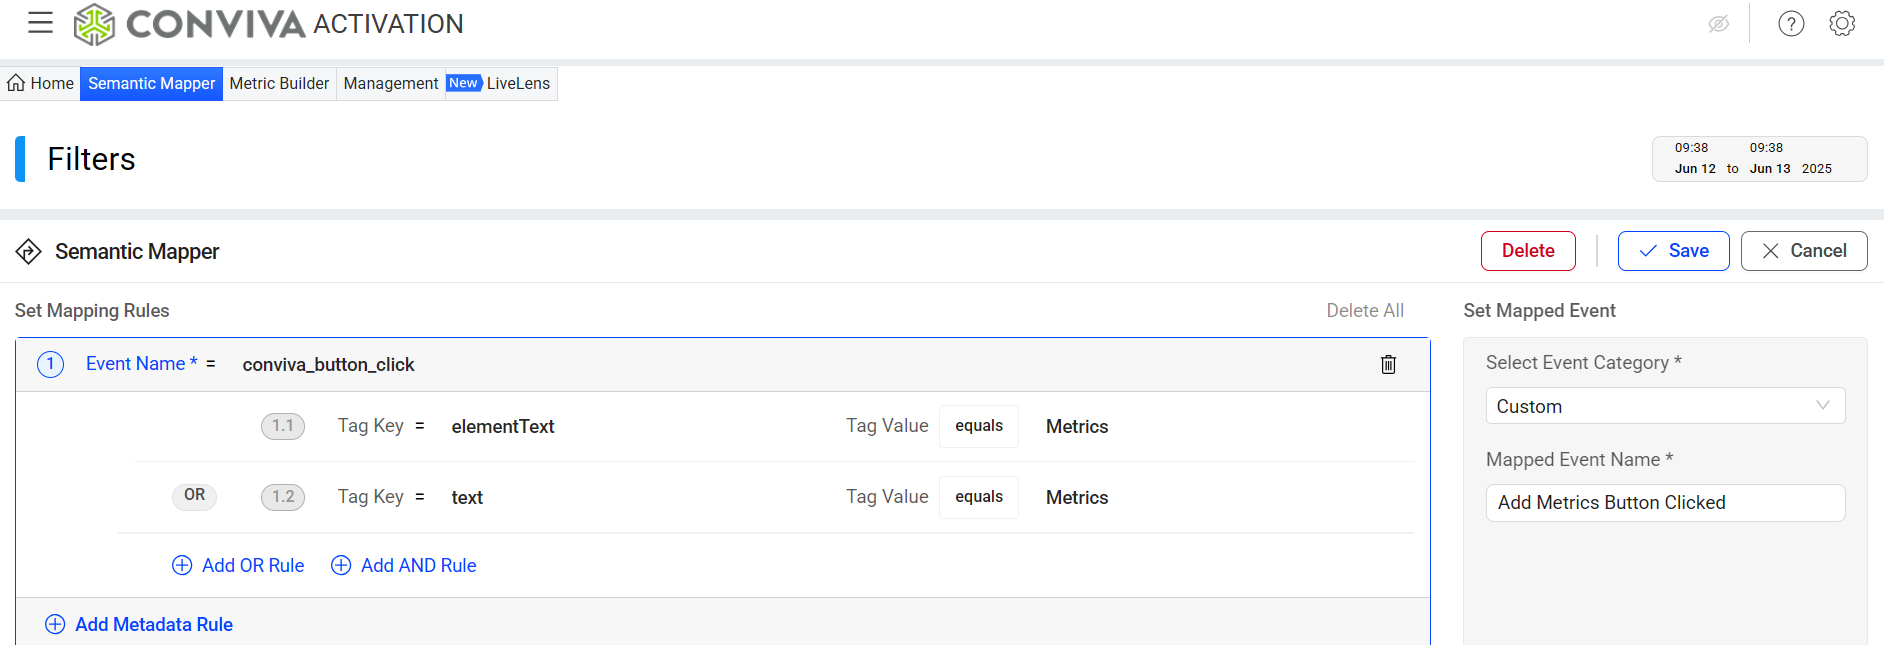
- Semantic Mapper: enables raw event mapping and customization so user actions and activities are easy to analyze. Activation simplifies event organization and identity mapping to help explore and manage the ingested application events for enhanced insights, such as mapping login activities across multiple application platforms to a single login event. After setting up mapping rules, the data pipeline supports continuous mapping, automatically mapping newly added raw events based on the configured mapping rules. For more details, see Map New Events.
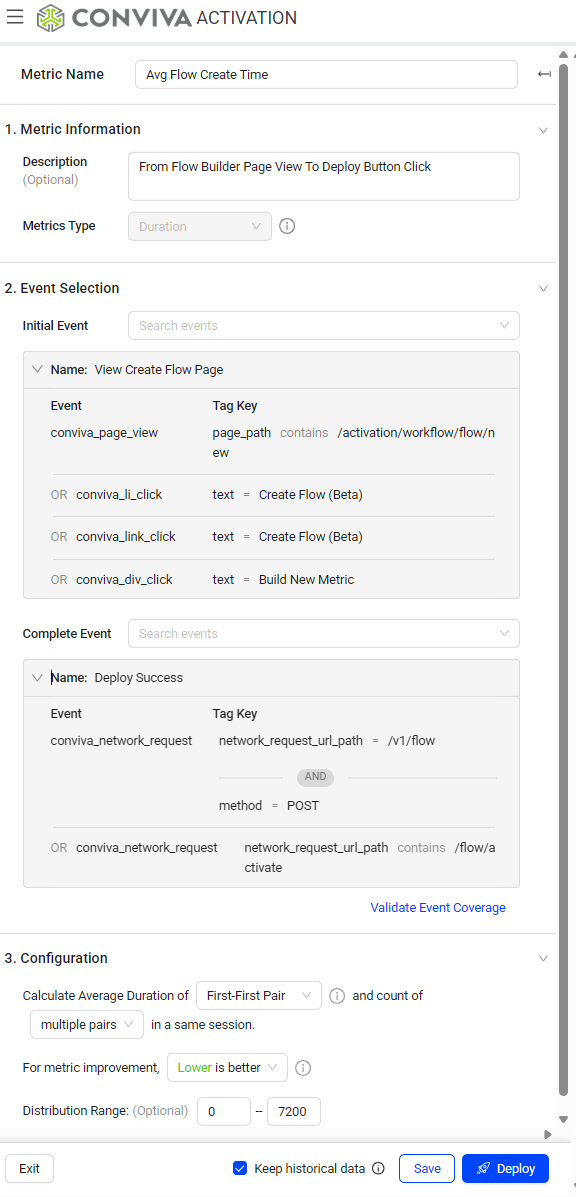
- Metric Builder: enables creating flows and custom metrics associated with specified initial/follow-up events to analyze data for complex user actions and app performance scenarios. Use Conviva predefined metrics for quick metric creation or map raw events with Semantic Mapper for specialized metrics.
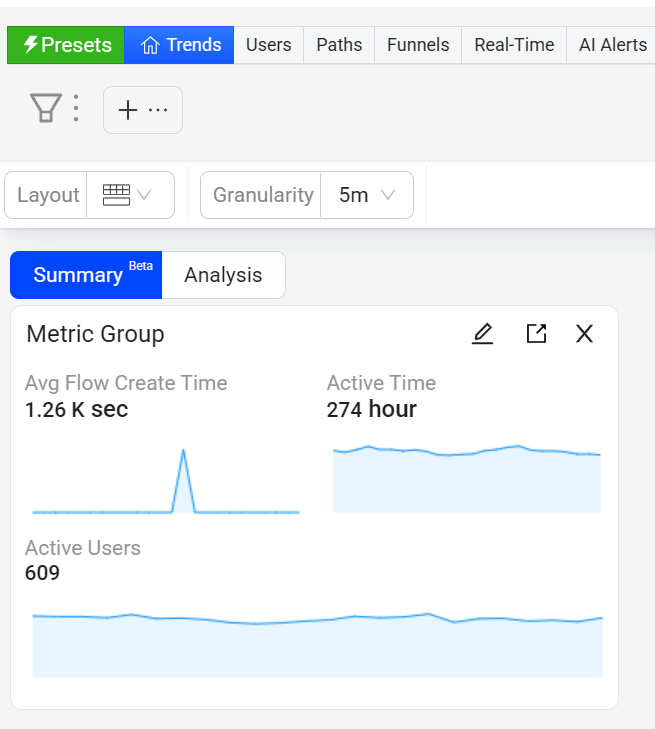
- Flows: captures expected positive user outcomes for specific tasks within an application, such as login, search, or payment. The flow quantifies the success rate, duration and number of attempts of the User Flow. For more details, see Flows.
- Custom Metrics: associates with specified initial/follow-up events to analyze data for complex user actions and app performance scenarios. For more details, see Individual Metrics.
Click to Preview Semantic Mapper
Click to Preview Metric Builder
Click to Preview Flows in Trends
What's New in Activation
Metric Builder: Adds an Option for Additional Dimensions in Flows and Custom Metrics Settings (January 2026)
|
Feature Update:
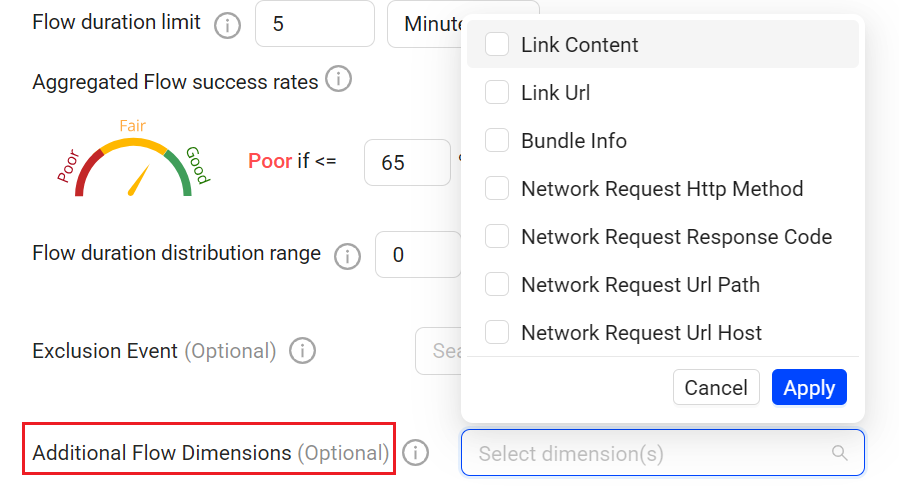
Adds support for additional event-based dimensions, beyond the out-of-box dimensions, for Flows and custom metrics. Specify whether the dimension value is based on the first-observed event value or the last observed event value, enabling more control of the dimensional values for richer analysis of the configured Flows and custom metrics.
Click to expand the image
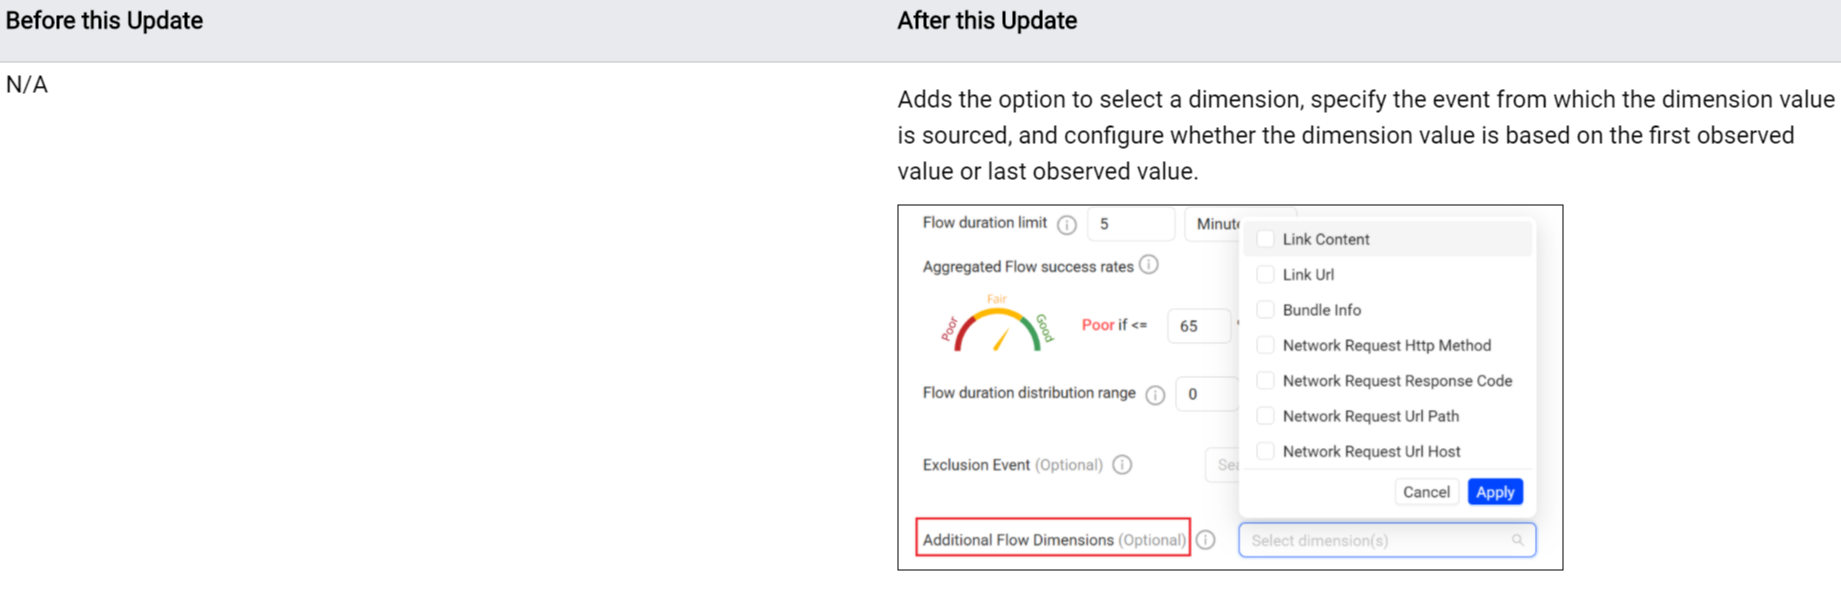
Use Case:
Enhance Checkout Flow analysis with the payment_method dimension.
Use the last observed event as the dimension value as payment_method is reported on intermediate events within the checkout flow from Checkout Start to Receipt Page Viewed, rather than only at the Flow start or complete events.
This enhanced flow-level analysis by payment method enables identification of conversion drop-offs, error patterns, and performance differences based on payment types, supporting more targeted optimization and troubleshooting of the payment processes related to the Flow.
More Details: Flows and Custom Metrics.
Custom Dimension: Promotion of Event Tags to Global Tags (January 2026)
|
Feature Update:
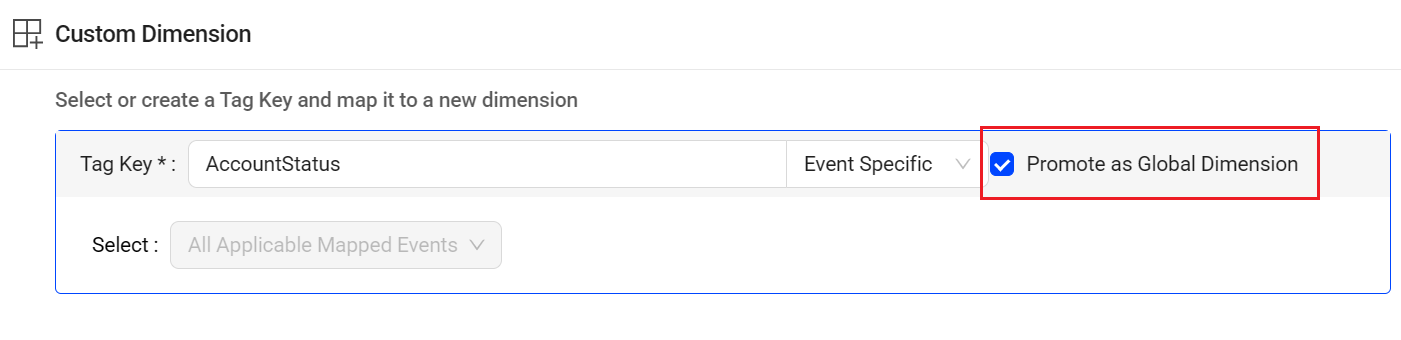
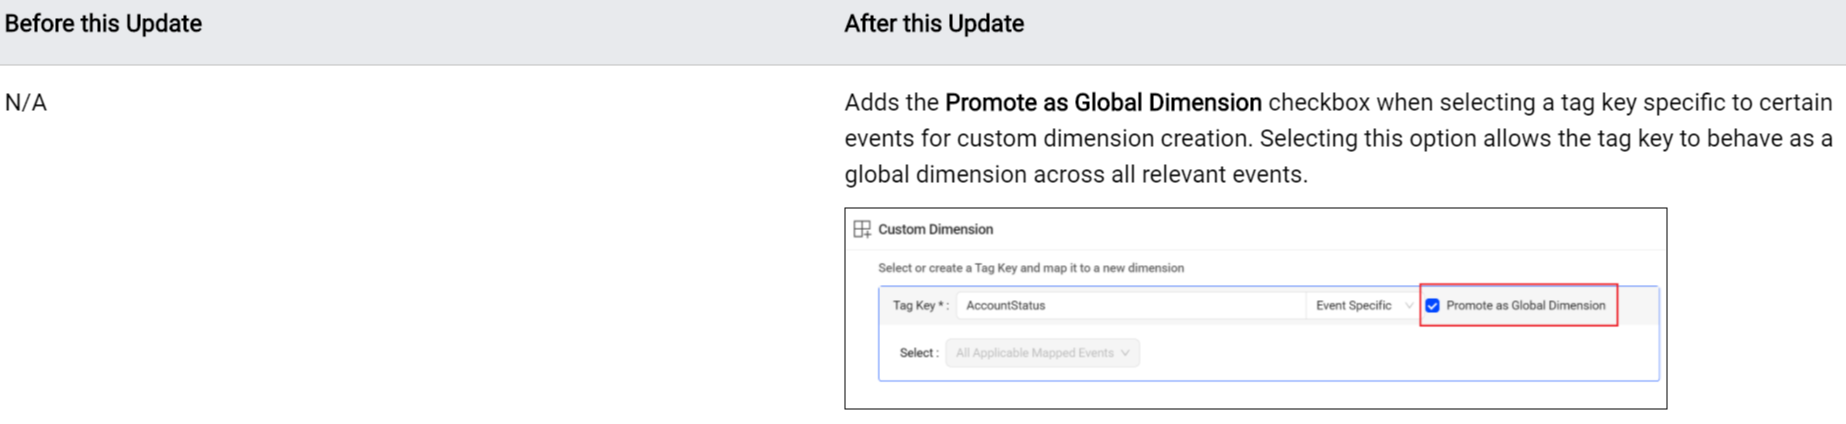
Adds support for promoting event tags as a global dimension across all relevant events, enabling an existing event-level tag to function as a global tag across all relevant events. This update makes it easy to update an event tag to persist across dimensions when a tag represents global context.
Click to expand the image
Use Case:
When adding a custom dimension, promote the AccountStatus tag key as a global dimension to perform dimensional analysis of account-related activity, such as page views, clicks, and purchases, across different account status values, including upsell, silverPlan, and goldPlan.
This enhanced analysis by account status helps identify how user behavior, engagement, and conversion patterns vary across subscription tiers, enabling more targeted optimization and troubleshooting.
More Details: Semantic Mapper.
Activation: Adds a Type Column to the Management Tab (December 2025)

|
Feature Update:
Adds support for displaying the Custom metric type in the Management tab of Activation. This improvement enables quick confirmation of the metric type, such as conversion, interval, and duration, for each Custom metrics while viewing the other metric settings.
Click to expand the image

Use Case:
Quickly confirm a Custom metric type, such as a conversion, interval, or duration metric, to fully understand the type metric data and deployment status.
More Details: Management.
Activation: Enables Management Data Downloads (December 2025)

|
Feature Update:
Adds support for exporting Management data in xlsx format, enabling easier auditing of Activate changes.
Click to expand the image

Use Case:
To quickly group Custom Metrics by different usage patterns, download the data from the Management tab and sort the data in pivot tables.
More Details: Management.
Flow and Metric Creation: Enables Transition Event Exclusion (November 2025)
|
Feature Update:
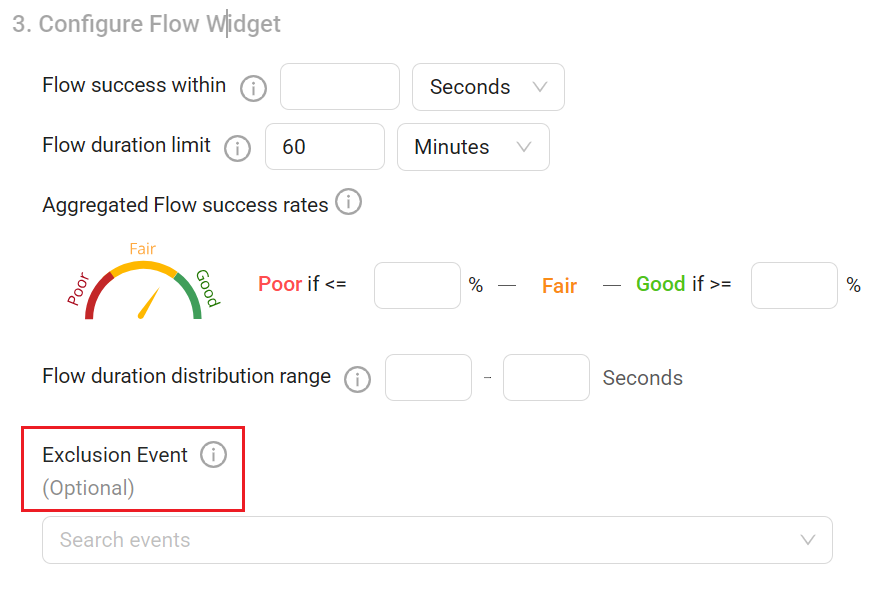
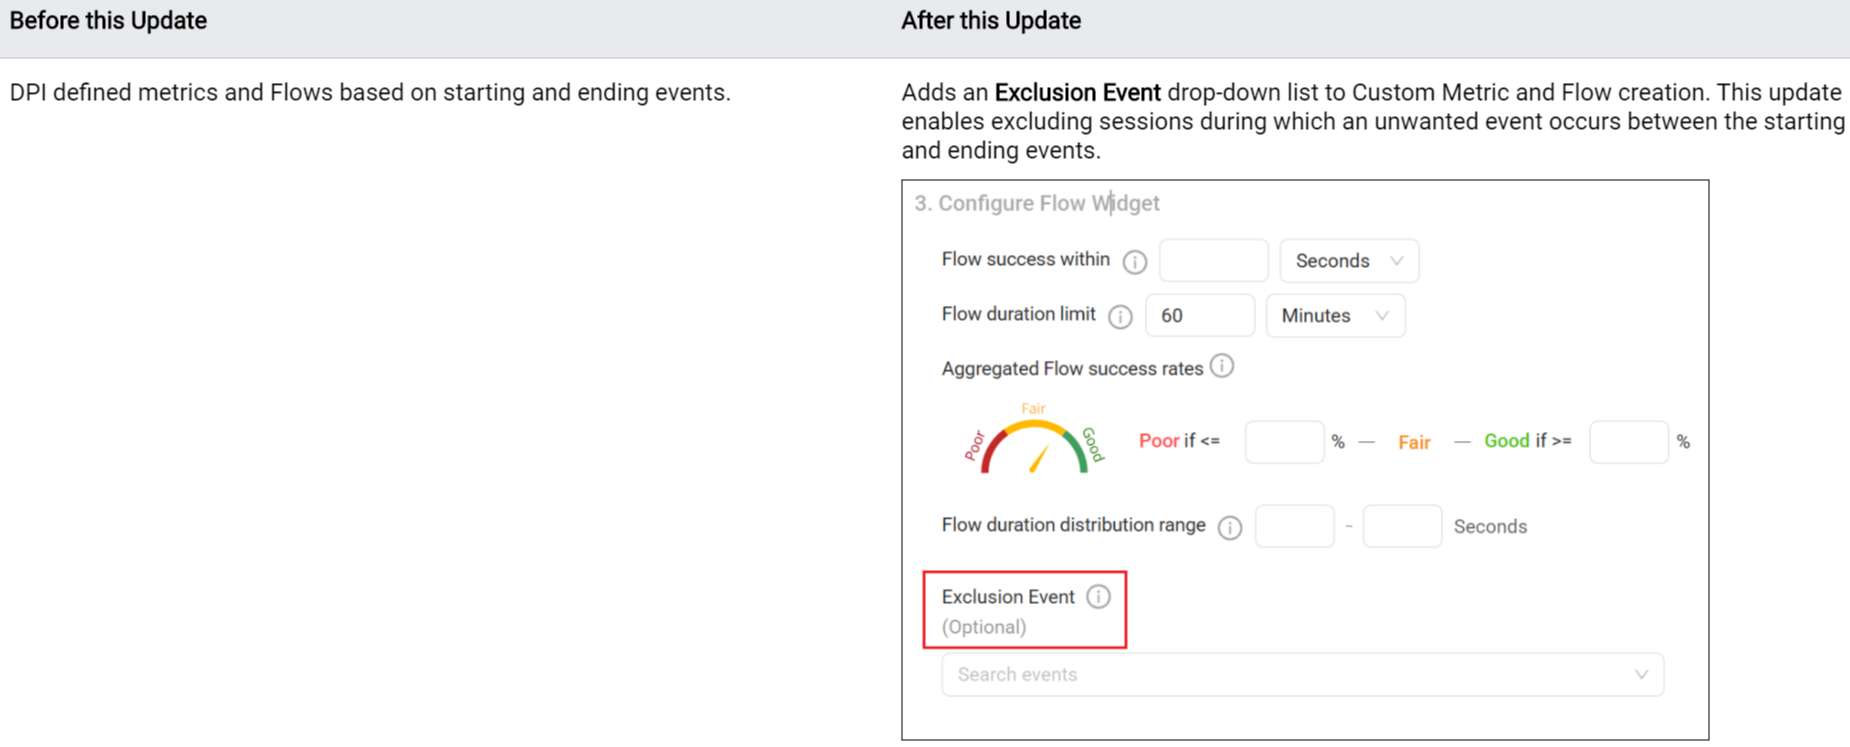
Adds support for excluding transition events, enabling metrics and Flows based on user progression from Event A to Event C, without the occurrence of Event B. This feature enables refined insights based on more selective event progressions that eliminate unwanted transitional events.
Click to expand the image
Use Case:
Define a metric that tracks progressions from event A to event C while excluding sessions during which a transition event B occurs.
For example, measure login start to login success accurately, without considering account creation during the flow that may inflate the duration of login metrics.
More Details: Flows and Custom Metrics.
Metric Creation: Enhances Ratio Metric with Fixed Number as Denominator (November 2025)
|
Feature Update:
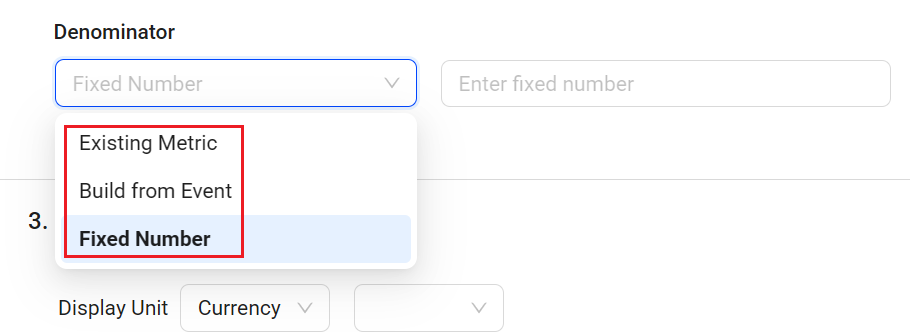
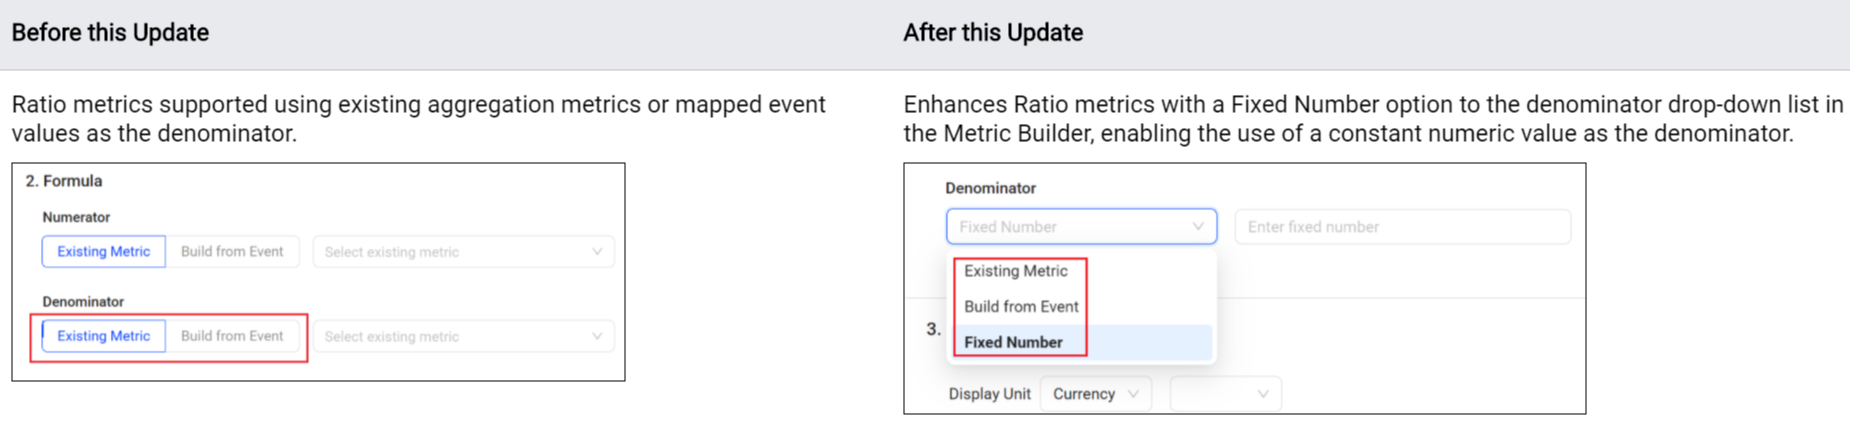
Enhances Ratio metrics to support using a fixed number as the denominator, expanding the flexibility and applicability of Ratio metrics.
Click to expand the image
Use Case:
Use the fixed number as a Ratio metric denominator to create Ratio metrics for analyzing revenue across currencies, such as euros based on U.S. dollar data. Apply the current USD-to-EUR exchange rate as the fixed denominator to calculate the Ratio metric for common currency analysis.
More Details: Custom Metrics.
Individual Metric Builder: Adds Support for Ratio Metrics (October 2025)
|
Feature Update:
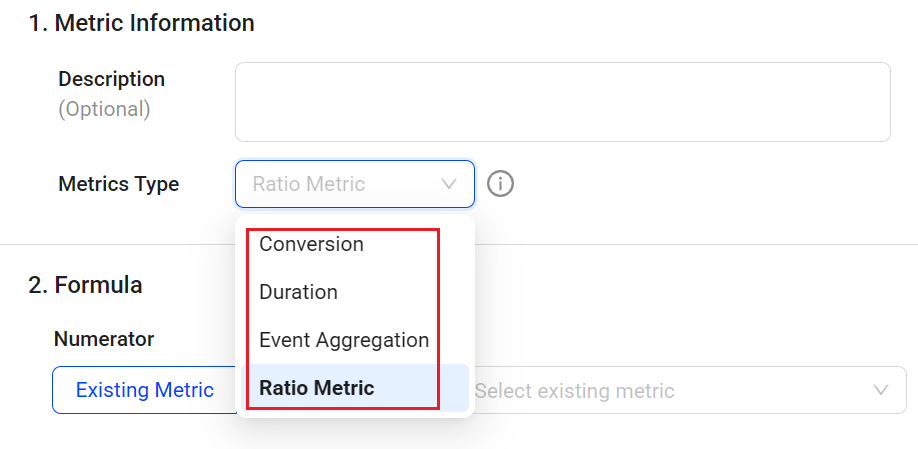
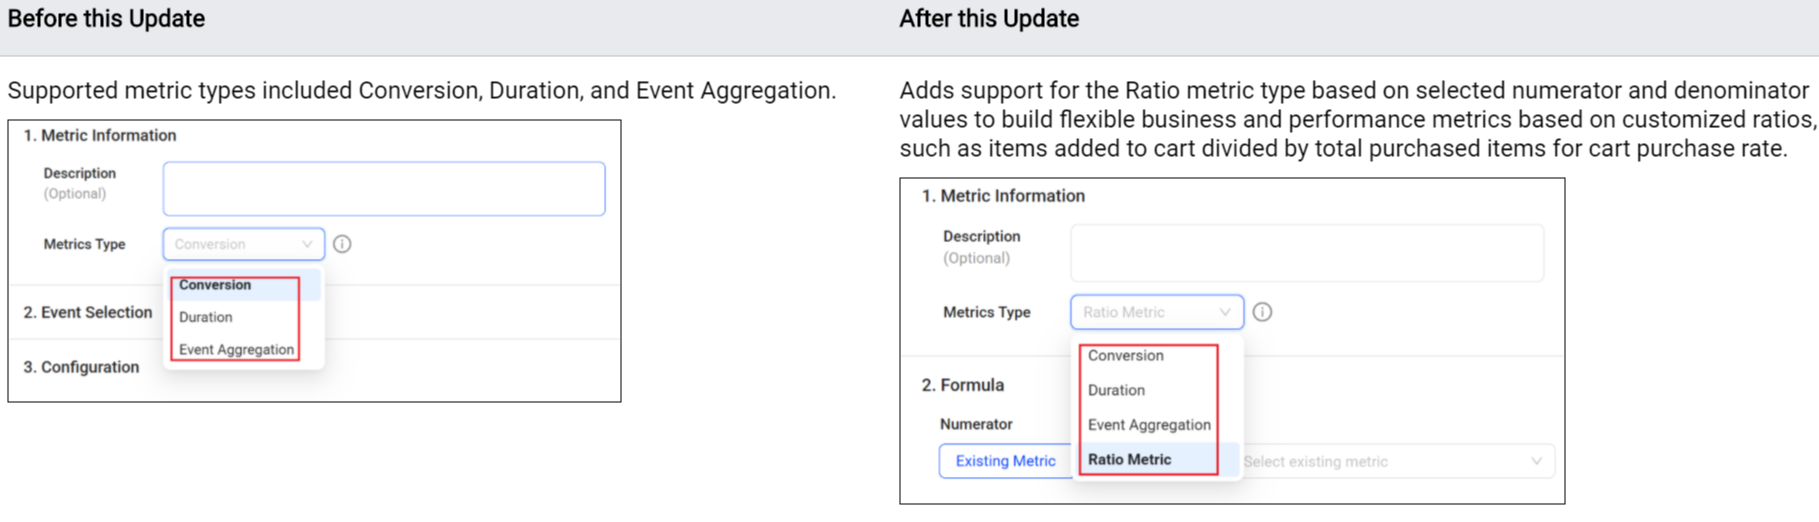
Adds a new Ratio metric type in the Individual Metric Builder to build metrics that display the relationships or proportions using mapped event values and OOB/custom aggregation metric values. The Ratio metric type provides an additional level of analysis in Trends, such as analyzing the rate of how many orders were made relative to how many page visits occurred.
Click to expand the image
Use Case:
Use the Ratio metric type to analyze app performance and user activity based on customized numerator and denominator values to compute rates or averages. For example, to measure the average amount of money a customer spends, create a Revenue Per Paying User metric by selecting the related event and metric to calculate the ratio of Total Revenue to Unique Users, and then view the metric in Trends for dimensional analysis.
More Details: Custom Metrics.
For more details about these and other App updates, see What's New in App.
Individual metrics are associated with specified initial and follow-up events that define the measured start and end points. Use these metrics to analyze data for customized user actions and app performance scenarios, such as analyzing the amount of time spent between login start and completion, and measuring the success rate of cart uploads to completed checkout.
Initial and follow-up event mappings can be defined using Conviva predefined events, custom mapped events, or a combination of both. App enables different types of individual event-based metrics.
Duration Metric: Measures the time interval between two events.
Conversion Metric: Measures the count or conversion rates of events from one stage to another.
Event Aggregation Metric: Measures the number of events, or calculates the value of event attributes.
Create Individual Metrics
Event-based metrics support duration, conversion, and event aggregation type metrics for measuring user experience based on events and event combinations. Create event-based metrics in Trends and Activation.
- Start with the location:
Activation Home Page
Metric Builder
Select metric page in Trends
- Enter the metric name, and provide the metric information.
-
(Optional) Metric description.
- From the Metric Type list, select the desired metric type.
Conversion Metric: Measures the count or conversion rates between events, such as the count of sessions with successful login after opening the login screen to measure the successful login conversion and find highlights to improve user experience.
Duration Metric: Measures the time interval between two events, such as the duration between the login screen event and the login success event to measure login durations and quickly respond to impacting login issues.
Event Aggregate Metric: Measures the number of events, or calculates the value of event attributes, such as the average duration of network requests to measure the network request performance and do optimization accordingly.
-
Identify which events to select:
Check Predefined Events
Predefined events include Conviva predefined events and events that are already mapped. Creating custom metrics based on these predefined events can often save time.
Check the predefined events from the drop-down list for event selection. For example, to analyze the registration process and identify bottlenecks, review the predefined events in the drop-down list. Look for events that indicate the start of registration and successful completion.
For the details of Conviva predefined events, check Out-of-Box Events.
To update predefined events, clone them first, then configure the tag keys and values.Discover New Events with EventLooker and LiveLens
In most cases, predefined events may not fully meet metric creation requirements. Need to map the required events and create metrics based on the newly mapped events.
Use the tools to check raw events and map the events for requirement:
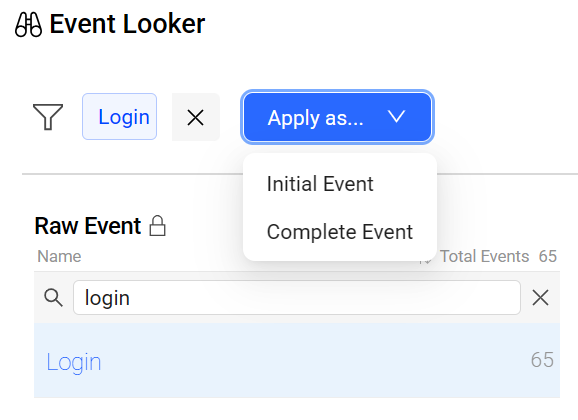
- EventLooker: Allows browsing and searching events and tag keys. Use the drop-down list to apply a selected event.
- LiveLens: Provides real-time event names and tags while interacting with an application. To learn how to use LiveLens, see LiveLens.
-
Select the events based on the Metric Type selection and configure metric details based on the selected metric type.
For Conversion metrics
- Select events:
Initial Event: The initial event as defined previously.
Complete Event: The follow-up event as defined previously. For example, to measure the conversion rate from login start to successful login, select Login Process Start and Login Success.
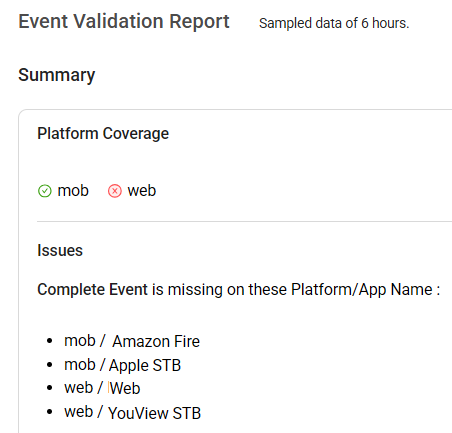
- Use the Event Validation Report to confirm whether the configured events have coverage across the required integrated platforms. Deploy any required uncovered events in Semantic Mapper.
- Configure metric details:
-
3. Select the conversion type, Conversion Rate or Conversion Count.
- Set a criteria for the desired conversion window for the paired events' occurrence per pairing logic.
First-First Pair: Uses the first Initial Event and the first Follow-up Event as a pair.
Last-First Pair: Uses the last Initial Event and the first Follow-up Event as a pair.
Select an option from the drop-down list to define whether a higher or lower metric value is considered positive.
From the Exclusion Event drop-down list, select an event to exclude sessions in which an unwanted event occurs between the starting and ending events.
(Optional) Select one or more dimensions and configure whether the first observed value or last observed value is used as the dimension value.
For Duration metrics
- Select events:
Initial Event: The first event that triggers a particular process or workflow.
Complete Event: A complete event that occurs after the Initial Event. For example, to measure the average duration from login start to successful login, select Login Process Start and Login Success.
- Use the Event Validation Report to confirm whether the configured events have coverage across the required integrated platforms. Deploy any required uncovered events in Semantic Mapper.
- Configure metric details:
-
3. Set pairing logic:
First-First Pair: Uses the first Initial Event and the first Follow-up Event as a pair.
Last-First Pair: Uses the last Initial Event and the first Follow-up Event as a pair.
Set the maximum duration limit.
Select an option from the drop-down list to define whether a higher or lower metric value is considered positive.
(Optional) Enable the Distribution check box and fill out the range.
(Optional) From the Exclusion Event drop-down list, select an event to exclude sessions with an unwanted event between the starting and ending events.
(Optional) Select one or more dimensions and configure whether the first observed value or last observed value is used as the dimension value.
For Event Aggregation metrics
Select the source aggregation event. For example, to measure the total number of application errors, select Application Error.
Use the Event Validation Report to confirm whether the configured events have coverage across the required integrated platforms. Deploy any required uncovered events in Semantic Mapper.
- Configure metric details:
-
Set the value calculation type:
Number: Sets the value to the count of the source events.
Total Values: Sets the value to the sum of the event attribute values.
Average Values: Sets the value to the average or mean of the event attribute values.
Select an option from the drop-down list to define whether a higher or lower metric value is considered positive.
(Optional) Specify the unit of measurement for the collected data.
For Ratio metrics
- Set numerator values using one of the options:
- Select existing aggregation metrics from the drop-down list.
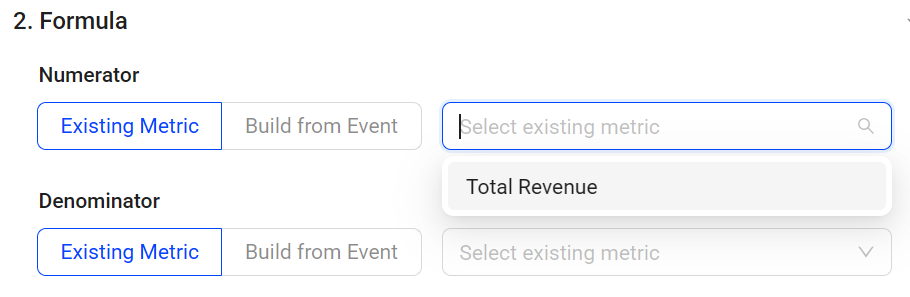
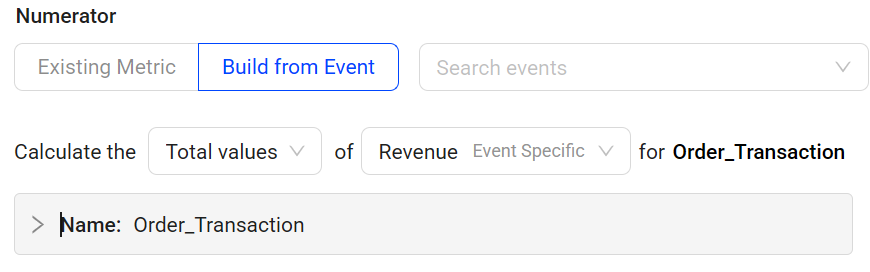
- Build the metric from an event: select a target event, specify the calculation (count, total, or average values), and use the Event Validation Report to confirm coverage.
- Set denominator values using one of the options:
Select existing aggregation metrics from the drop-down list.
Use a fixed number as a denominator: Select Fixed Number from the drop-down list and enter the desired value in the field.
Build the metric from an event.
- Configure metric details:
-
(Optional) Select the required unit from the drop-down list.
- Select an option from the drop-down list to define whether a higher or lower metric value is considered positive.
-
Click Save and Deploy to complete the deployment.
When updating custom metrics, use the Keep historical data checkbox to control whether existing data is retained. Select the checkbox to keep the data, or clear it to remove it. The checkbox is selected by default.The deployment takes several minutes to take effect.
User Flows can be configured to capture user outcomes of a specific task within an application, such as login, search, and checkout. The Flows feature provides a preset dashboard to quantify business KPIs using predefined metrics, such as success rate, duration, inits, and errors, including conversions with errors.
Furthermore, Flows enable different teams, typically restricted to siloed data, to share the same performance data context, connecting business KPIs, user app experiences, and service performance for comprehensive cross-functional analysis.
Flow metadata enables efficient troubleshooting and root cause analysis by capturing flow-specific dimensions, such as:
Business-specific dimensions: For example, credit card type in a payment flow.
Error dimensions: Error reason, error message, and error ID.
Network request dimensions: Endpoint, host, path, and response code.
After creating flows, the corresponding metrics are created automatically.
Flow Metrics
| Metric | Definition |
|---|---|
Flow Name Init (Use the first initial event)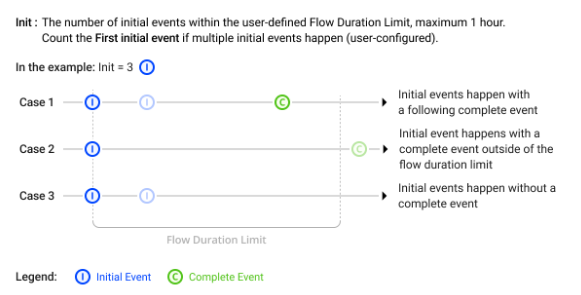 |
The number of initial events within the user-defined Flow Duration Limit, maximum 1 hour. Count the First initial event if multiple initial events happen. |
Flow Name Init (Use the last initial event)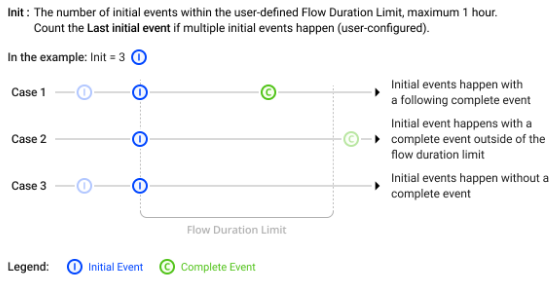 |
The number of initial events within the user-defined Flow Duration Limit, maximum 1 hour. Count the Last initial event if multiple initial events happen. |
Flow Name Complete # %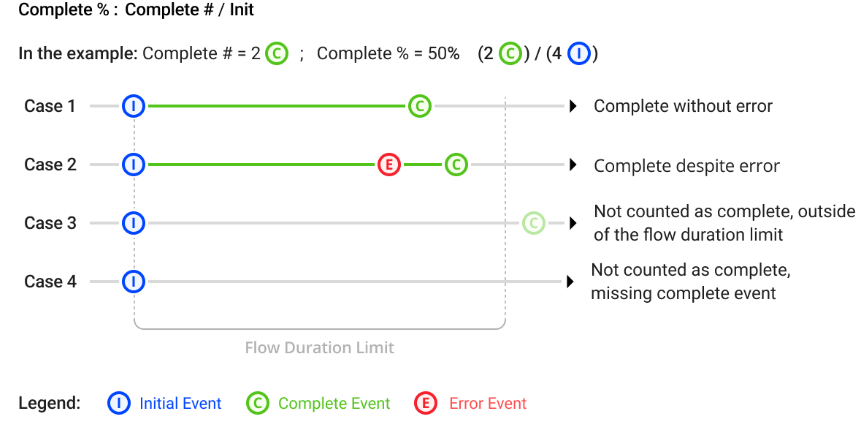 |
Complete #: The number of initial events followed by a complete event within the user-defined Flow Duration Limit, maximum 1 hour. Complete %: Complete # / Init |
Flow Name Avg Complete Duration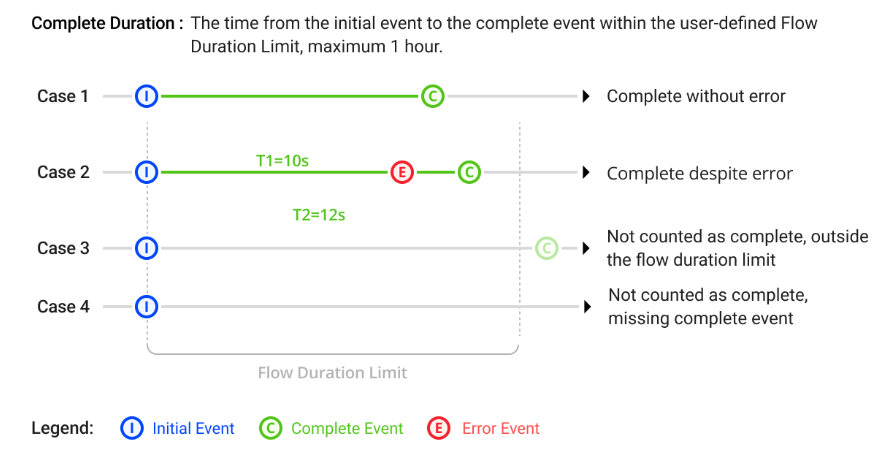 |
The average time from the initial event to the complete event within the user-defined Flow Duration limit, maximum 1 hour. |
Flow Name Success # %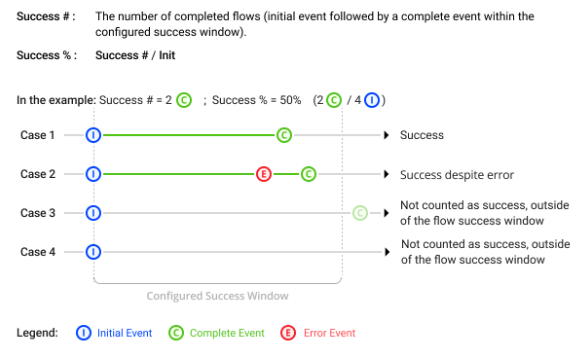 |
Success #: The number of completed flows (initial event followed by a complete event within the configured success window). Success %: Success # / Init |
Flow Name Flows with Errors # %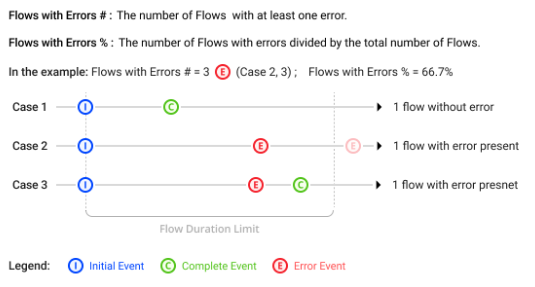 |
Flows with Errors #: The number of Flows with at least one error. Flows with Errors %: The number of Flows with errors divided by the total number of Flows. |
Flow Name Abandoned Flows # %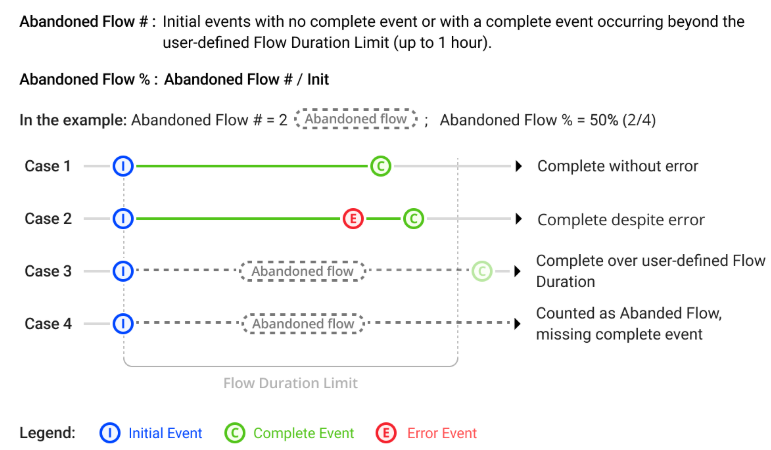 |
Abandoned Flows #: Initial events with no complete event or with a complete event occurring beyond the user-defined Flow Duration Limit. Abandoned Flows %: Abandoned Flow # / Init |
Flow Name Abandoned Flows with Errors # %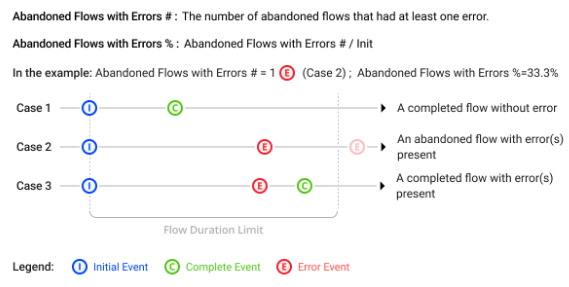 |
Abandoned Flows with Errors #: The number of abandoned flows that had at least one error. Abandoned Flows with Errors %: Abandoned Flows with Errors # / Init |
Flow Name Completed Flows with Errors # %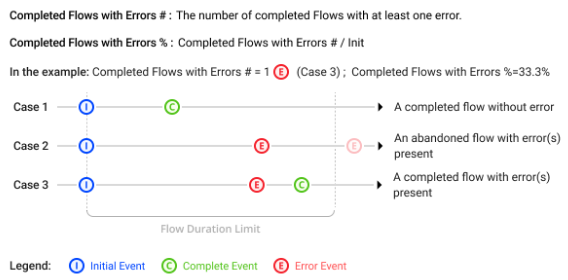 |
Completed Flows with Errors #: The number of completed Flows with at least one error. Completed Flows with Errors %: Completed Flows with Errors # / Init |
Flow Name Total Error Count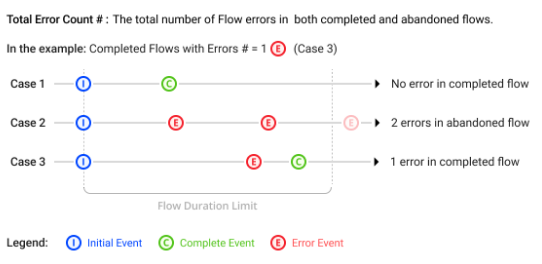 |
The total number of Flow errors in both completed and abandoned flows. |
Flow Name Errors in Abandoned Flows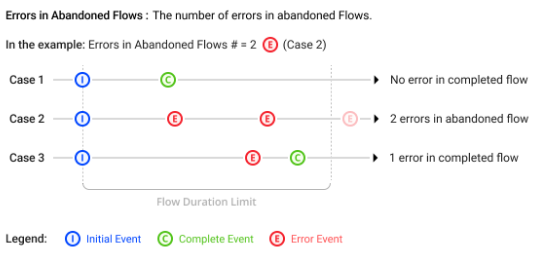 |
The number of errors in abandoned Flows. |
Flow Name Errors in Completed Flows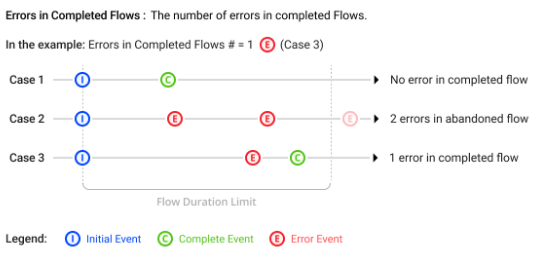 |
The number of errors in completed Flows. |
Flow Name Network Request Avg Duration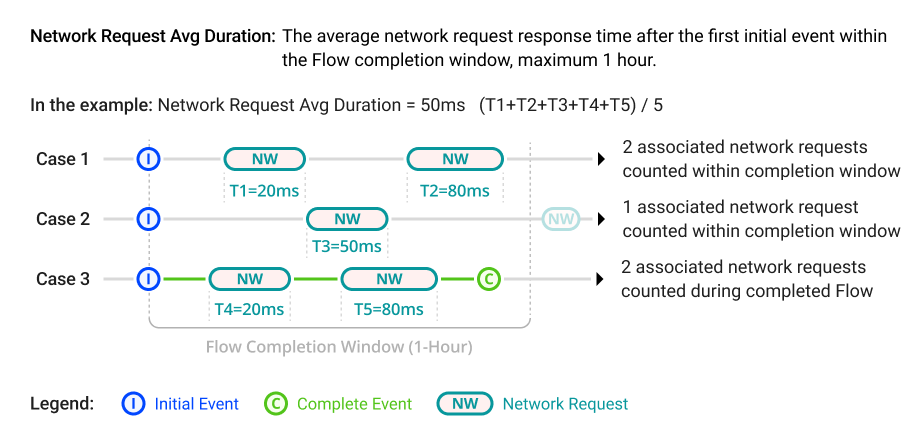 |
The average network request response time after the first initial event within the Flow completion window, maximum 1 hour. |
Flow Name Network Request Failure # %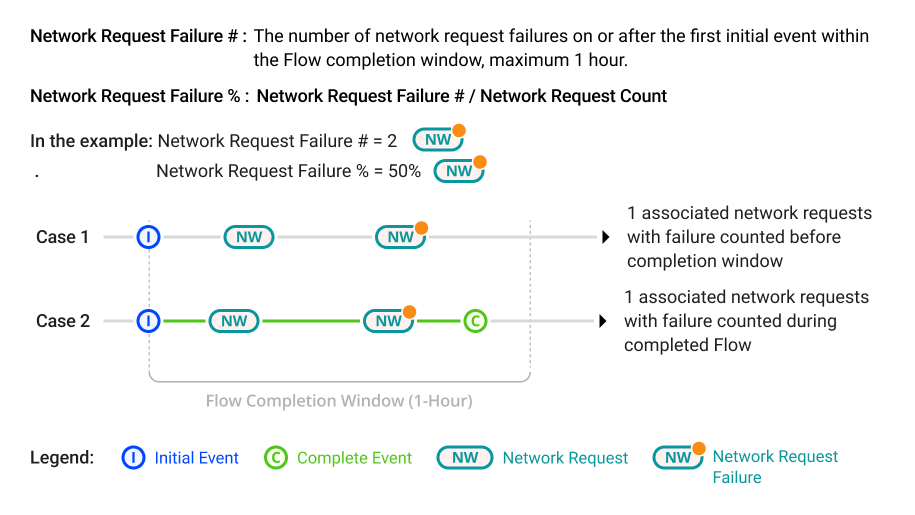 |
Network Request Failure #: The number of network request failures on or after the first initial event within the Flow completion window, maximum 1 hour. Network Request Failure %: Network Request Failure # / Network Request Count |
Flow Name Network Request Count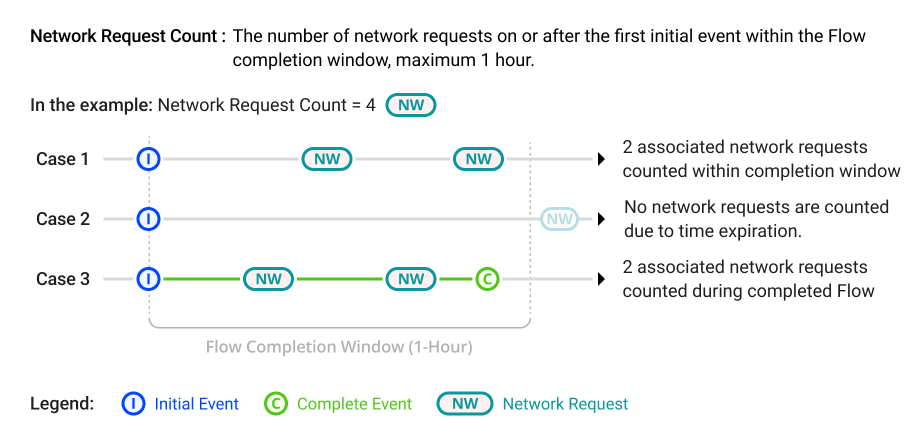 |
The number of network requests on or after the first initial event within the Flow completion window, maximum 1 hour. |
Follow these steps to create flows.
Create Flows
- Start with the location:
Activation Home Page
Metric Builder
Flow Widget in Trends
- Enter the flow name, description, and labels.
-
Flow name. For example, to track the journey starting from clicking the play button and ending with successful video playback, enter 'Initiate video playback'.
(Optional) Flow description.
(Optional) Labels. Enter Flow labels to clarify the Flow use in the UI. For example, enter Payment to label Flows related to the payment process. Flows with labels are grouped by labels in the Overview dashboard.
-
Identify which events to select.
Check Predefined Events
Predefined events include Conviva predefined events and events that are already mapped. Creating custom metrics based on these predefined events can often save time.
Check the predefined events from the drop-down list for event selection.
To update predefined events, clone them first, then configure the tag keys and values.Discover New Events with EventLooker and LiveLens
In most cases, predefined events may not fully meet metric creation requirements. Map the required events and create metrics based on the newly mapped events.
Use the tools to check raw events and map the events for requirement:
- EventLooker: Allows browsing and searching events and tag keys. Use the drop-down list to apply a selected event.
- LiveLens: Provides real-time event names and tags while interacting with an application. To learn how to use LiveLens, see LiveLens.
-
Select events that signal the start and end of a user flow.
- Initial Event: signals the start of the user flow in the app.
When a network request is set as an initial event in a Flow and the Flow complete event occurs very close to the initial event, the Flow conversion data may be impacted.- Complete Event: signals the positive outcome of a user flow in the app. For example, a Page View of Payment Acknowledgement Page or Network Requests with response code indicating payment success.
-
Use the Event Validation Report to confirm whether the configured Flow events have coverage across the required integrated platforms. Deploy any required uncovered events in Semantic Mapper.
-
(Optional) Set experience and performance settings.
Error Event: includes errors that matter in the defined flow. Select error events from the drop-down list, or add them using the Event Looker Tool. Conviva presets default errors, such as "5xx server error" and "app crash".
Network Request: associates the network request with a flow. Click +Add Network Request, define the list of Host and Path that represent service and APIs running underneath the flow.
Based on above association, below metrics and dimensions are available in Flow preset dashboard. Dimensions: Network Request Endpoint, HTTP Method, Response Code, URL Host, and URL Path. Metrics: Network Request Avg Duration, Network Request Failure, and Network Request Count. -
Configure Flow Widget, such as time constraint and distribution range.
Set the success time boundary which determines flow success.
Set the Flow duration limit.
Set the percentage thresholds to determine whether the success rate is considered Good or Poor.
Define the expected value range for durations to display on the distribution chart.
(Optional) From the Exclusion Event drop-down list, select an event to exclude sessions with an unwanted event between the starting and ending events.
(Optional) Select one or more dimensions and configure whether the first observed value or last observed value is used as the dimension value.
-
Click Save and App creates the corresponding metrics automatically.
When updating flows, use the **Keep historical data** checkbox to control whether existing data is retained. Select the checkbox to keep the data, or clear it to remove it. The checkbox is selected by default. -
Click Deploy to use the metrics for analysis on the Trends dashboard.
A flow can span multiple sessions as long as the time between sessions does not exceed the 5-minute inactivity timeout window and the overall duration is within the 1-hour flow completion window.
The Semantic Mapper tab provides functionality to map raw events to clearly identifiable user behaviors, block unnecessary events from the sensor, create custom dimensions with values extracted from events, and semanticize page/screen titles.
For example, map raw events using tag key/values, such as the screen_view raw event with tag key screen_name and tag value login_page, to build meaningful specific events for metric creation.
The Semantic Mapper also leverages backend-driven event management and remote mapping to enable event mapping and updates with minimal front-end effort.
Map New Events
This option provides a comprehensive mapping process that enables step-by-step definition and configuration of semantic events.
Explore the Events
The Semantic Mapper page allows the viewing of common events and exploring which events require mapping.
To access the Semantic Mapper page, from the App, select Activation.
To view the unmapped events in the specific time range, in the time range bar, select the desired time range.
Check the unmapped events and confirm which unmapped event requires mapping based on these points:
Consolidate event names to simplify event recognition.
Group related events to optimize event presentation and correlate app activities.
For example, the event screen_view does not indicate which kind of screen viewers viewed. Map the event with the tag key screen_name and the tag value login_welcome to Login Screen View. This mapping assists in clearly identifying and analyzing a viewer behavior when the viewer views the login screen.
When using Semantic Mapper to map events displayed in LiveLens, keep in mind that some event tag keys names may have slight variations.
| Predefined Tag Key Name in LiveLens | Tag Key Name in Semantic Mapper |
|---|---|
| Button Click Element Text | buttonClickText |
| Button Text | conviva_button_click / elementText |
| Duration | requestDuration / duration |
| Screen Title | pageTitleAndScreen / conviva_screen_view |
| Page Url | pageUrl |
| Page Title | pageTitle / conviva_page_view / page_title |
| Link Click Element Target | linkClickTarget |
| Link Target | conviva_link_click |
| Target Url | requestTargetUrl / targetUrl |
| Previous Screen Title | previousScreen |
| Network Request Response Code | requestResponseCode / responseStatusCode |
- Confirm the event tag key and event tag value for the event which will be mapped.
-
To filter all data related with the event, from the dimensional list, click the event.
From the drop-down list, select Event Tag Key, and then click the specific item of tag key.
From the drop-down list, select Event Tag Value to view all the tag values of the event tag key.
Set Mapping Rules and Deploy Mapped Events
After confirming the event that needs to be mapped, and the related event tag key and event tag value, set mapping rules for mapping events.
To access the page, click +Map New Event from the main page.
Fill up the fields in Set Mapping Rules by using one of the options:
If there are previously explored events using the mentioned steps, click Map This to set the rules automatically. When setting the tag value, there are several conditions and rule options available, such as "contains", "not contains", "equals", "not equals", "is empty", "is not empty", "starts with", and "ends with", as well as "or" and "and" rules.
If there is a clear understanding of the events that need to be mapped, from the drop-down list of Event Name, Tag Key and Tag Value, select the event name, tag key and tag value, or fill them out directly. For example, select screen_view, screen_name, and login_welcome.
Select a suitable category and type the event name in the Set Mapped Event field. For example, use Login Screen View as the mapped name and select Login/Logout.
Click Save.
On the Semantic Mapper page, click Deploy, select the specific items on the Deployment Confirmation page, and click Deploy.
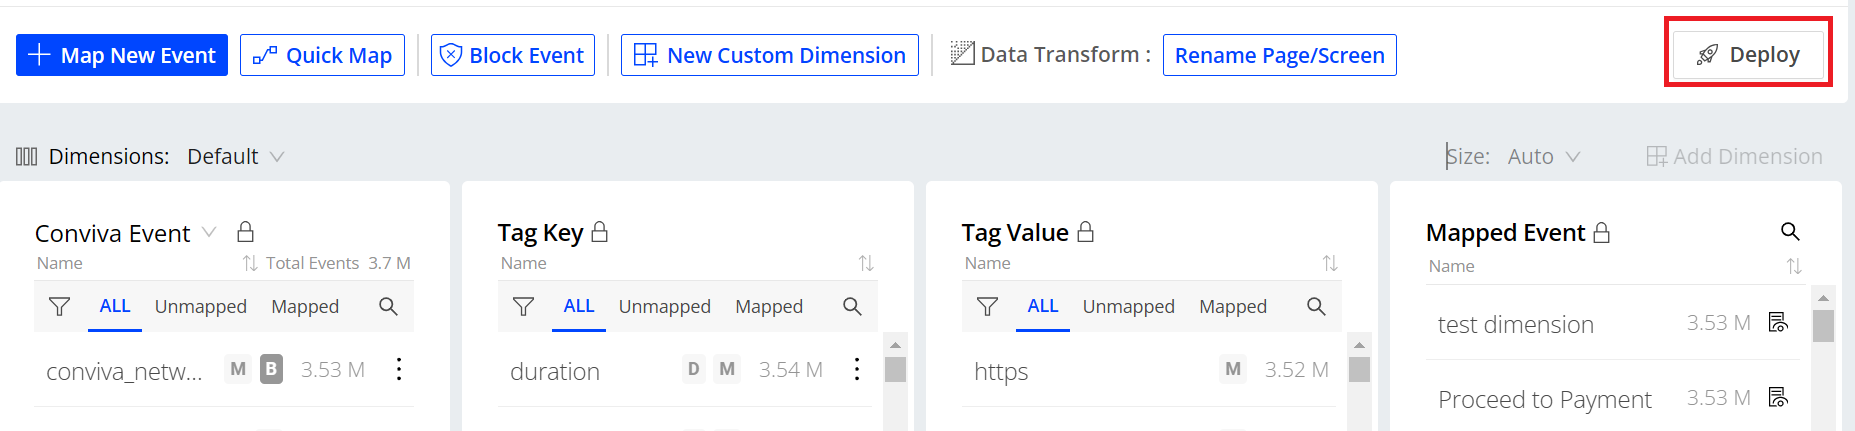
- After deploying, check the total number of the mapped events on the Semantic Mapper page.
Block Event
App enables intelligent data collection to block the reporting of irrelevant or meaningless events from the sensor, ensuring the accuracy and relevancy of data.
To access the Block Event page, click Block Event from the main page.
On the "Set Block Rules" section, from the "Block Event Name" drop-down list, select the event that needs to be blocked. For example, choose conviva_network_request.
To set block rules, choose one of the options based on the requirements.
To block all the events selected in step 2, select Block All.
To block the specific events based on the events selected in step 2, select Block if…, and fill out the key values that the specific event owns. Add multiple block rules for different specific events by clicking Add OR Rule.
- To apply the block rules, click Block Event from the top right corner.
Create Custom Dimensions
Custom dimensions are extracted from event keys to provide enhanced levels of dimensional analysis in Trends dimension tables and AI alerts. With custom dimensions, analyze application performance and user behaviors more efficiently and flexibly.
Create custom dimensions with values extracted from events to enhance analysis of application performance and user behaviors, such as a dimension value extracted from only the play start and play end events.
Manage custom dimensions along with events in the Management page.
For example, create a custom dimension based on the Player Name event tag key and select mapped events to determine the dimension values.
Click New Custom Dimension.
Select a tag key from the drop-down list or enter it directly. The label next to the tag key indicates how it is collected:
Event-Specific Tag: The tag is only reported by certain events.
Global Tag: The tag is reported on all events as part of the global context.
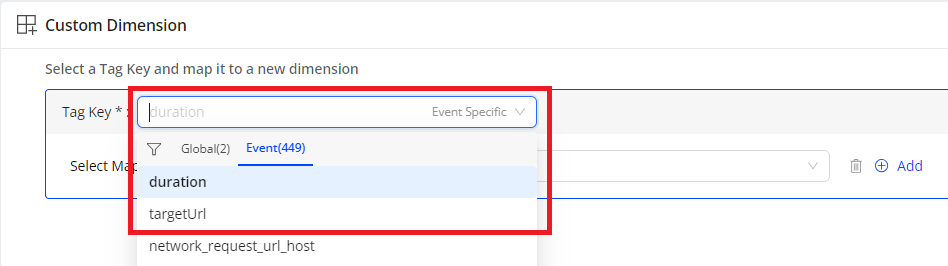
- Configure tag keys based on tag type. Global Tags:
For persistent tag keys, select the tag key collected as global context to treat the tag as a global dimension.
Event-Specific Tags
For tag keys collected only on specific events:
Select All applicable events to compute the custom dimension value using every event that reports the tag key.
Select Specific Mapped Event to compute the custom dimension value using only explicitly selected mapped events.
In the Set Custom Dimension field, set the dimension name.
In the Trends dashboard, click + Dimension from the Dimension table and check whether the created dimension is in the Custom list.
(Optional) To edit a custom dimension, go to the Management tab or the Semantic Mapper tab.
The Management tab allows the effective data management such as metrics and events, including tasks for searching, reviewing, deleting, and deploying/undeploying to support performance monitoring goals. The tab also allows multiple selections of metrics, custom dimensions, and mapped events for deployment, undeployment, and deletion. Click Download for exporting Management data in xlsx format, enabling easier auditing of Activate changes.
Metrics
Custom metrics are created based on mapped events. With custom metrics, analyze application performance and user behaviors more efficiently and flexibly.
The Metrics tab provides easy access to review created custom metrics and associated details such as status, mapped events, and user updates.
Searching Custom Metrics
To quickly find a custom metric, enter a portion of its name. For a more refined search, select the Show Filters check box and select the filter conditions to match the desired metrics.
Mapped Events
Use the Mapped Events table to easily review the current mapped events names and associated details such as status, category, and related metrics. Perform various management actions to optimize the mapped events, such as undeploying and deleting unused events.
Searching Mapped Events
To quickly locate a mapped event, simply enter part of its name.
For a more refined search, select the Show Filters check box and select the filter conditions to match the desired events.
Editing Mapped Events
If the mapped event is unsuitable, directly update the mapped event in the Management tab.
Find the mapped event that needs to be modified and click its name.
The pop-up window displays event details. Click Edit, edit the event, such as the name, category, and mapping rules, and click Save Changes.
Custom Dimension
Custom dimensions are extracted from event keys to provide enhanced levels of dimensional analysis in Trends dimension tables and AI alerts. With custom dimensions, analyze application performance and user behaviors more efficiently and flexibly.
With the Custom Dimension, easily review created custom dimensions and associated details such as status, mapped tag keys, and updates made by users. Perform various management actions such as deploying or undeploying each dimension, as well as editing and deleting these dimensions. Create custom dimensions using Semantic Mapper.
Searching Custom Dimensions
To quickly find a custom dimension, enter a portion of its name.
Editing Custom Dimensions
To make updates to a custom dimension, such as modifying its name or tag key:
Locate the custom dimension that needs to be edited.
To access the pop-up window for editing, click the custom dimension name.
In the pop-up window, click Edit, make the necessary changes, and click Save Changes.
Cloning Metrics, Dimensions, and Events
To simplify the process of creating metrics, dimensions, and events similar to existing ones, start with a clone of an existing settings and modify only the required changes.
- Click the Clone icon in:
Tables for the Metrics, Custom Dimensions, and Mapped Events in the Activation dashboard Management tab
Metric, Custom Dimension, or Mapped Event Details pages
- Click Save to apply the updates.
LiveLens helps find accurate event names and tags in real time while using the application, supporting preparation for event mapping and metrics building.
For example, raw events occurring during a web application login, such as authentication API calls, login button clicks, or success tokens, can be identified as critical login process milestones. Using the Semantic Mapper, these raw events can then be mapped to create metrics monitoring the login process duration.
Exploring Events in Real Time
With LiveLens, efficiently explore application events that occurred to monitor the event flows (initial and follow up events) that can be used to create the most meaningful and actionable metrics.
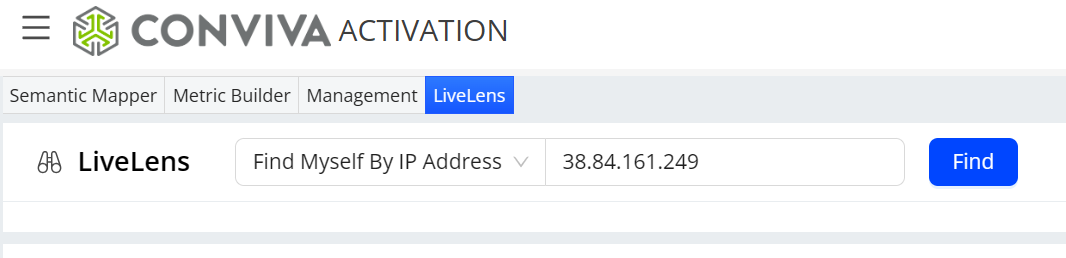
From the App menu, click Activation, then click the LiveLens tab on the Activation page to access the LiveLens page.
Locate the device running the application in which events will be monitored.
Find Myself By IP Address: If App and the device running the application are on the same network, the current IP address is automatically fetched by LiveLens.
Find Myself By User ID: Use the user account ID to locate the device.
Find Myself By Client ID: Use the client ID to locate the device.
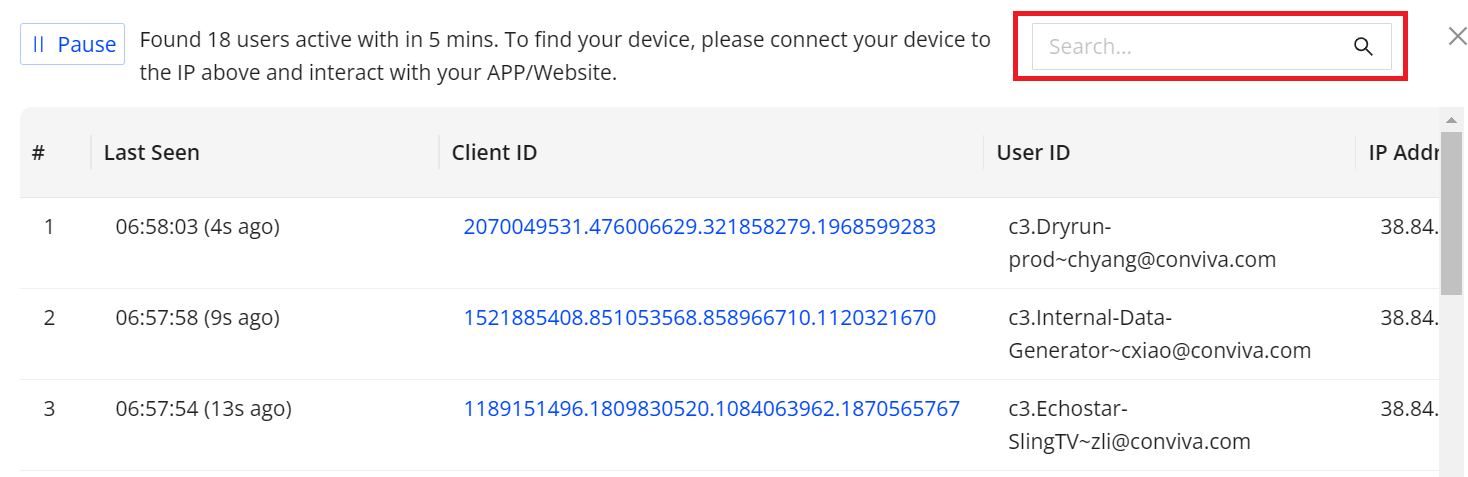
- Locate the active user from the pop-up table and click the client ID to open the Real-time Timeline area for that user.
- Explore the events in the Real-time Timeline area.
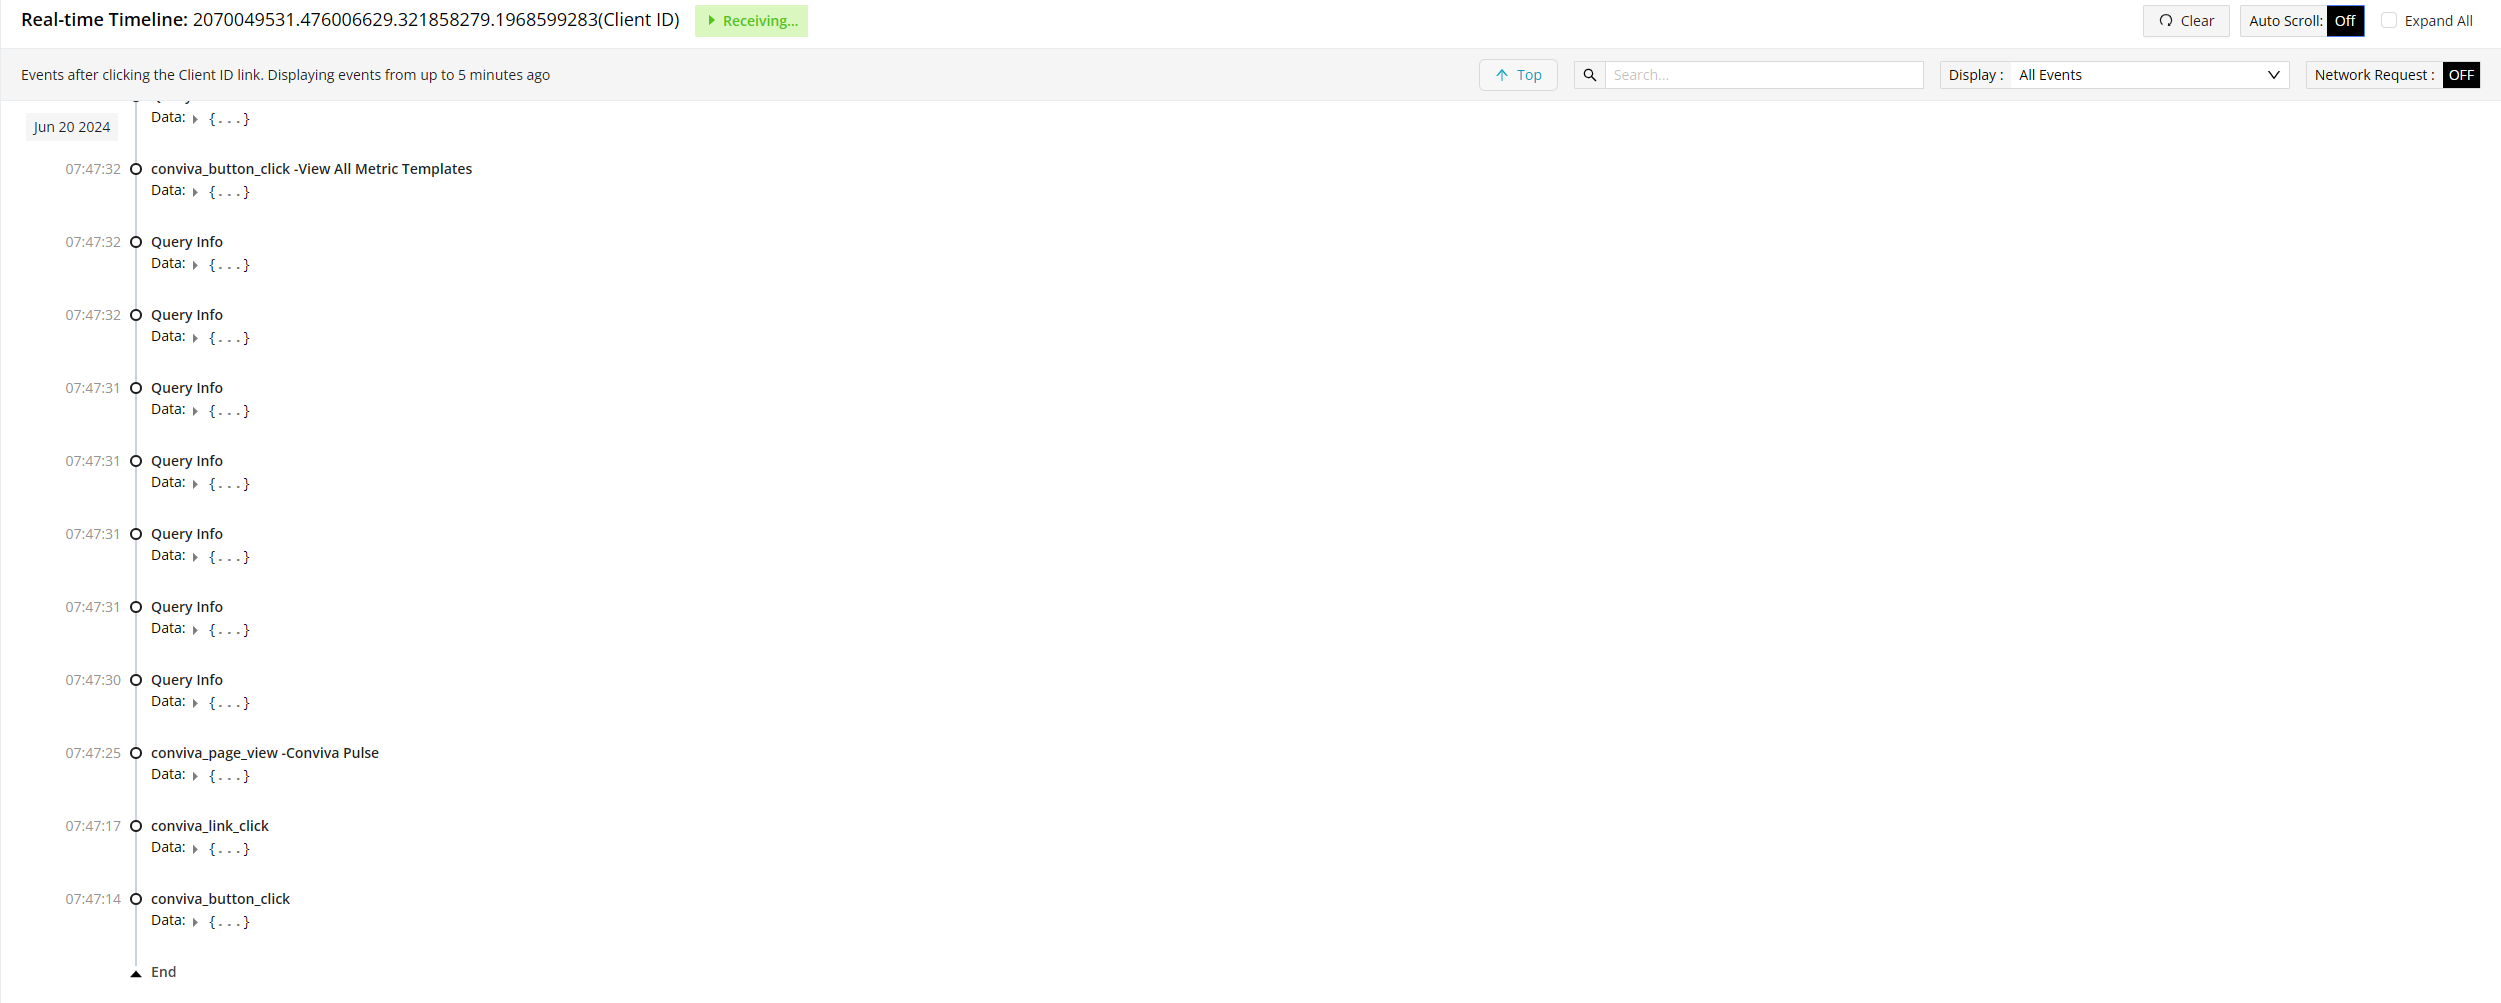
Click the Data Expander to display the data details. The details are useful for mapping events.
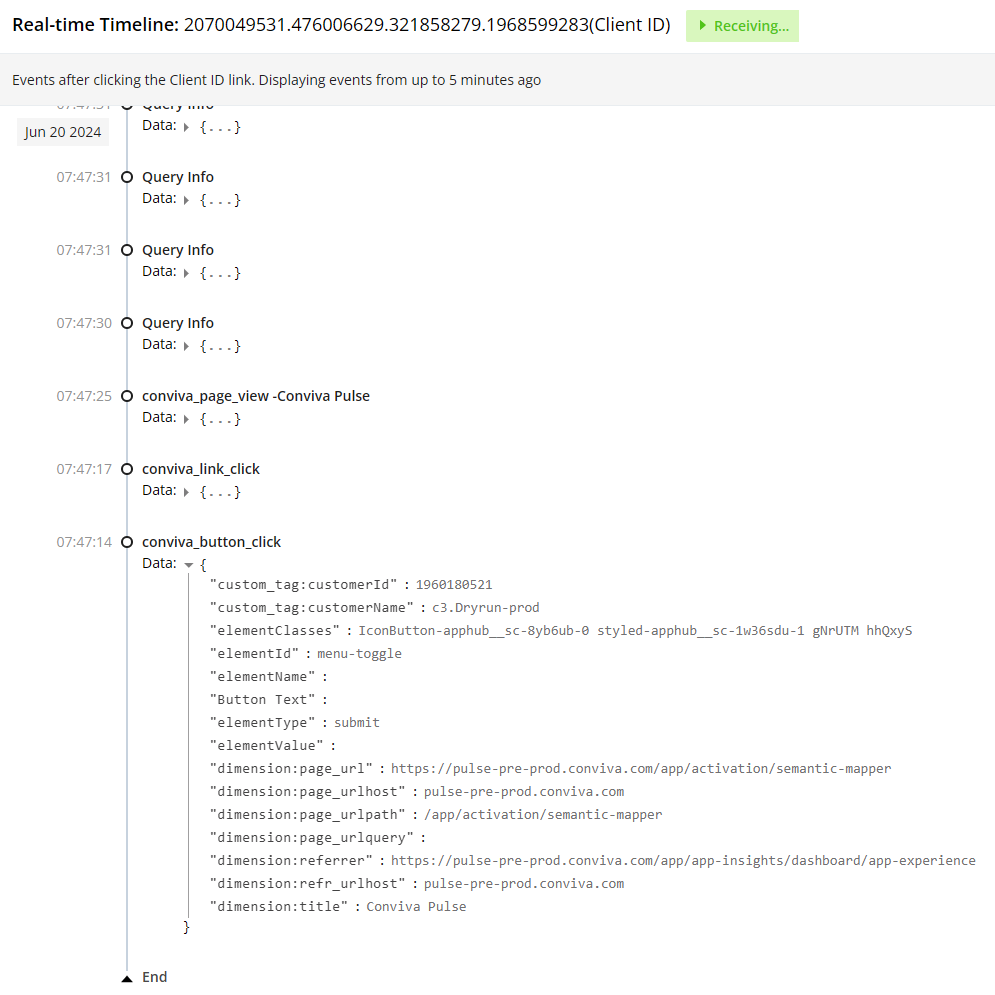
When using Semantic Mapper to map events displayed in LiveLens, keep in mind that some event tag keys names may have slight variations.
| Predefined Tag Key Name in LiveLens | Tag Key Name in Semantic Mapper |
|---|---|
| Button Click Element Text | buttonClickText |
| Button Text | conviva_button_click / elementText |
| Duration | requestDuration / duration |
| Screen Title | pageTitleAndScreen / conviva_screen_view |
| Page Url | pageUrl |
| Page Title | pageTitle / conviva_page_view / page_title |
| Link Click Element Target | linkClickTarget |
| Link Target | conviva_link_click |
| Target Url | requestTargetUrl / targetUrl |
| Previous Screen Title | previousScreen |
| Network Request Response Code | requestResponseCode / responseStatusCode |
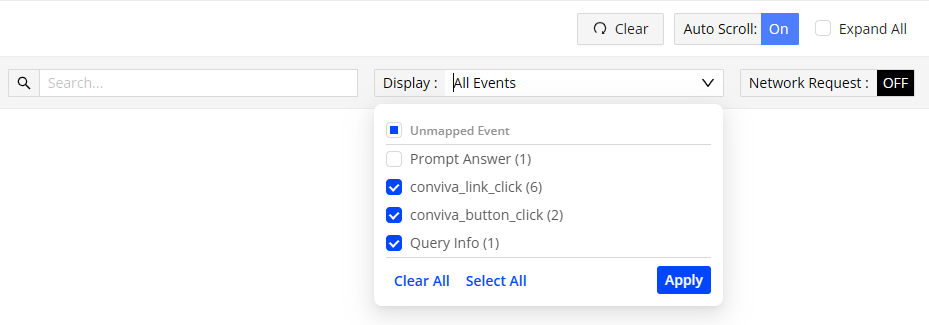
Clear button: Clears all displayed raw events and starts showing new events that occur after clicking the Clear button.
Auto Scroll: Enables automatic scrolling of the data for raw events.
Expand all: Selects the check box to display all data for raw events.
Search box: Allows input of keywords to quickly locate matching raw events.
Display: The drop-down list shows all raw events grouped by raw event names.
Network Request: Enables or disables the display of events related to network requests. By default, this option is disabled.
The Sensor Remote Control allows post-integration configuration of the App sensors to collect, block, or enable/disable data ingestion according to the business needs.
By default, the Blocked Events section is displayed.
Blocked Events
Block event allows preventing irrelevant or meaningless events to get collected from the sensor, ensuring the accuracy and relevancy of data ingestion. The Blocked Events list shows the events that are blocked along with the block rule, blocked by user, and blocked date.
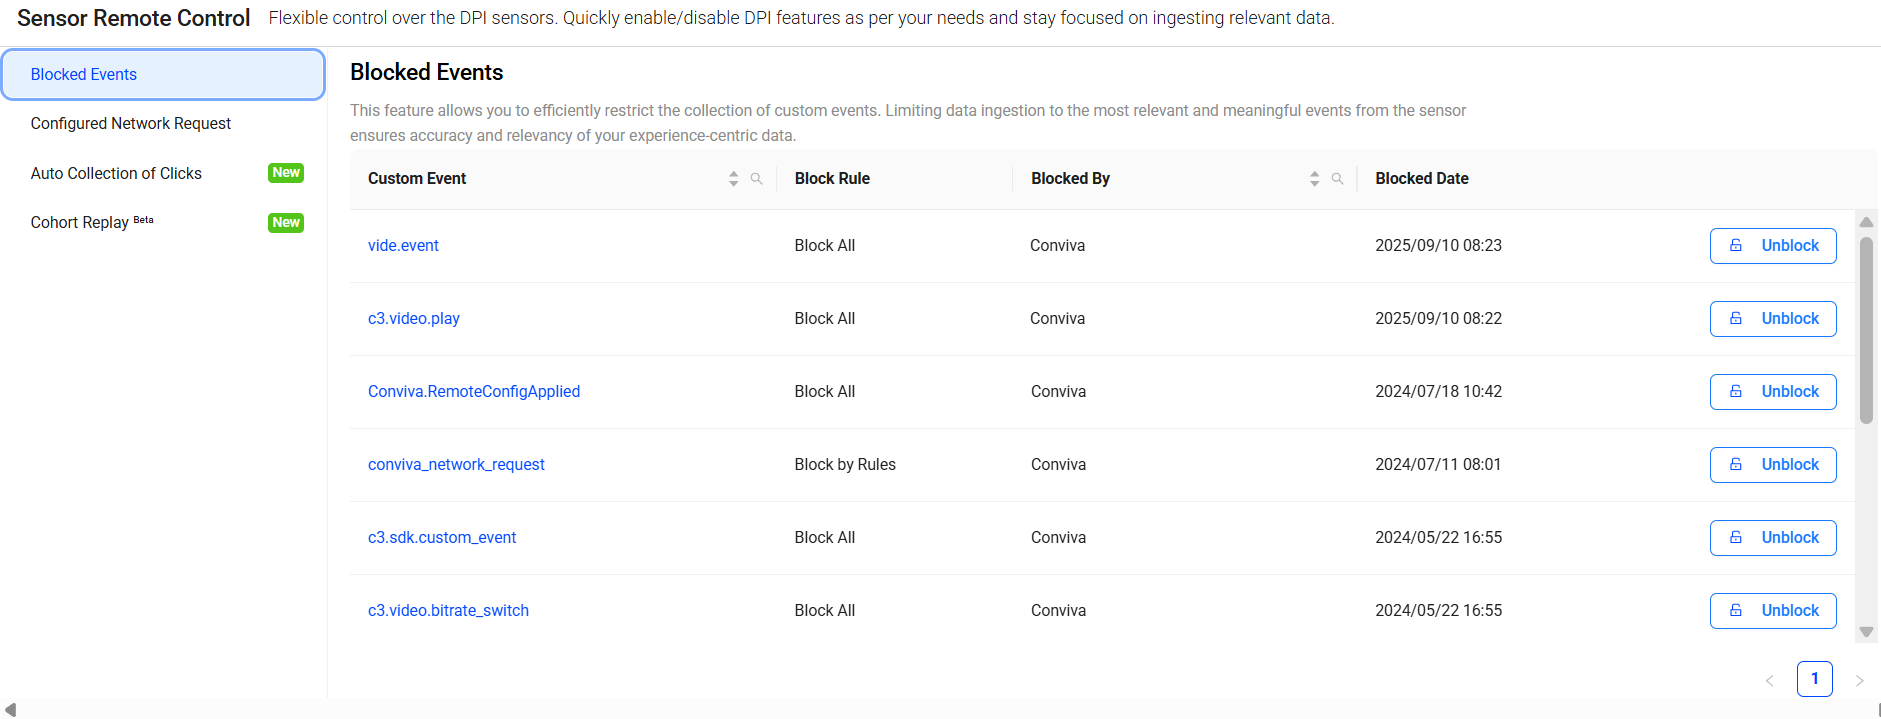
Searching Blocked Events
- To find a blocked event, click the search icon adjacent to the Custom Event column, enter part of the event's name in the search window, and click Search.
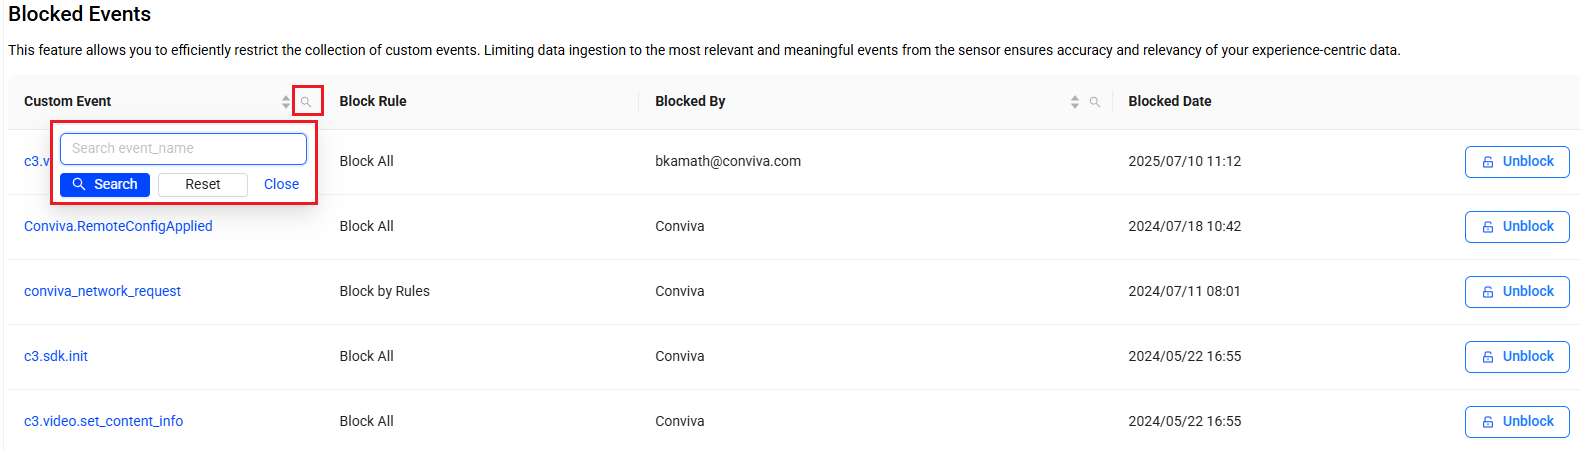
- To find a blocked event by the blocked by user, click the search icon adjacent to the Blocked By column, enter part of the user's name in the search window, and click Search.

Editing Blocked Events
Change the block rule and note for an existing blocked event.
- Click an event name under the Custom Event column to see details of the block events.
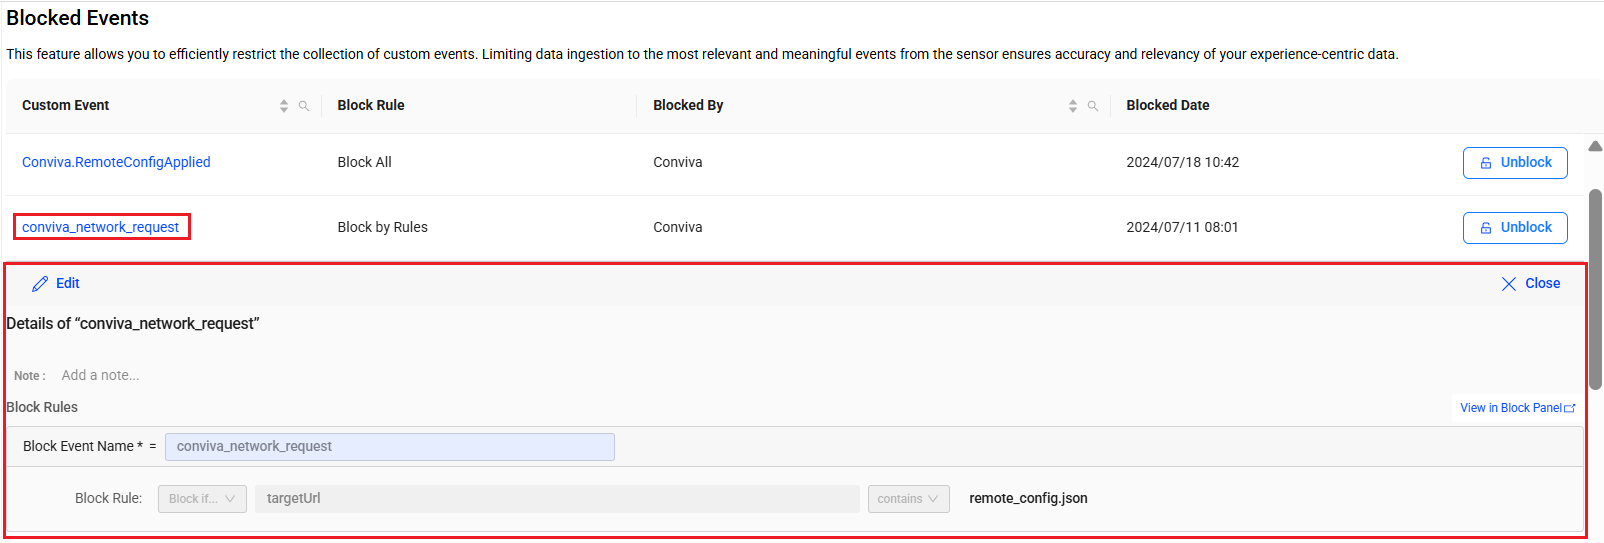
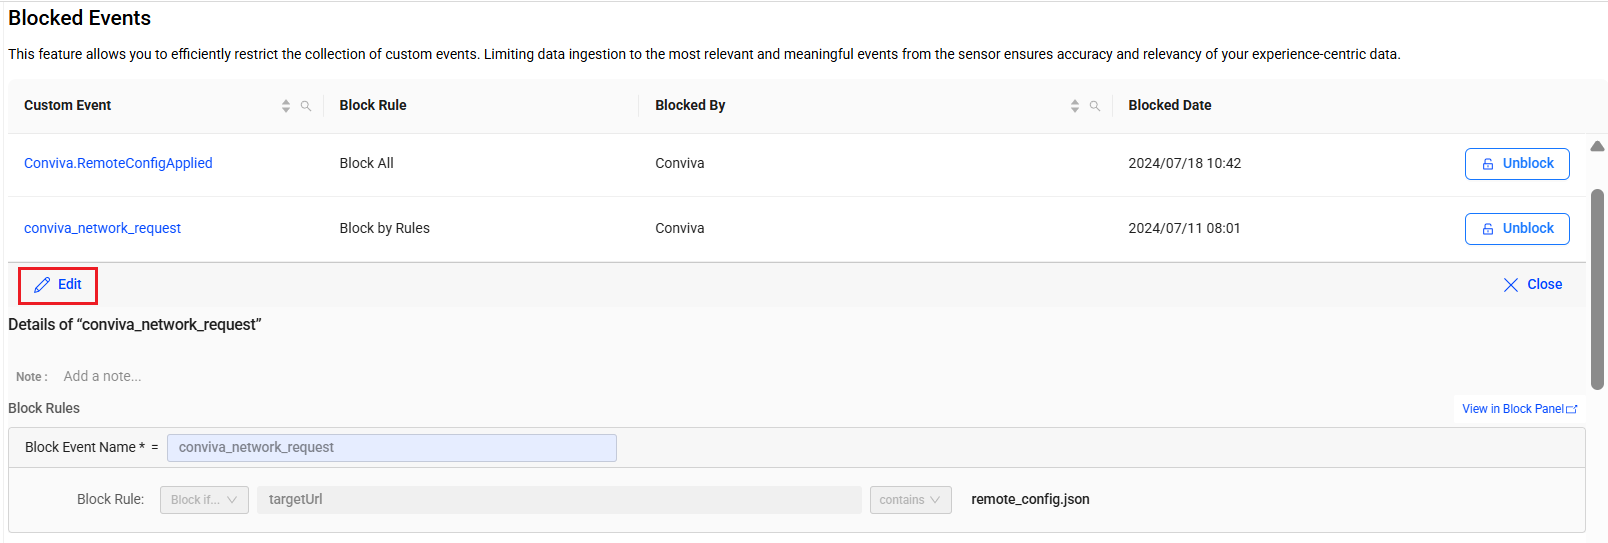
- Click Edit in the event details section.
- Change the block rule and/or update note, and click Save Changes.
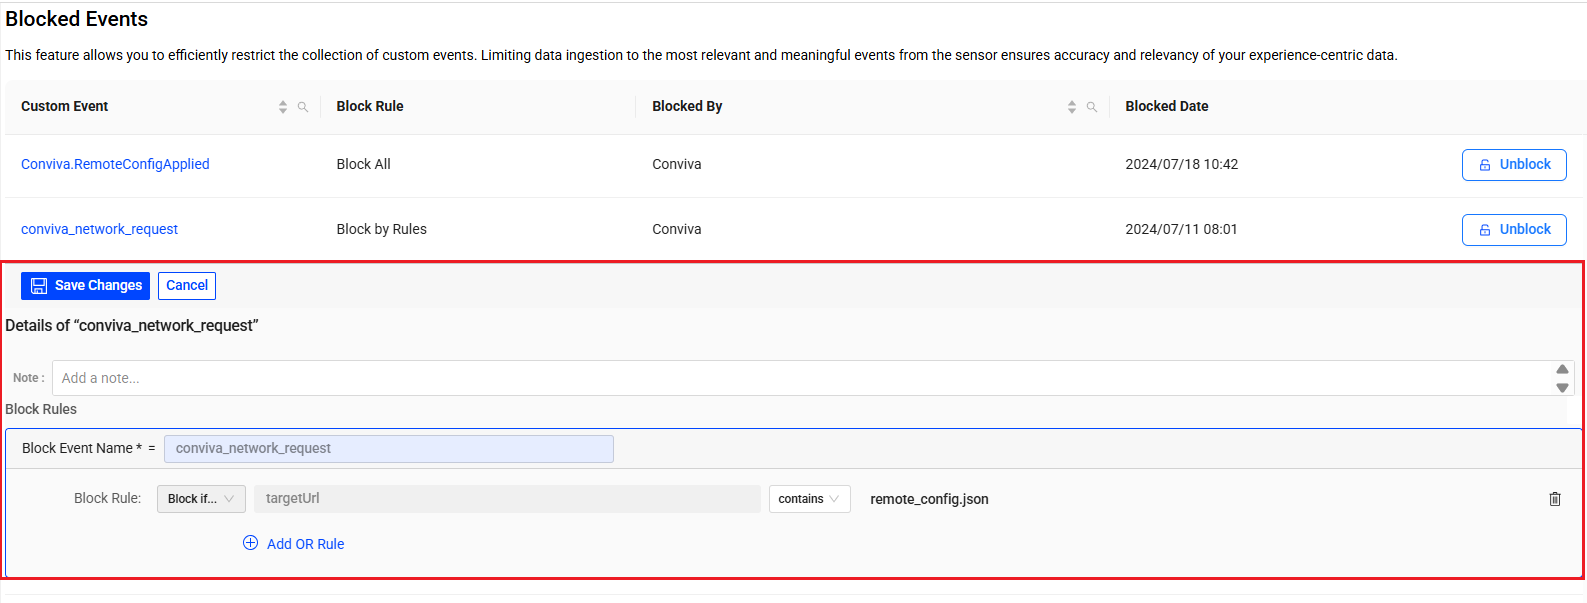
Viewing Events in Block Panel
View a blocked event in Semantic Mapper page.
- Click an event name under the Custom Event column to see details of the block event.
- Click View in Block Panel in the event details section to see the blocked events related dimensions in the Semantic Mapper page.
Unblocking a Blocked Event
Unblock an existing blocked events to resume the event collection via App Sensor.
- Click the Unblock button corresponding to the blocked event, and click Yes on the confirmation message pop-up.
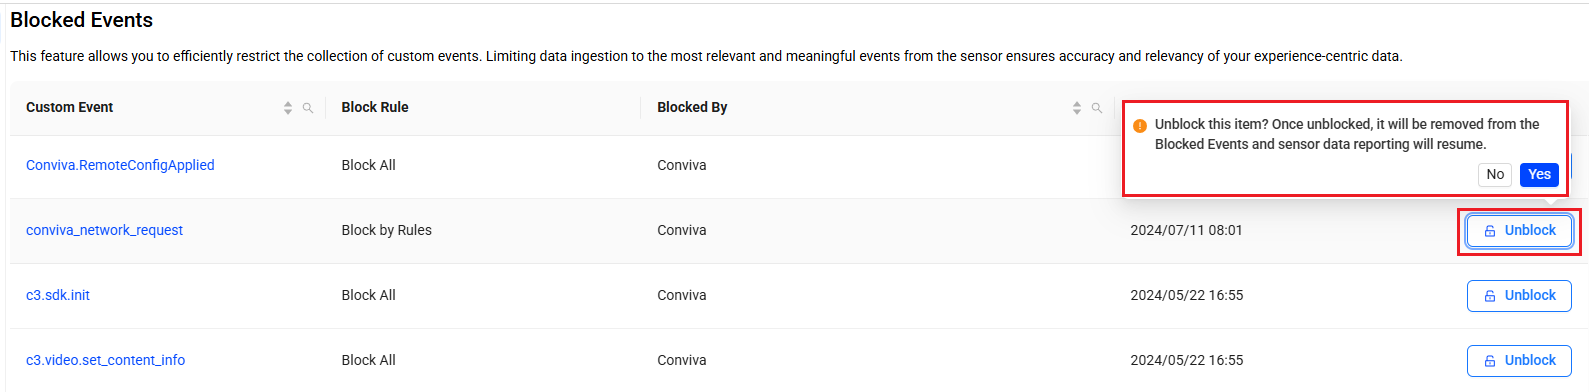
After unblocking an event, it is removed from the Blocked Events list and App Sensor starts collecting the respective event data from the integrated app.
Configured Network Request
Configure Network Request allows defining the collection rules for conviva_network_request events. When the rules are configured, the Conviva sensor collects network request events according to the matched rules.
Configure the network request data collection rules for multiple categories, such as metadata usage, EMP query fields, GraphQL, tag value, and metrics API.
Collection Rule Order
Network request collection rules are applied based on the most recently changed rules, and then rules following the displayed category order. If a network request does not meet any configured rules in a category, the collection rule matching process stops and that network request data is not passed to App.
There are two methods for collecting conviva_network_request events:
Blocked events: blocks events matching blocked event criteria and collects all other conviva_network_request events.
Collection rules: collects events matching allowed event criteria and blocks all other conviva_network_request events.
Creating Collection Rules
Click Add New in the Browse Configuration section, on the left pane.
Set the collection rule in the New Configuration section, on the right pane:
-
**Condition Name**: Type a name for the collection condition.
- Define the URL Conditions by selecting:
All: Enables rules to take effect on all conviva_network_request events.
Contains: Enables rules to take effect on events containing the Target Urls.
- Set collection rules using Request Header, Request Body, Response Header, Response Body, separately.
-
Click Save. App Sensor starts collecting the conviva_network_request events that match the rules.
Auto Collection of Clicks
Customize the user-click tracking across the application, beyond tracking the click events for buttons and links. This section consists of two tabs, Collect Attributes and CSS Selectors. Use the default attributes and CSS selectors, and also create additional custom tags, CSS selectors, and attributes to track user clicks for various purposes, such as defining Out-of-Box (OOB) metrics, resolving UX issues, and even creating meaningful user Flows.
Use the toggle button at the section header to enable/disable this feature for the App Sensor.
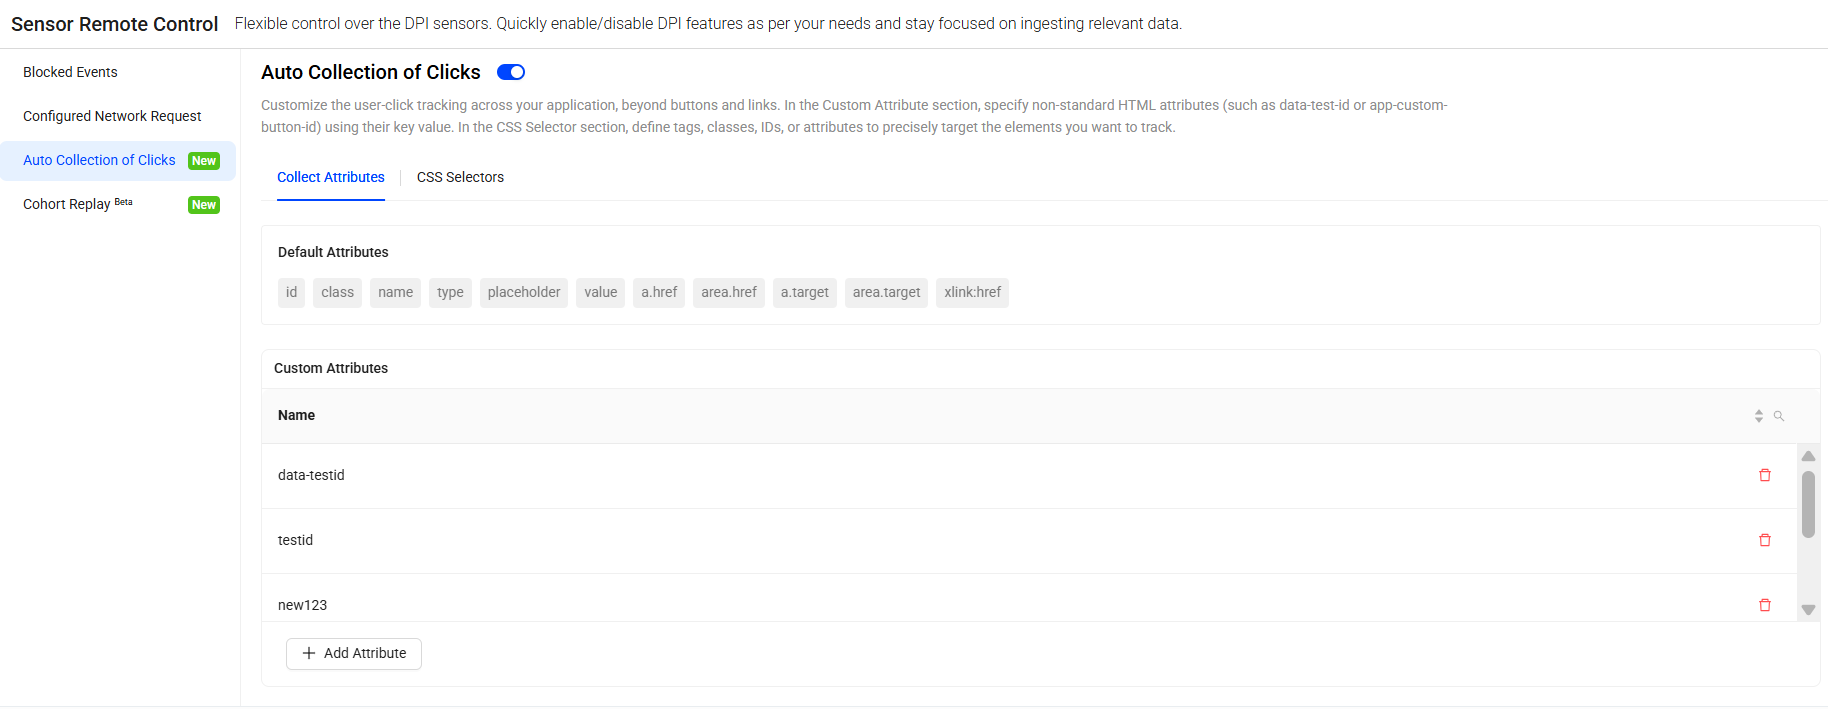
Collect Attributes
Specify the non-standard HTML attributes (such as data-test-id or app-custom-button-id) using their key value. By default, App sensors support collecting user-click events for certain attributes, such as, id, class, name, type, placeholder, value, a.href, area.href, a.target, area.target, and xlink:href.
In the Custom Attributes section, click the Add Attribute button to track user clicks on more custom attributes such as,src, title, alt. Click the Save button to deploy.
CSS Selectors
Define tags, classes, IDs, or attributes to precisely target the elements you want to track. By default, App sensors support collecting user-clicks for the native clickable selectors, such as button, a, select, textarea, input:not([type="hidden"]), summary, video, and audio.
In the Default Virtual Clickable Selectors section, use the toggle button to enable/disable the pre-defined click tracking for the virtual selectors.
In the Custom CSS Selectors section, click the Add CSS Selector button to specify the custom CSS Tag or custom CSS attribute for click tracking.
For more information about Auto Collection of Clicks, see Sensor Remote Control.
Cohort Replay (Beta)
Cohort Replay enables the visual reconstruction and review of user navigations and actions within a customer's app. This feature captures how users interact with the app, including clicks, navigation, scrolling, media engagement, and text input, and then replays these interactions in a video-like experience. Cohort Replay provides direct visibility into how customers interact with digital platforms and user behaviors, based on a sampling percentage of user sessions.
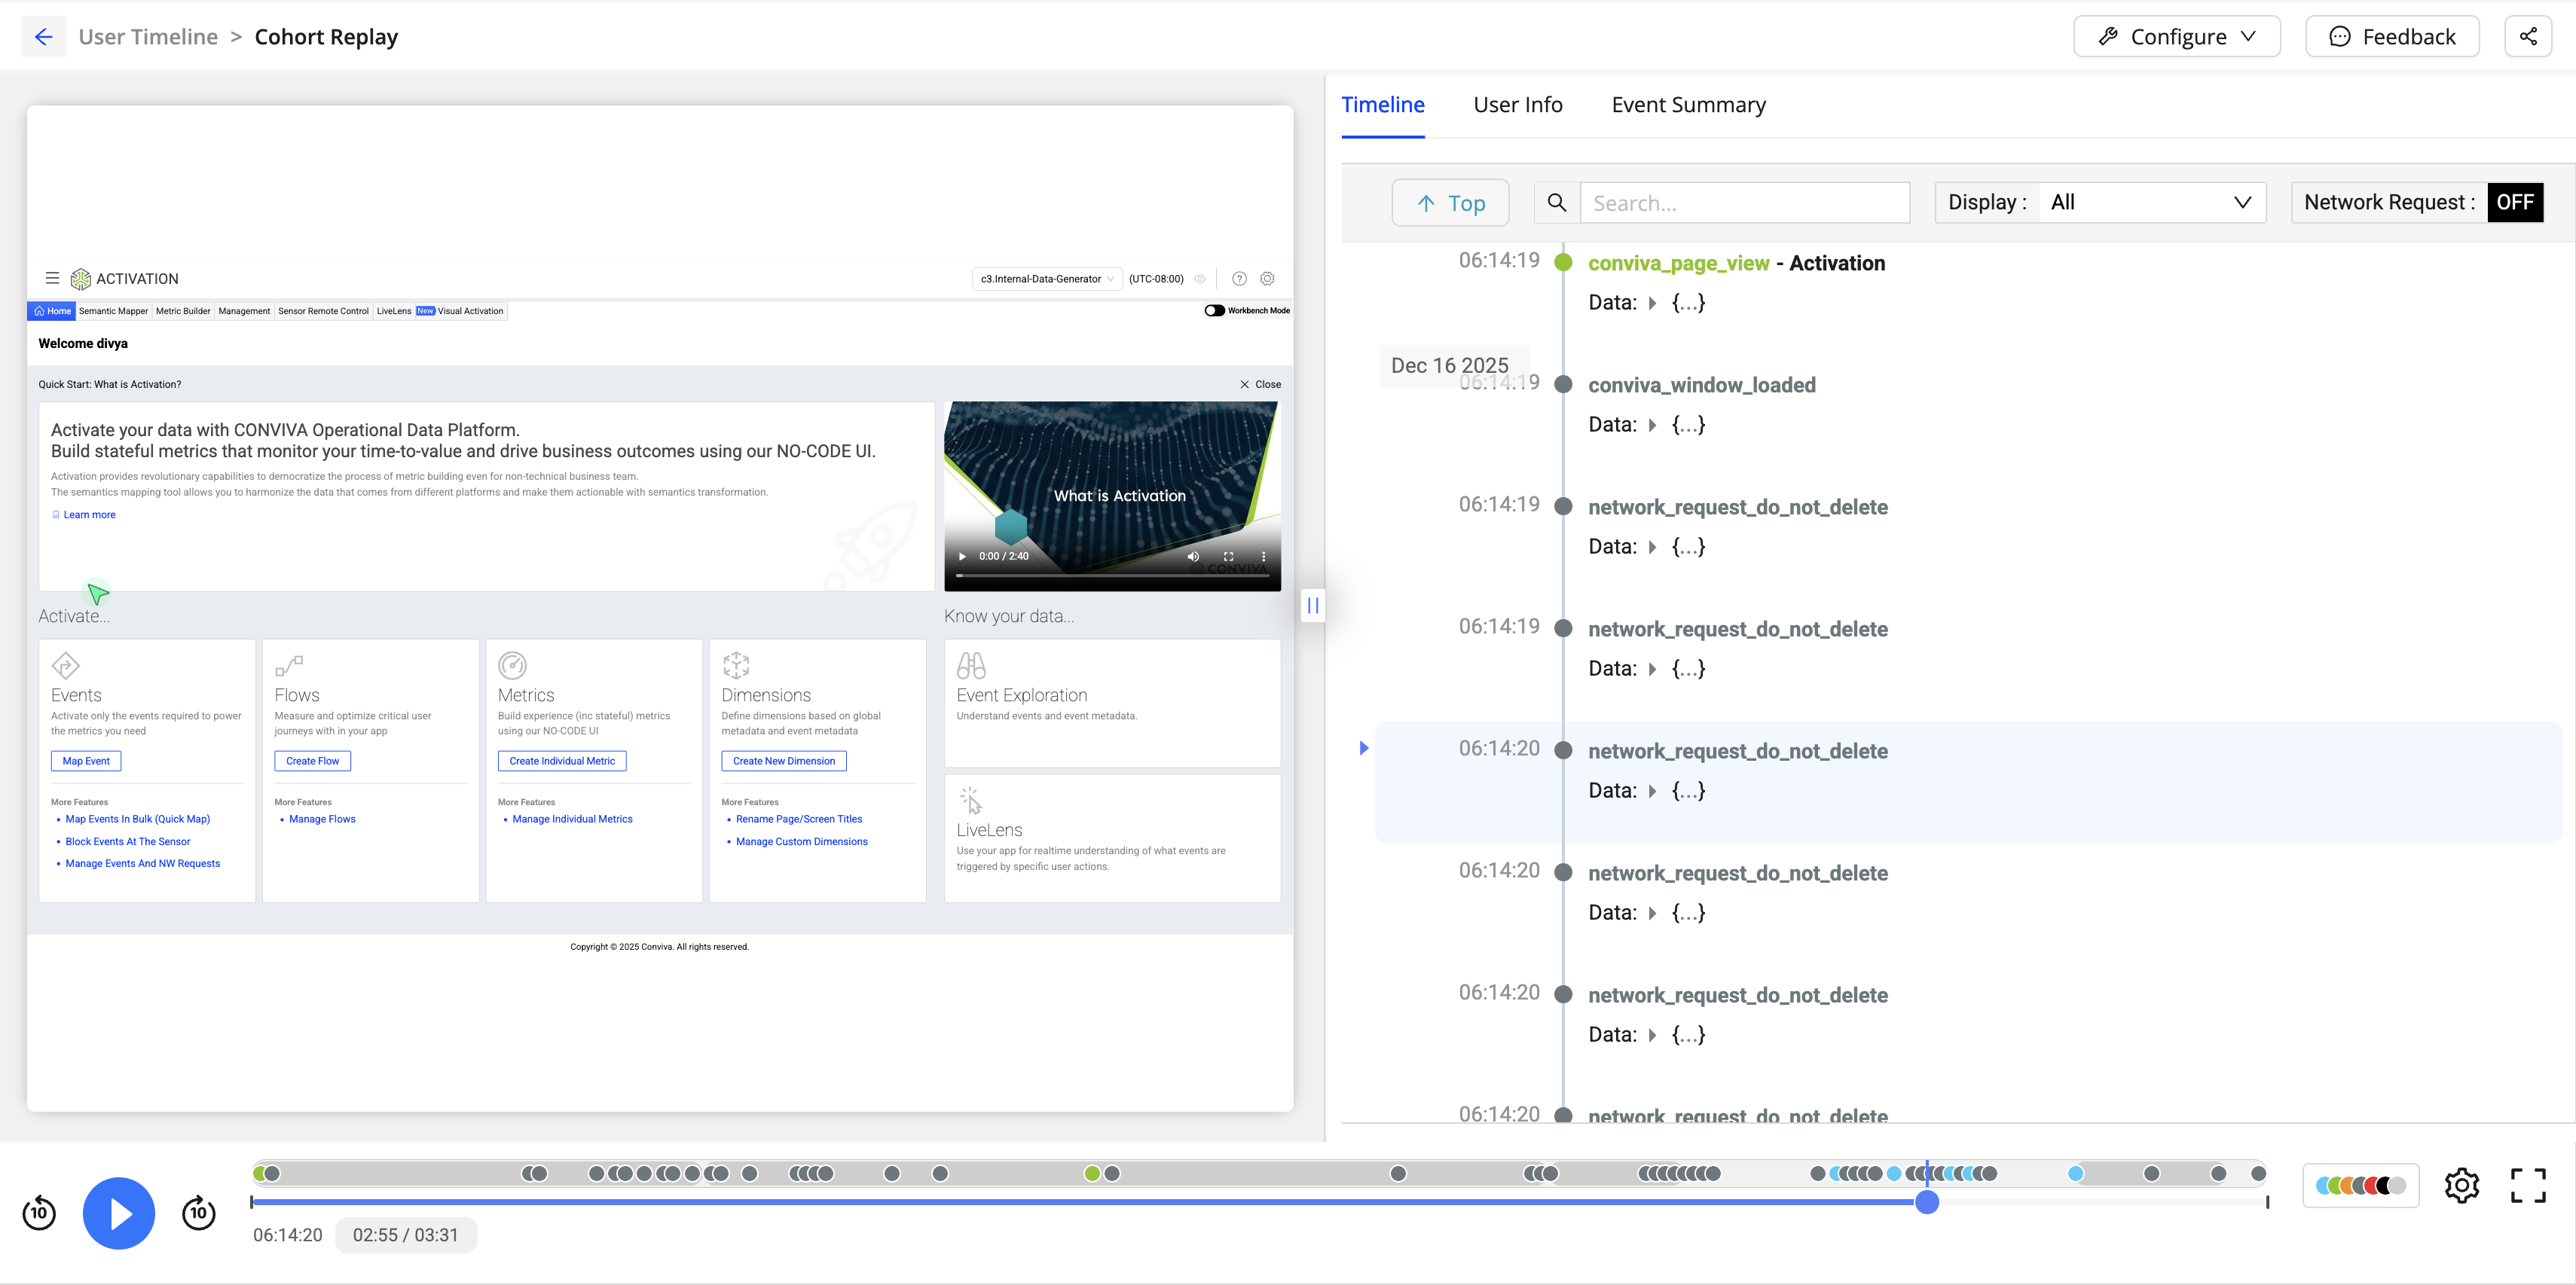
Supported Platforms and Versions: Web (JS) version 1.4.3 and above.
Use Cohort Replay to:
Understand the details in user behaviors and friction points
Link from Funnel and metric anomalies to visual behavior representations for quick user behavior optimizations.
Analyze the impact of user experience on flagged AI Alerts and check for anomalies.
Monitor the exact sequences of user actions to analyze behavior and UI improvements.
Launching Cohort Replay
Access the Cohort Replay from the Trends or Users Dashboard.
- Navigate to Trends >> Cohort Replay Tab
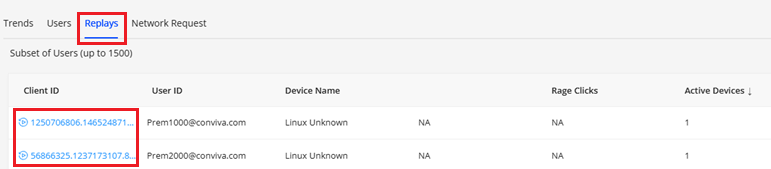
- Click a Client ID or Cohort Replay icon associated with the user session to see the session details in a new User dashboard tab.
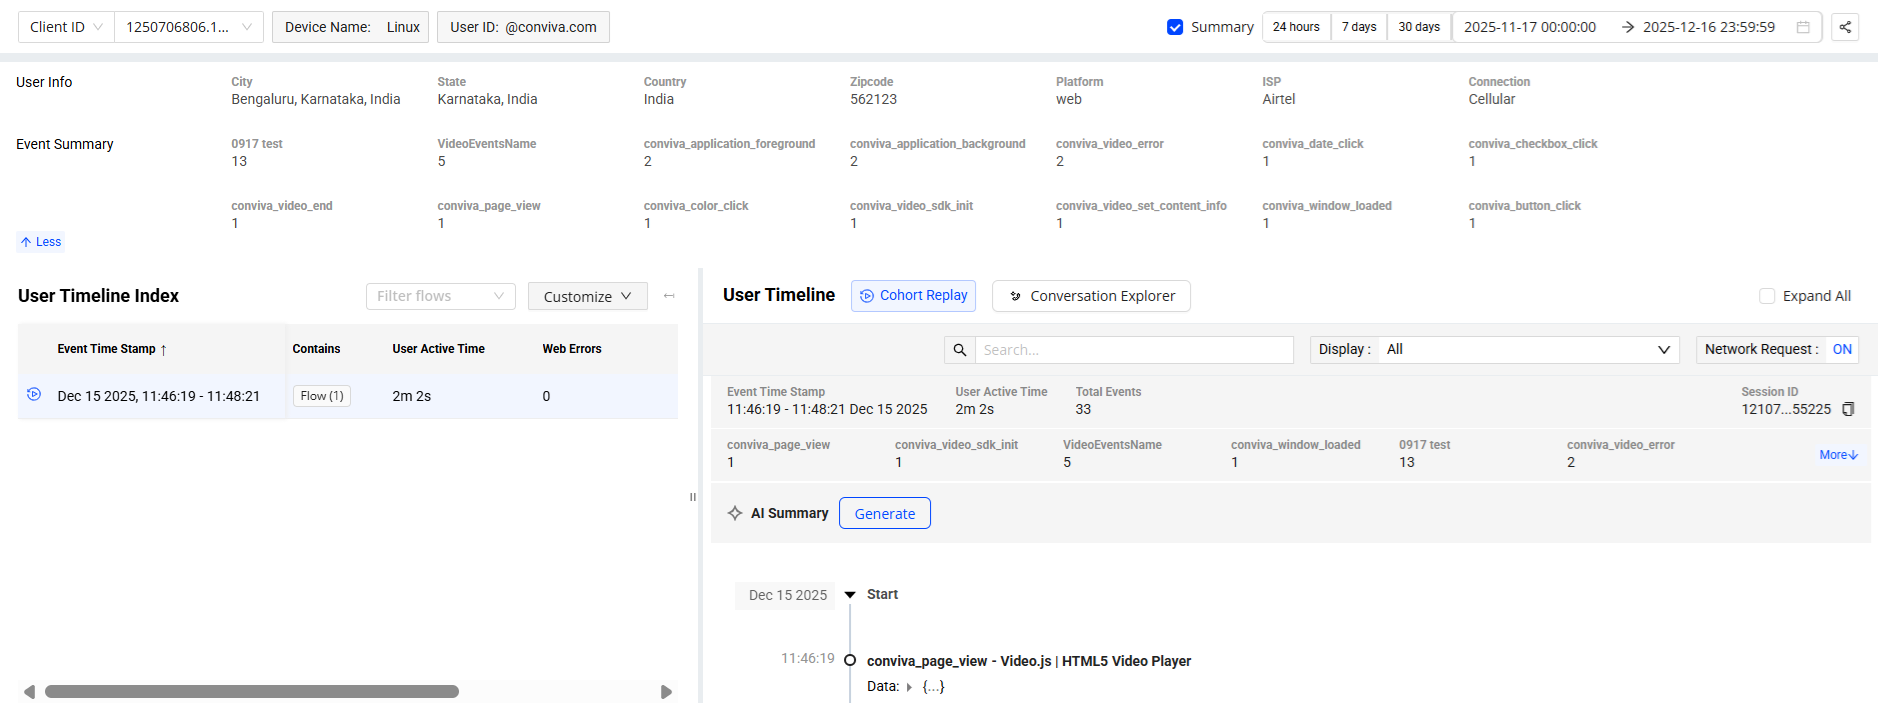
- On the Users timeline, click the Cohort Replay icon adjacent to the Event Time Stamp to see the user timeline details with the cohort replay.
The player enables detailed session analysis through the following features:
Events Indicator: Colored dots display events, network requests, and errors.
Playback Controls: Options are provided to pause playback, seek to a specific position, fast forward by ten seconds, and rewind by ten seconds.
Session Sharing: Share the sessions for collaborative investigation of issues.
Settings: Speed control options allow adjustment of playback speed.
- On the Cohort Replay screen, click the Configure drop-down and select Configure Replays to view the Cohort Replay configuration page in Sensor Remote Control.

Configuring Cohort Replay
Use the Session Remote Control tab to enable the Cohort Replay, set the sampling percentage to specify the proportion of user sessions captured, and define the masking level to secure the PLL data.
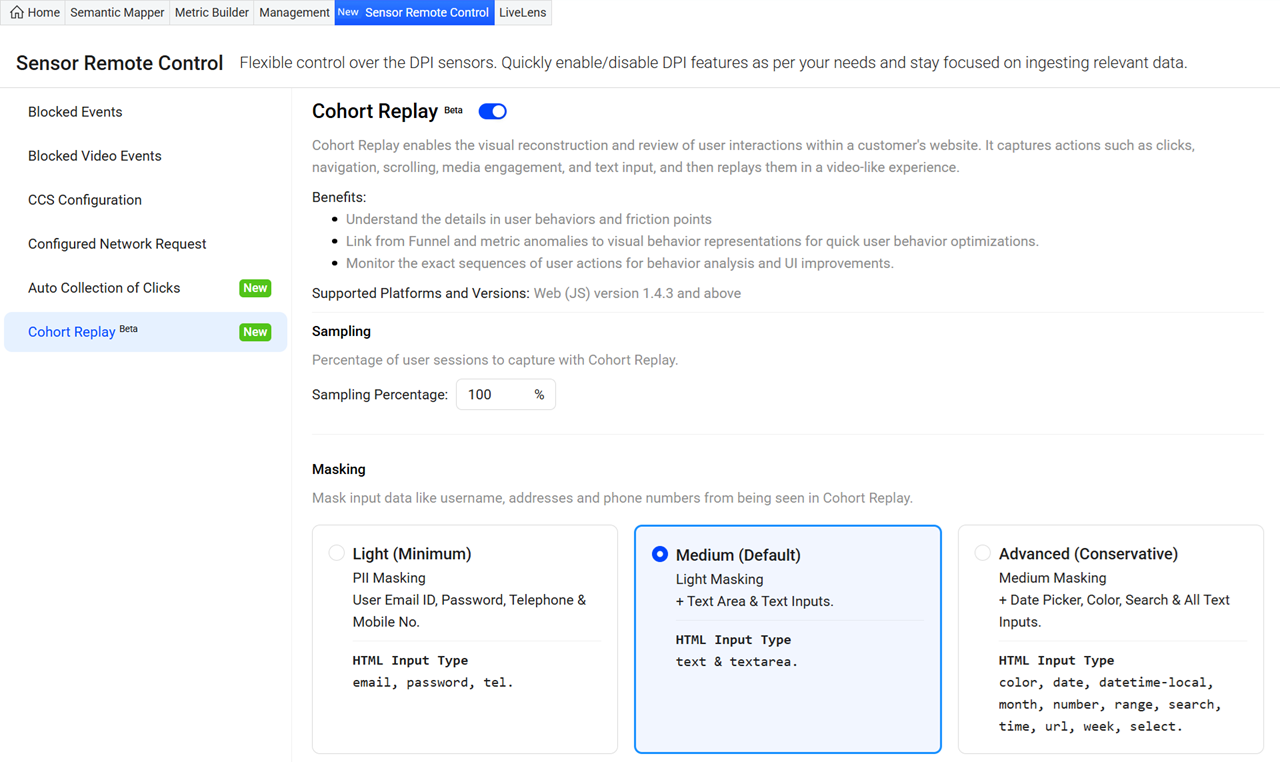
Cohort Replay: Toggle to start recording the user sessions based on the specified sampling percentage.
Sampling: The sampling percentage specifies the proportion of user sessions captured for Cohort Replay.
Masking: Conviva offers a data masking feature to ensure the security of Personally Linked/Locatable (PLL) data during session recordings. There are three levels of masking:
-
Light (Minimum): The cohort replay does not capture any user email IDs, passwords, telephone numbers, or mobile numbers.
Medium (Default): In addition to the Light masking, the cohort replay does not capture text or text areas. Conviva recommends the Medium masking level.
Advanced (Conservative): In addition to Medium Masking, the cohort replay does not capture the Date Picker, Color, Search, and All Text Inputs.
Use Cases
Cohort Replay provides visibility into funnel conversion and related metrics. It captures the exact user experience with visual context, enabling the identification of anomalies or performance deterioration that may impact business outcomes.
The timeline view provides a visual representation of the user experience, facilitating drill-down analysis and supporting the identification of friction points.
Cohort Replay links anomalies to the corresponding user sessions, providing a detailed analysis of user behaviour associated with the anomaly.