
App Crashes Explained
App provides two app crash metrics for native mobile applications: App Crashes (v2) and App Crashes (v1). Use App Crashes (v2) for accurate crash count reporting and dashboards. Use App Crashes (v1) only when you need real-time crash detection during an active flow, with the understanding that v1 undercounts.
Related metrics such as Crash → Exit, Crash → Restart, Mins with Crash, and Mins with Crash → Restart are computed from App Crashes (v1). Surfaces such as QoE and Flow errors still display the label App Crashes in the UI while using the v1 metric.
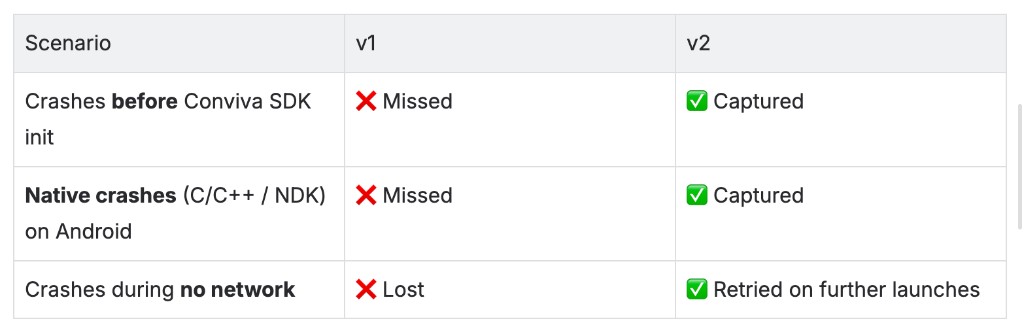
App Crashes (v2) captures crashes that App Crashes (v1) misses or loses, including pre-initialization crashes, native Android crashes, and crashes during no network.
App Crashes (v2)
App Crashes (v2) (event: conviva_crash_v2) is supported for:
-
Android and FireOS: OS v11 and above, and Conviva Sensor v1.2.5 and above
-
iOS: v14 and above, and Conviva Sensor v1.6.0 and above
These version requirements also apply to React Native and Flutter apps that use the supported Android or iOS sensor versions. There are no separate React Native or Flutter sensor version numbers for this metric.
v2 uses system APIs for more accurate crash count reporting by collecting crashes—including Out-of-Memory (OOM) events, native (NDK) crashes, system-level freezes, and pre-initialization crashes—and reporting them on the next launch (by the system or the user), independent of the Conviva session or no-network scenarios. Because reporting occurs on the next launch, this metric often has a time lag and should not be used to capture crash errors during a flow.
Default dimensions associated with the metric:
-
Crash Exception Name (v2)
-
Crash Message (v2)
-
Crash Stack Trace (v2)
App Crashes (v1)
App Crashes is now renamed to App Crashes (v1) (same event: conviva_application_error). This metric is supported for all OS and sensor versions, but the crash count is typically much lower than v2 because:
-
v1 does not collect Out-of-Memory (OOM) events, native (NDK) crashes, system-level freezes, or pre-initialization crashes
-
v1 is lost in no-network scenarios (both Android and iOS)
-
v1 is lost if the crash happens before Conviva Sensor initialization
-
v1 can be dropped due to watermark if reporting is delayed beyond the Conviva session timeout
Unlike v2, App Crashes (v1) is always attempted to be sent before the application closes and is therefore reported in real time.
tvOS does not support system APIs yet, so it only reports App Crashes (v1).
This metric will be deprecated in the future as tvOS gains system API support and traffic on older OS and sensor versions decreases.
Default dimensions associated with the metric:
-
#Stack Trace
-
#Error Message
Note: For the OS and sensor combinations that support v2, v1 is also reported, so some crashes can appear in both metrics. As end users upgrade to the latest OS and apps upgrade to the latest sensor version, v2 increasingly becomes the primary and more accurate crash metric, and duplicate counts between v1 and v2 gradually decrease.
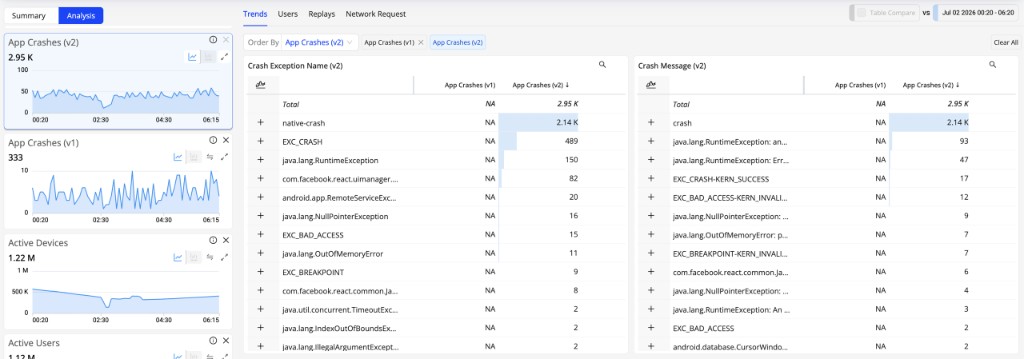
Trends Analysis comparing App Crashes (v2) and App Crashes (v1), including Crash Exception Name (v2) and Crash Message (v2) dimensions.
Related App Crash Metrics
When an app crash is detected by App Crashes (v1), metric tracking varies depending on what happens within the next 30 seconds. If the app restarts, the session continues and the event is recorded in both the App Crashes (v1) and Crash → Restart metrics. If the app exits, the event is recorded in both the App Crashes (v1) and the Crash → Exit metrics.
If multiple app crashes occur within an app session, each crash event is counted in the App Crashes (v1) metric and the 30-second app restart behavior determines whether an app restart or exit is counted.
The Conviva app crash metrics provide robust measurements of app crash conditions to prioritize user experiences and mobile performance impacts.
-
Monitor the user engagement impact of app crashes, distinguished by exits and restarts after crashes.
-
Assess the issue severity of app crashes, using frequency and affected time intervals.
| App Crash Metric | Definition | How to Use |
|---|---|---|
| App Crashes (v2) | Tracks application crash occurrences using system APIs, including OOM events, native (NDK) crashes, system-level freezes, and pre-initialization crashes. Reported on the next launch. As a count, it shows the total number of crashes. | Use for accurate crash count reporting and dashboards. Do not use for real-time crash detection during an active flow. |
| App Crashes (v1) | Tracks application crash occurrences reported in real time before the application closes. As a count, it shows the total number of crashes. Undercounts relative to v2. | Use only when you need real-time crash detection during an active flow. Also powers related metrics and surfaces that still label the metric as App Crashes. |
| Crash -> Exit | Shows the percentage of sessions that become inactive within 30 seconds after an app crash.
This metric measures how often users end their sessions immediately following a crash, reflecting the extent to which the crash impacts the user experience. Computed from App Crashes (v1). |
Identify critical crashes that drive users to abandon the app. High exit rates signal severe user experience issues. |
| Crash -> Restart | Shows the percentage of app crashes followed by an app restart in less than 30 seconds.
The metric is calculated as the number of app crashes where the user restarted the app in less than 30 seconds, divided by the number of Crash to App Startup Init events. Computed from App Crashes (v1). |
Gauge engagement impact and crash tolerance. High restart rates suggest users remain engaged despite crashes, indicating lower-level severity issues. |
| Mins with Crash |
Shows the percentage of one-minute intervals in app sessions with at least one application crash. The metric is calculated as the count of one-minute intervals in app sessions with at least one application crash, divided by the count of active minutes. Computed from App Crashes (v1). Note: In this metric, Mins indicates the one-minute intervals during which at least one metric impact occurred. |
Assess crash severity by measuring how much active time is affected. High percentages indicate widespread impact. Set automatic AI alert notifications based on impacted active time. |
| Mins with Crash → Restart |
Shows the percentage of one-minute intervals in app sessions with application crashes followed by an app restart in less than 30 seconds. The metric is calculated as the count of one-minute intervals in app sessions where an application crash occurred and the user restarted the app in less than 30 seconds, divided by the count of active minutes. Computed from App Crashes (v1). Note: In this metric, Mins indicates the one-minute intervals during which at least one metric impact occurred. |
Determine the engagement impact and urgency of app crashes. High impacted minutes indicate more critical issues. |
After ensuring the required App Crashes metrics are selected in the metric selector, the metrics and related error events appear in the Trends App Crashes metric widget time series. Analyzing these metrics helps identify fatal exceptions and resource constraints causing crashes. Additionally, select the App Crashes (v2) or App Crashes (v1) metric widget and use the dimension tables to isolate crash-related root causes.
Metrics for Crash -> Restart and Mins with Crash provide data for troubleshooting issues when the app restarted within 30 seconds. For more details, see App Metrics.
Note: For App Crashes (v1), App performs a best-attempt to detect and report app crashes before the app terminates. If not reported, App attempts to report the crash during the next app launch. In some cases, app crashes may not be reported—for example, if Android terminates the app within its 20-second ANR (Application Not Responding) limit. For App Crashes (v2), crashes are reported on the next launch via system APIs.
For iOS/Android apps, in the Trends Analysis tab select the App Crashes (v2) or App Crashes (v1) time series to access the related error messages and stack trace data.