
Click any metric name below to open its dedicated page with the full definition, secondary metrics, and supported sensors.
App provides a robust set of metrics to enable application performance monitoring and user behavior analysis across your web and native applications. Use App metrics for a holistic view of web and mobile app health, performance, and real-user experience, unifying performance analysis with user journey optimization. Metric values appear as time series and distributions in metric widgets, and alongside dimensional values in the dimension drill-down tables.
| Category | Metrics | ||
|---|---|---|---|
| Audience and Engagement |
App Active Time (Interval) (Formerly Active Time) |
||
| QoE and KPI Metrics | |||
| Frustration Signals | |||
| Web User Experience | |||
| Mobile User Experience | |||
| Service Performance |
Mins with 0 Network Response Code |
Mins with 4xx Network Response Code |
|
Metric Types
App supports several metric types:
Flow Metric: helps in the identification of crucial moments in user journeys to optimize applications and improve the user experience. For example, consider the metrics corresponding to the flow from searching for a video to successfully playing it.
Individual Metric: associates with initial and follow up events. App enables several types of individual metrics.
Duration Metric: Measures the time interval between two events, such as the duration between the login screen event and the login success event.
Conversion Metric: Measures the count or conversion rates of events from one stage to another, such as the count of sessions with successful login after opening the login screen.
Event Aggregation Metric: Measures the number of events, or calculates the value of event attributes, such as the average duration of network requests.
Ratio Metric: Displays the relationships or proportions using mapped event values and OOB/custom aggregation metric values, such as revenue per paying user.
For this metric, select the Ratio metric settings with:
Numerator: build from a mapped event, such as Total Revenue, calculated by total values
Denominator: build from the predefined metric Unique Users
For detailed analysis, applying this metric to a dimension in Trends, such as Device, shows how revenue per paying user varies across different device types.
Out-of-Box Metric: enables application performance monitoring and user behavior analysis across web and native applications. The OOB metrics include these categories:
Audience and Engagement: Insights into user activity patterns, session behaviors, and content consumption, enabling a comprehensive understanding of audience reach and engagement levels.
QoE and KPI Metrics: Insights into performance issues on user sessions, highlighting areas where poor experience may affect engagement, satisfaction, or retention.
Frustration Signals: Insights to user friction points, such as rage clicks (repeatedly clicking on an element in frustration), excessive app restarts, and clicks preceding web errors and mobile app crashes.
Web User Experience: Insights into how users perceive and interact with web pages, highlighting performance bottlenecks, navigation delays, and error occurrences. A Presets dashboard offers quick starting points and commonly used metrics and metadata for Web use cases.
Mobile User Experience: Insights into how users perceive app performance, including startup times, screen loading, and navigation speed. A Presets dashboard offers quick starting points and commonly used metrics and metadata for Mobile app use cases.
Service Performance: Insights into how network performance impacts user experiences, highlighting slow responses, failed requests, and error rates. A Presets dashboard offers quick starting points and commonly used metrics and metadata for service use cases.
App also provides bad pattern metrics such as ANR -> Exit and Crash -> Exit to quantify sequences of events that indicate poor user experiences, including repeated errors, failed interactions, and app restarts. Unlike isolated incident tracking, these metrics capture the compounded impact of problematic event chains, offering a more holistic and actionable view of user frustration.
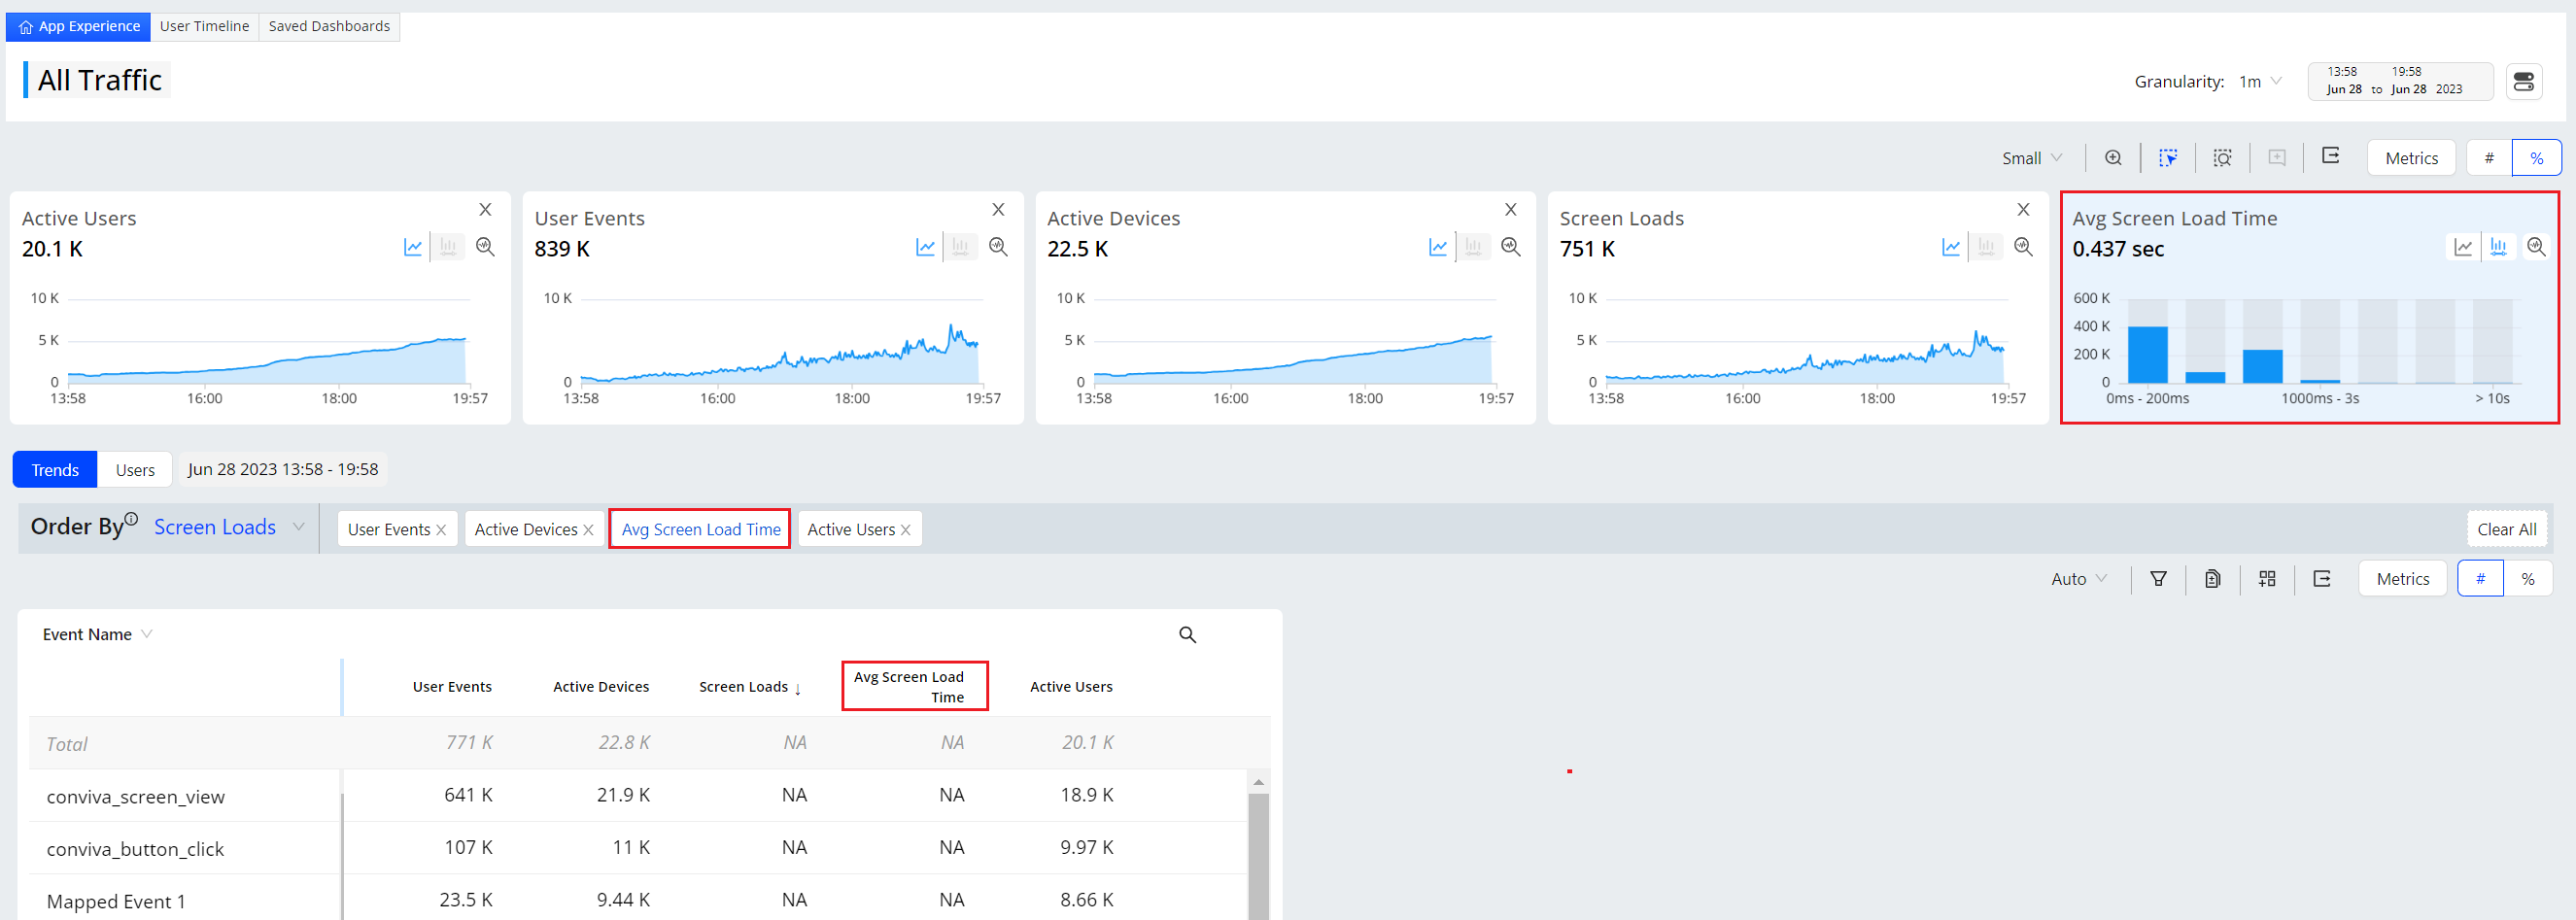
A App session starts when any system or user-defined event is received and ends after 90 seconds of inactivity.
Metrics can span a specific interval or a complete session.
Session Metrics: Metrics based on data from events that occur throughout sessions that end within the selected time interval, for example App Video Bounce Rate metric from sessions that ended yesterday. If a session starts before the selected time interval but ends within it, the data for that session is still considered for the calculation of the session metrics.
Interval Metrics: Metrics based on data from events that occur within a specific interval during sessions, for example, Total Events, the cumulative count of mapped events occurring within a specific interval during sessions.
In addition to the metrics designed by Conviva to optimize your analysis, App supports a custom metric builder so you can create customized metrics based on your specific requirements. For more details, see Metric Builder.
Secondary Metric
As primary metrics, Conviva uses a proprietary combination of native and web applications events to provide a rich set of application performance and experience metrics. The App Sensor supports events, such as page_view and network_request.
Selecting a metric widget in App also displays a secondary metric that provides a context or related data to help you more completely understand the primary metric. Secondary metrics enhance the interpretation and analysis of primary metrics.
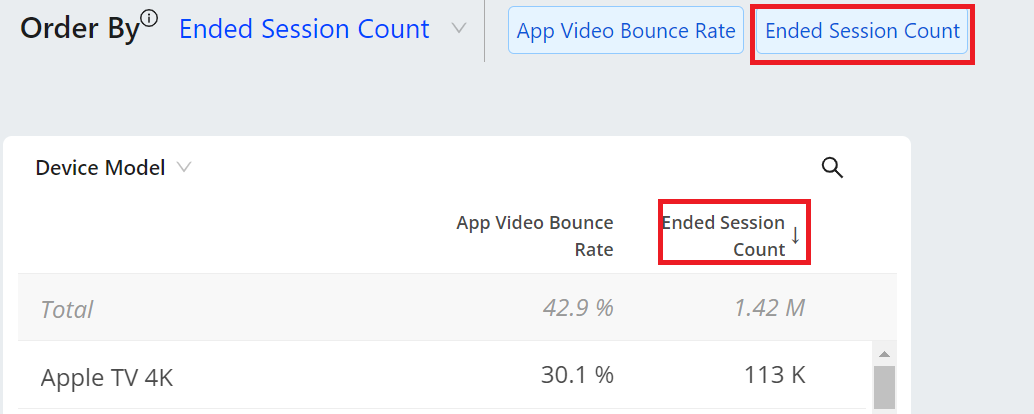
Secondary metrics display in the dimension panel after clicking a metric widget in the metric panel, for example Ended Session Count displays as a secondary metric for App Video Bounce Rate.
Percentile Aggregation (Beta)
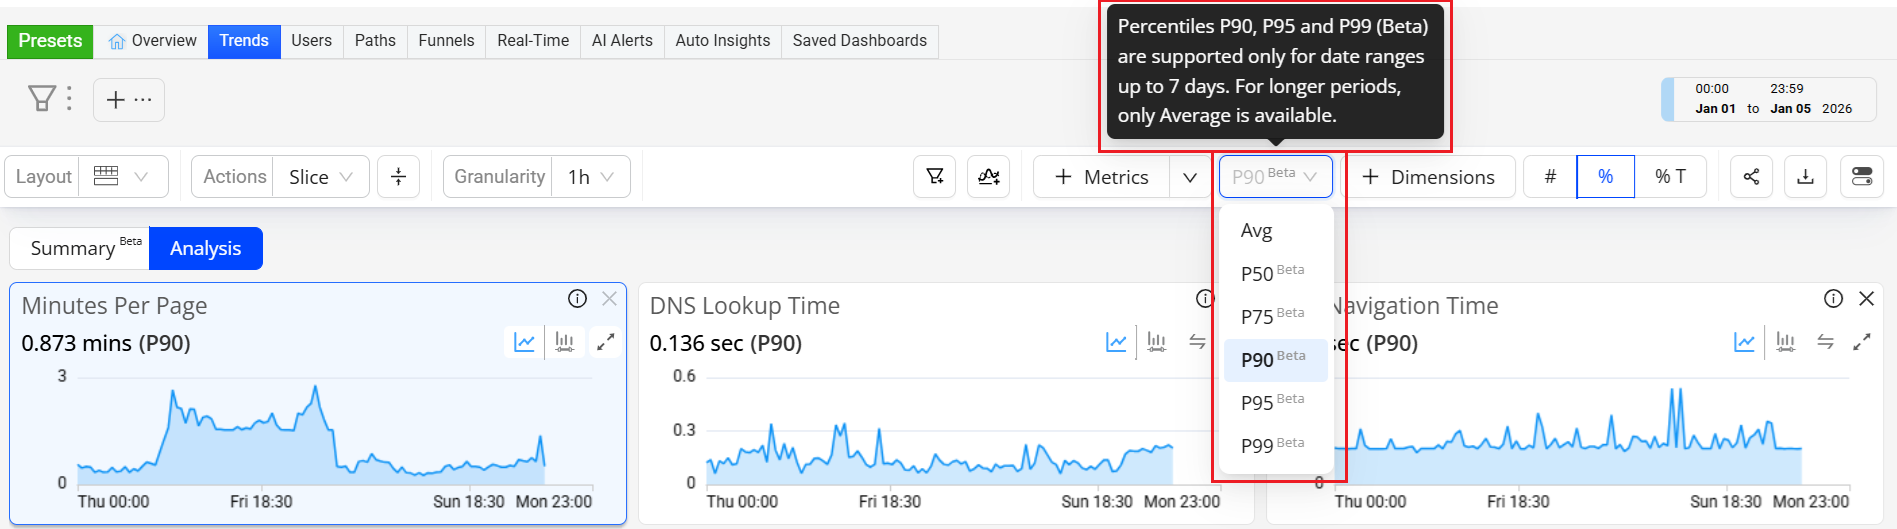
For Duration, Flow-Duration, and Custom Metrics, Conviva introduces percentile data percentile-ranked statistical aggregation for P50, P75, P90, P95, and P99 levels of Duration, Flow-Duration and Custom performances. Ranked-flow and custom performance data enable accurate measurement of performance distributions, minimizing the impact of long-tail outliers that can distort average-based metrics. Percentile aggregation provides a statistically robust representation of data and aligns Conviva analytics with industry-standard performance measurement practices.
By sorting and then ranking data, a percentile indicates the value below which a given percentage of observations fall. For example, within a ranked data set of session performance,
- P50 (50th percentile) means 50% of the session performance is completed at or below this value.
- P95 (95th percentile) means 95% of session performance is completed at or below this value, and only the slowest 5% take longer.
Out-of-Box Events
Check the auto-ingested events and minimum player versions for details about auto-collected event support.
Out-of-Box Events
App provides a robust set of metrics to enable application performance monitoring and user behavior analysis across your web and native applications. Metric values appear as time series and distributions in metric widgets, and alongside dimensional values in the dimension drill-down tables.
| OOB Events | Android | iOS | JavaScript (WEB) | React Native on Android and iOS | c-SDK | Rust | Roku | Flutter on Android | Flutter on iOS | Flutter on WEB (JS) |
|---|---|---|---|---|---|---|---|---|---|---|
| periodic_heartbeat | Auto-collected | Auto-collected | NA | Auto-collected | Auto-collected | Auto-collected | Auto-collected | Auto-collected | Auto-collected | NA |
| page_ping | NA | NA | Auto-collected | NA | NA | NA | NA | NA | NA | Auto-collected |
| network_request | Auto-collected | Auto-collected | Auto-collected | Auto-collected | API Config | API Config | API Config | Auto-collected only for HTTP, Dio, Chopper, and Retrofit clients | Auto-collected | Auto-collected only for HTTP, Dio, Chopper, and Retrofit clients |
| screen_view | Auto-collected | Auto-collected | NA | Auto-collected | API Config | API Config | API Config | API Config | API Config | NA |
| page_view | NA | NA | API Config | NA | NA | NA | NA | NA | NA | API Config |
| application_error | Auto-collected | Auto-collected | Auto-collected | Auto-collected | API Config | API Config | API Config | Auto-collected; only Java and Kotlin errors | Auto-collected | Auto-collected |
| button_click | Auto-collected | Auto-collected | Auto-collected | Auto-collected | NA | API Config | API Config | API Config | API Config | API Config |
| Any clickable UI items (including button and link) | NA | Auto-collected from Conviva Sensor ver1.1.2 onwards | NA | NA | NA | NA | NA | NA | API Config | NA |
| application_background | Auto-collected | Auto-collected | Auto-collected | Auto-collected | Not Implemented | API Config | NA | Auto-collected | Auto-collected | Auto-collected |
| application_foreground | Auto-collected | Auto-collected | Auto-collected | Auto-collected | Not Implemented | API Config | NA | Auto-collected | Auto-collected | Auto-collected |
| app_install | Auto-collected | Auto-collected | NA | Auto-collected | Not Implemented | API Config | Not Implemented | Auto-collected | Auto-collected | NA |
| deep_link_received | Auto-collected | NA | NA | NA | Not Implemented | API Config | Not Implemented | Auto-collected | API Config | NA |
| anr_start | Auto-collected | NA | NA | NA | API Config | API Config | Not Implemented | Auto-collected | NA | NA |
| anr_end | Auto-collected | NA | NA | NA | Not Implemented | Not Implemented | Not Implemented | Deprecated | NA | NA |
| conviva_fragment_view | Auto-collected | NA | NA | NA | NA | NA | NA | Auto-collected | Auto-collected | NA |
| conviva_compose_view | Auto-collected | NA | NA | NA | NA | NA | NA | Auto-collected | NA | NA |
| first_app_launch | NA | NA | Auto-collected | NA | API Config | API Config | Not Implemented | NA | NA | Auto-collected |
| page_loaded | NA | NA | Auto-collected | NA | NA | NA | NA | NA | NA | Auto-collected |
| soft_navigation | NA | NA | Auto-collected | NA | NA | NA | NA | NA | NA | NA |
| conviva_revenue_event | API Config | API Config | API Config | NA | NA | NA | NA | NA | NA | NA |
| conviva_webvitals_lcp | NA | NA | Auto-collected | NA | NA | NA | NA | NA | NA | Auto-collected |
| conviva_webvitals_inp | NA | NA | Auto-collected | NA | NA | NA | NA | NA | NA | NA |
| conviva_webvitals_cls | NA | NA | Auto-collected | NA | NA | NA | NA | NA | NA | NA |
| conviva_webvitals_fcp | NA | NA | Auto-collected | NA | NA | NA | NA | NA | NA | NA |
| conviva_webvitals_ttfb | NA | NA | Auto-collected | NA | NA | NA | NA | NA | NA | NA |
Agentic Events
Conviva JavaScript (WEB) Sensor supports the collection of agentic events:
- Server-sent events
- WebSocket message stream
- Event source message stream
Predefined Mapping Event
App offers a comprehensive set of predefined mapped events that enable you to create custom metrics and perform application performance monitoring and user behavior analysis on the Trends dashboard.
In the Scope column:
- Trends and Activation: The events can be used on the Trends dashboard and all pages in Activation.
- Activation: The events can be used on all pages within Activation.
- Metric Builder: The events can be used on the Metric Builder page of Activation.
| Predefined Mapped Event | Raw Event Name | Mapping Rules | Scope |
|---|---|---|---|
| conviva_screen_view | conviva_screen_view | Mapped directly | Trends and Activation |
| conviva_page_view | conviva_page_view | Mapped directly | Trends and Activation |
| conviva_application_error | conviva_application_error | Mapped directly | Trends and Activation |
| conviva_network_request | conviva_network_request | Mapped directly | Trends and Activation |
| conviva_window_loaded | conviva_window_loaded | Mapped directly | Trends and Activation |
| conviva_app_backgrnd_before_page_view | conviva_app_backgrnd_before_page_view | Mapped directly | Trends and Activation |
| conviva_application_foreground | conviva_application_foreground | Mapped directly | Trends and Activation |
| conviva_application_background | conviva_application_background | Mapped directly | Trends and Activation |
| conviva_application_startup | conviva_screen_view | event_name = 'conviva_screen_view' and os_type in ('android') AND unstruct_event_com_snowplowanalytics_mobile_screen_view_1_0_0.previous_name = 'Unknown' OR event_name = 'conviva_screen_view' and os_type in ('ios', 'tvos') AND unstruct_event_com_snowplowanalytics_mobile_screen_view_1_0_0.previous_id is null | Activation |
| - | conviva_session_start | find event that triggerd a new session based on the session definition, and duplicate this event as the session start event | Metric Builder |
| - | conviva_session_end | find the session end time based on the session definition, and create a dummy event on this time point | Metric Builder |
| conviva_video_play | conviva_video_events | event_name = 'conviva_video_events' AND unstruct_event_com_conviva_conviva_video_events.name = c3.video.play | Activation |
| conviva_video_attempt | conviva_video_events | event_name = 'conviva_video_events' AND unstruct_event_com_conviva_conviva_video_events.name = c3.video.attempt | Activation |
| conviva_ad_break_start | conviva_video_events | event_name = 'conviva_video_events' AND unstruct_event_com_conviva_conviva_video_events.name = c3.ad.ad_break_start | Activation |
| conviva_ad_break_end | conviva_video_events | event_name = 'conviva_video_events' AND unstruct_event_com_conviva_conviva_video_events.name = c3.ad.ad_break_end | Activation |
| conviva_video_sdk_init | conviva_video_events | event_name = 'conviva_video_events' AND unstruct_event_com_conviva_conviva_video_events.name = c3.sdk.init | Activation |
| conviva_video_set_content_info | conviva_video_events | event_name = 'conviva_video_events' AND unstruct_event_com_conviva_conviva_video_events.name = c3.video.set_content_info | Activation |
| conviva_video_bitrate_switch | conviva_video_events | event_name = 'conviva_video_events' AND unstruct_event_com_conviva_conviva_video_events.name = c3.video.bitrate_switch | Activation |
| conviva_video_buffering | conviva_video_events | event_name = 'conviva_video_events' AND unstruct_event_com_conviva_conviva_video_events.name = c3.video.buffering | Activation |
| conviva_video_pause | conviva_video_events | event_name = 'conviva_video_events' AND unstruct_event_com_conviva_conviva_video_events.name = c3.video.pause | Activation |
| conviva_video_end | conviva_video_events | event_name = 'conviva_video_events' AND unstruct_event_com_conviva_conviva_video_events.name = c3.video.end | Activation |
| conviva_sdk_custom_event | conviva_video_events | event_name = 'conviva_video_events' AND unstruct_event_com_conviva_conviva_video_events.name = c3.sdk.custom_event | Activation |
| conviva_video_custom_event | conviva_video_events | event_name = 'conviva_video_events' AND unstruct_event_com_conviva_conviva_video_events.name = c3.video.custom_event | Activation |
| conviva_defined_error | conviva_application_error and conviva_network_request | event_name = 'conviva_network_request' AND responseStatusCode in range 500-510 OR event_name = 'conviva_application_error' AND platform = 'mob' | Metric Builder |
| app crash (App Crashes (v1)) | conviva_application_error | event_name = 'conviva_application_error' AND platform = 'mob' | Trends and Activation |
| app crash (App Crashes (v2)) | conviva_crash_v2 | event_name = 'conviva_crash_v2' | Trends and Activation |
| 5XX server error | conviva_network_request | event_name = 'conviva_network_request' AND responseStatusCode in range 500-510 | Trends and Activation |
| conviva_<element>_click | conviva_<element>_click | Mapped directly. <element> can be any UI element (such as button, link, radio_button, checkbox, and div). |
Trends and Activation |
Custom Events
| Event Type | Semantic Mapping | Metric Building | Metric in App |
|---|---|---|---|
| Custom Events |
|
Use mapped events to build metrics. | Metrics based on the mapped events appear in App pages. |
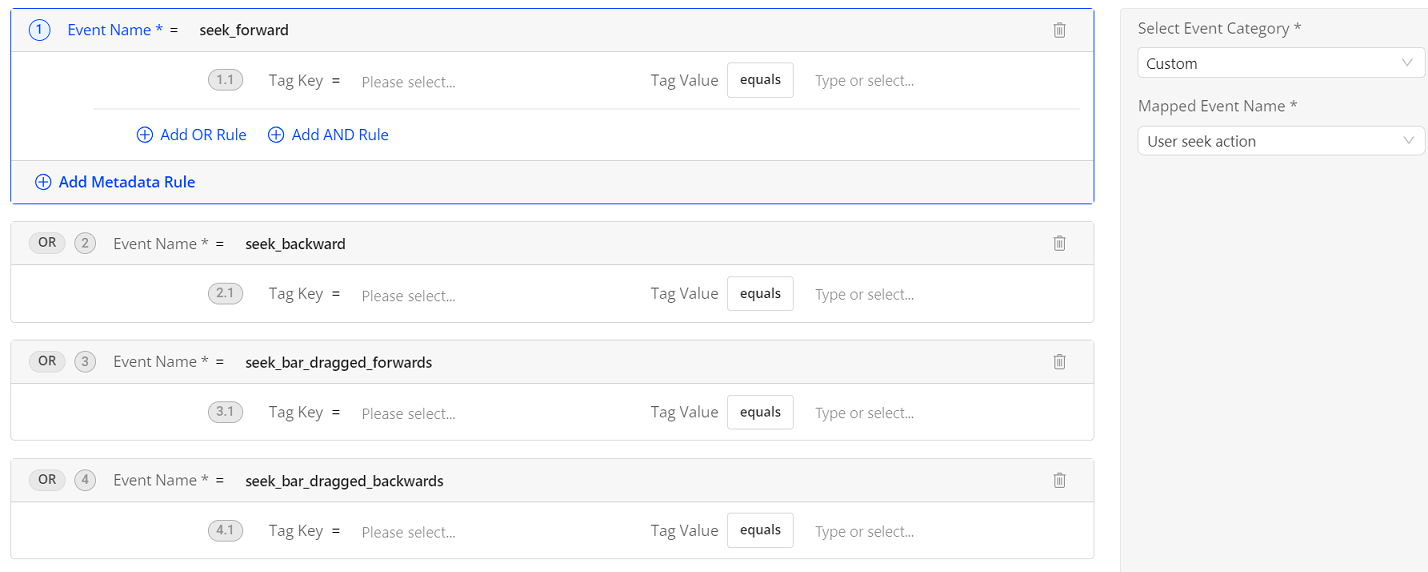
| Video Seek Events: For example, to track and analyze user behaviors when seeking videos, map the custom events seek_forward, seek_backward, seek_bar_dragged_forwards, and seek_bar_dragged_backwards to an event User seek action.
|
|||
| App Login Events: For example, to track the user login behavior and analyze the login success rate, map the event button_click with the tag key button_click_element_text and the tag value Log in to an event Login Button Click.
|
|||

Video Events
With these Video and App SDK versions, Conviva automatically sends video events to the App SDK:
| Platform | Min App SDK | Min Video SDK |
|---|---|---|
| Android | 0.5.2 | 4.0.30 |
| iOS | 0.2.10 | 4.0.31 |
| JS SDK | 0.3.17 | 4.5.13 |
| C SDK | 2.184.0.1 | No |
| Roku | 0.2.3 | No |
| Rust | 1.0.4 | No |
| React Native | 0.2.0 | No |
| Flutter | 0.3.9 | No |
Conviva video events (conviva_video_events) are also available using abbreviations as tag keys.
| For This Element or Activity | Use this App Event Type | Tag Keys | Tag Value | Platform | Example Metrics |
|---|---|---|---|---|---|
| Video events | conviva_video_events |
an: asset name. avgbr: average bitrate in kbps. br: bitrate in kbps. cen: custom event name. ced: custom event data. cl: content length in seconds. clid: client ID assigned by Conviva to the physical device. err: error message. ft: isFatal, a boolean value indicating whether the error is fatal. fw: framework name in which the media player runs. fwv: framework version. iid: instance ID. When several players run on the same device, each player should have a unique instance ID. lv: isLive, a boolean value indicating whether the content currently playing is Live. mn: module name mv: module version name: device name newsc: new state change oldsc: old state change pn: player name sid: session id identifying the current session, unique on this client. sst: session start time as UNIX epoch time in milliseconds. st: session time from the session start in milliseconds. |
c3.sdk.init for Video SDK init c3.video.attempt for attempt event c3.video.end for session end event c3.video.play for play event c3.video.pause for pause event c3.video.error for error event (c3.isFatal as true/false) c3.video.buffering for buffering start event c3.video.bitrate_switch for bitrate switch event c3.video.set_content_info for metadata change c3.sdk.custom_event, c3.video.custom_event for custom event c3.ad.ad_break_start for ad start c3.ad.ad_break_end for ad end CWSStateChangeEvent for audio, subtitle, and closed captions change events |
JavaScript Android iOS Roku (coming soon, api required) |
Video Attempts Video Plays Video Start Failure Error Video Playback Failure Error |
Out-of-Box Metrics and Metadata
Quickly get started analyzing your user experiences with out-of-box metrics and metadata.
Metrics By Metric Category
| Category | Metrics | ||
|---|---|---|---|
| Audience and Engagement |
App Active Time (Interval) (Formerly Active Time) |
||
| QoE and KPI Metrics | |||
| Frustration Signals | |||
| Web User Experience | |||
| Mobile User Experience | |||
| Service Performance |
Mins with 0 Network Response Code |
Mins with 4xx Network Response Code |
|
Metadata as Dimensions
| Category | Metadata | ||
|---|---|---|---|
| App |
App Name Application Build Application Version Bundle Info |
Client ID Customer Account Platform Sensor Version |
|
| User | User Email | ||
| Device |
Browser Name Browser Version Device Hardware Type Device Manufacturer Device Marketing Name Device Model |
Device Name Device Operating System Device Operating System Family Device Operating System Version Traffic Type See Traffic Type for more information. |
|
| GEO & ISP |
ASN Cities Connection Countries |
DMAs ISPs States Zipcode |
|
| Page (Web) |
Edited Page Title First Launch Page Host Page Path |
Page Referrer Page Title Referrer Host |
|
| UTM Parameters (Web) | UTM Campaign | UTM Medium | |
| UTM ID | UTM Source | ||
| Screen (Mobile) |
Edited Screen Title Previous Screen Title |
Screen Title | |
| Network Request |
Network Request Endpoint Network Request Http Method Network Request Response Code |
Network Request Url Host Network Request Url Path |
|
| Events | User Event Category | User Event Name | |
| Errors | ANR Reason | Error Message | |
| Error Event | Stack Trace | ||
| Crash Exception Name (v2) | Crash Message (v2) | Crash Stack Trace (v2) | |
| Global Tags | Dimensions that are based on global tags. | ||
| Event Tags | Dimensions that are based on event tags. | ||
Metrics by Platform
Metric Definitions By Device
Metrics: Native Applications
Native applications are applications installed on mobile devices or TVs.
| Metric | Description |
|---|---|
| App Crashes (v2) | Count of application crashes collected via system APIs (event: conviva_crash_v2), including OOM events, native (NDK) crashes, system-level freezes, and pre-initialization crashes. |
| App Crashes (v1) | Formerly App Crashes. |
| Screen Load Time | The duration, measured in seconds, to completely load a screen in a mobile app. |
| App Startup Time | The duration measured in seconds, for an app to start. |
| Soft Navigation Time | Soft Navigation Time measures the page rendering time from the moment a page navigation is detected until the page is fully rendered and ready for user interaction. |
| App Startup Count | The number of the event app launch during the specified time interval. |
| ANR Count | The total count of conviva_anr events during the specified time interval. |
| Screen Loads | The number of conviva_screen_view events with screen load time greater than 0 seconds and less than or equal to 60 seconds. |
| 5xx Network Response to App Background | The 5xx Network Request Failure to App Background metric counts the number of instances during which a 5xx network request failure is followed by an application transitioning to the background within 10 seconds. |
| Mins with ANR -> Restart | The percentage of one-minute intervals in app sessions with a conviva_anr (Application Not Responding) event followed by an app restart in less than 30 seconds. |
| Mins with Crash -> Restart | App crashes often vary in engagement impact and urgency of app crashes. |
| ANR -> Exit | The percentage of sessions that become inactive within 30 seconds after the app fails to respond. |
| User Sessions With ANR | This metric measures the number of sessions that contain User Sessions With ANR - defined as the percentage of sessions that become inactive within 30 seconds after the app fails to respond. |
| Users With ANR | This metric measures the number of users who experienced ANR within 30 seconds after the app fails to respond. |
| Click -> Error (Beta) | The Click → Error metric captures the number and percentage of user interactions that are directly followed by a web error or mobile crash. |
| User Session with Click -> Error | This metric measures the number of user sessions with Click To Web Error / Mobile Crash - defined as the number and percentage of user interactions that are directly followed by a web error or mobile crash. |
| Users with Click -> Error | This metric measures the number of users who experienced a web error or mobile crash after a click. |
| Crash -> Exit | To identify and respond to critical crashes that drive users to abandon the app, this metric flags how often app crashes and the related memory management, network connectivity, mismanaged errors/exceptions, and other… |
| ANR -> Restart | The percentage of the conviva_anr (Application Not Responding) event followed by an app restart in less than 30 seconds. |
| Crash -> Restart | In addition to app crashes that lead to app exits, it's important to also gauge when there is lower app crash engagement impact and crash tolerance. |
| Rage Click (Beta) | This metric measures the frequency of users engaging in rapid, repetitive clicks on the same UI element, typically indicating a high level of user frustration. |
| Page Loop (Beta) | This metric measures the frequency or the number of instances when the same page URL in a web app is visited three or more times within 15 seconds, highlighting navigation instability or friction within the page… |
| User Sessions with Rage Clicks | This metric measures the number of sessions that contain Rage Clicks—defined as instances in which users perform three or more clicks on the same clickable UI element within a two-second time window without any… |
| Users with Rage Clicks | This metric measures the number of users who performed three or more clicks on the same clickable UI element within a two-second time window without any meaningful interaction or response. |
| Excessive App Restarts (Beta) | Excessive App Restarts measures the frequency or the number of occurrences when an application launches two or more times within a non-overlapping 60-second tumbling window. |
Metrics: Web Applications
| Metric | Description |
|---|---|
| Web Errors | The proportion of sessions with application errors in a web application. |
| Minutes Per Page | The duration measured in minutes, that users spend on each web page. |
| Hot App Launches | The count of hot app launches during the selected interval. |
| Page Loads | The number of document loading activities that occurred during the selected interval. |
| Page Views | The total number of times a webpage fully loads and becomes ready for use during the specified time interval. |
| Page Load Time | The duration, in seconds, for a web application to completely load and parse the basic framework of an HTML document. |
| DNS Lookup Time | The duration in seconds, for a web application to resolve a domain name to the corresponding IP address. |
| Document Response Time | The duration in seconds, that the application takes to fetch HTML documents, excluding scripts and stylesheets. |
| Largest Contentful Paint Time | The duration in seconds, for the largest content element within the viewport of a webpage to become visible to the user. |
| Exits Before Page View | The proportion of exits that occur before the full page is drawn on the screen. |
Metrics: Web and Native Applications
If you integrate both your web and native applications with the Conviva sensor, these metrics are calculated using data from both types of apps.
| Metric | Description |
|---|---|
| Active Devices | The total number of devices that generated at least one event during the specified time interval. |
| Unique Devices | The total number of unique devices with at least one flow that completes or abandons within the user-selected time window. |
| Active Users | The total number of unique users who generated at least one event during the specified time interval. |
| Unique Users | The total number of unique users with at least one flow that completes or abandons within the user-selected time window. |
| Network Request Count | The total number of the network_request event during the specified time interval. |
| Video Bounce Rate | The percentage of sessions that did not include the video attempt event in an app. |
| App Sessions (Interval) (Formerly known as Sessions) | The total count of sessions that occurred during the specified time interval. |
| Network Request Duration | The duration measured in seconds, for web servers to handle network requests, including the time taken to receive, process, and respond. |
| App Sessions (Ended) (Formerly known as Ended Session Count) | The total number of sessions that ended during the specified time interval. |
| Time To First Attempt | The duration, measured in seconds, within a session before the first video attempt. |
| Total Events | The count of mapped events, including both Conviva mapped events and custom mapped events. |
| User Active Time (Ended) | The total session lifetime active user time, in hours, of the sessions that ended during the current interval, not including the timeout window. |
| User Active Time (Interval) | The total active user session time, in hours, during the current interval, not including the timeout window. |
| User Sessions (Ended) | The number of user sessions that ended during the current interval. |
| User Sessions (Interval) | The number of user sessions that were active during the current interval, not including the timeout window. |
| Events per Time | The total events per app active time (interval). |
| App Active Time (Formerly known as Active Time) | The total time user spends in app within a single session. |
| Mins with 0 Network Response Code | The percentage of one-minute intervals in app sessions with network request failures with a response code of 0 (response code = 0). |
| Mins with 4xx Network Response Code | The percentage of one-minute intervals in app sessions with network request failures with a response code between 400 and 499 (response code = 4xx). |
| Mins with 5xx Network Response Code | The percentage of one-minute intervals in app sessions with network request failures with a response code between 500 and 599 (response code = 5xx). |
| Mins with High Network Response Duration | The percentage of one-minute intervals in app sessions with at least one successful network_request event which has a response time longer than 2 seconds. |
| Network Request Failure | The proportion of total count of failed network requests. |
Metrics: QoE and KPI Metrics
| Metric | Description |
|---|---|
| Quality of Experience Index (Beta) | The percentage of non-impacted minutes. |
| Mins Impacted | The percentage of impacted minutes. |
| Mins with ANR | The percentage of one-minute intervals in app sessions during which the conviva_anr (Application Not Responding) event occurred. |
| Mins with Bad Events | The percentage of one-minute intervals with bad events. |
| Mins with Crash | Assess crash severity by measuring how much active time is affected. |
| Mins with High App Startup Time | The percentage of one-minute intervals with app startup duration over the threshold. |
| Mins with High Page Load Time | The percentage of one-minute intervals with page load duration over the threshold. |
| Mins with High Screen Load Time | The percentage of one-minute intervals with screen load duration over the threshold. |
Metrics: Event Metrics (Beta)
| Metric | Definition | Secondary Metrics | Supported Sensors |
|---|---|---|---|
| Event Count | The number of specific event(s) within the selected time interval. | None |
|
| Users with Event | The number of unique users who experienced the event(s) within the selected time interval. | None |
|
| Session with Event | The number of sessions that experienced the event(s) within the selected time interval. | None |
|
Metrics: Flow Metrics
| Metric | Definition |
|---|---|
|
Flow Name Init (Use the first initial event) 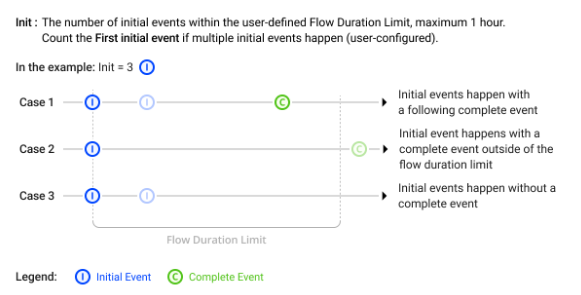
|
The number of initial events within the user-defined Flow Duration Limit, maximum 1 hour. Count the First initial event if multiple initial events happen (user configured). |
|
Flow Name Init (Use the last initial event) 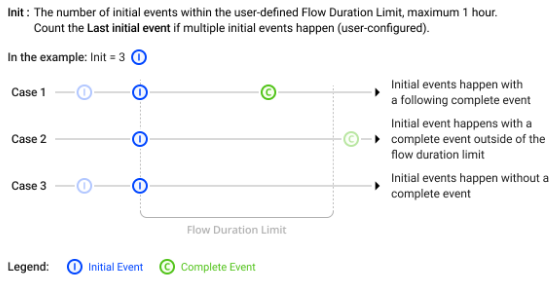
|
The number of initial events within the user-defined Flow Duration Limit, maximum 1 hour. Count the Last initial event if multiple initial events happen (user configured). |
|
Flow Name Complete # % 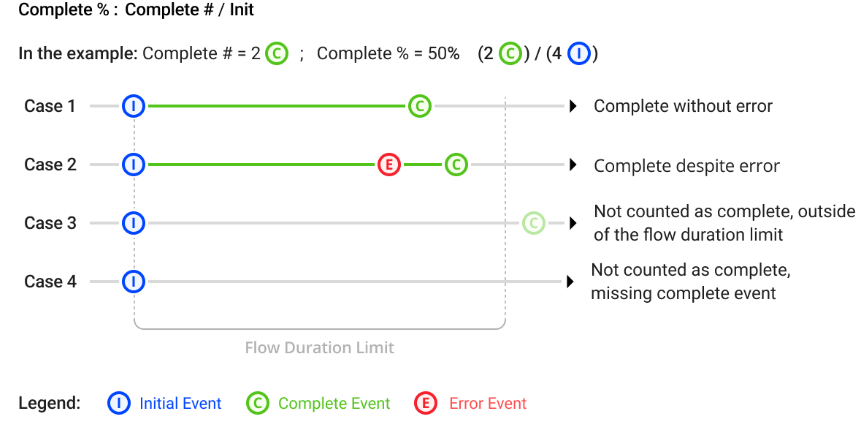
|
Complete #: The number of initial events followed by a complete event within the user-defined Flow Duration Limit, maximum 1 hour. Complete %: Complete # / Init |
|
Flow Name Complete Duration 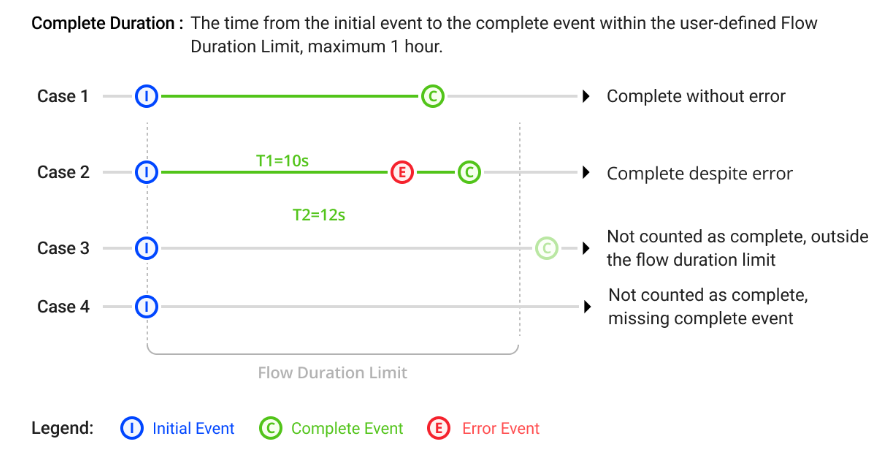
|
The time from the initial event to the complete event within the user-defined Flow Duration limit, maximum 1 hour. |
|
Flow Name Success # % 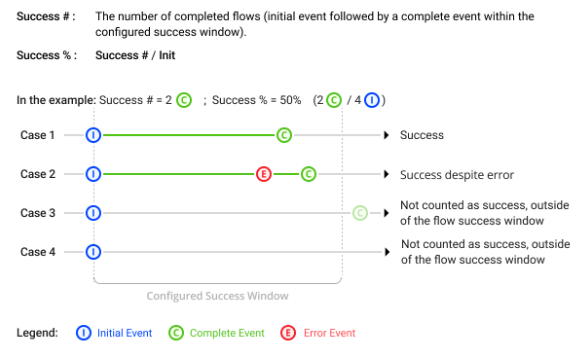
|
Success #: The number of completed flows (initial event followed by a complete event within the configured success window). Success %: Success # / Init |
|
Flow Name Flows with Errors # % 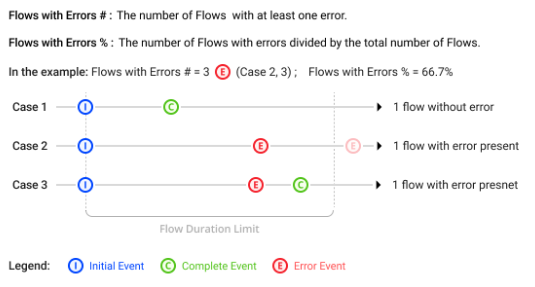
|
Flows with Errors #: The number of Flows with at least one error. Flows with Errors %: The number of Flows with errors divided by the total number of Flows. |
|
Flow Name Abandoned Flows # % 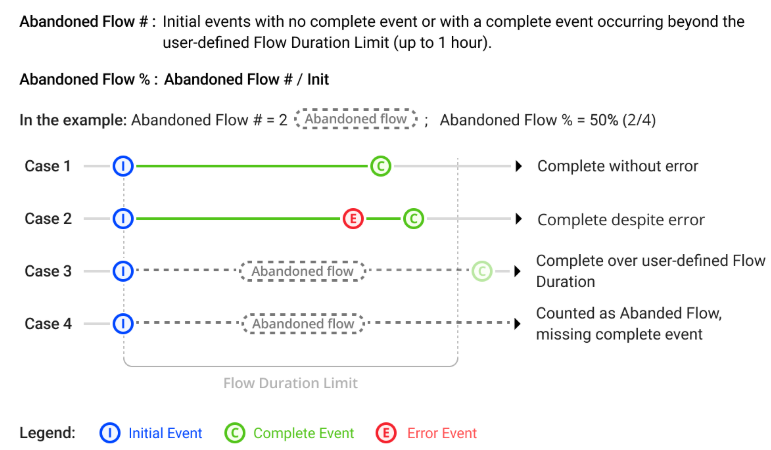
|
Abandoned Flows #: Initial events with no complete event or with a complete event occurring beyond the user-defined Flow Duration Limit (up to 1 hour). Abandoned Flows %: Abandoned Flow # / Init |
|
Flow Name Abandoned Flows with Errors # % 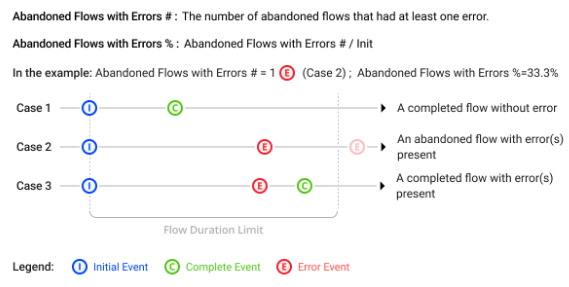
|
Abandoned Flows with Errors #: The number of abandoned flows that had at least one error. Abandoned Flows with Errors %: Abandoned Flows with Errors # / Init |
|
Flow Name Completed Flows with Errors # % 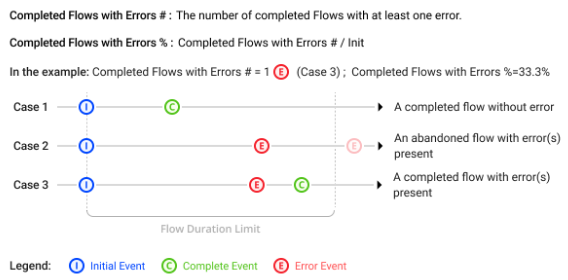
|
Completed Flows with Errors #: The number of completed Flows with at least one error. Completed Flows with Errors %: Completed Flows with Errors # / Init |
|
Flow Name Total Error Count 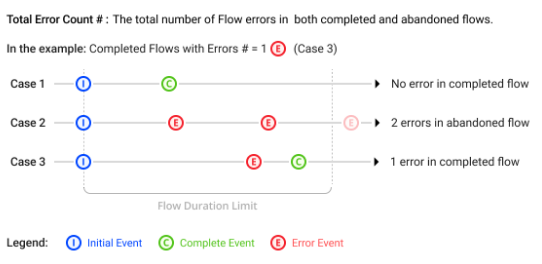
|
The total number of Flow errors in both completed and abandoned flows. |
|
Flow Name Errors in Abandoned Flows 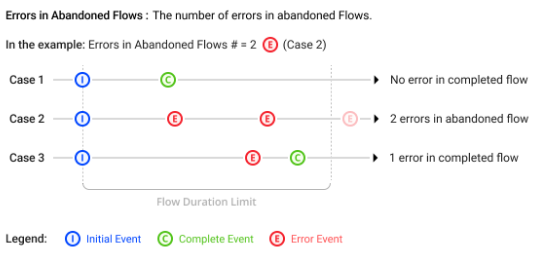
|
The number of errors in abandoned Flows. |
|
Flow Name Errors in Completed Flows 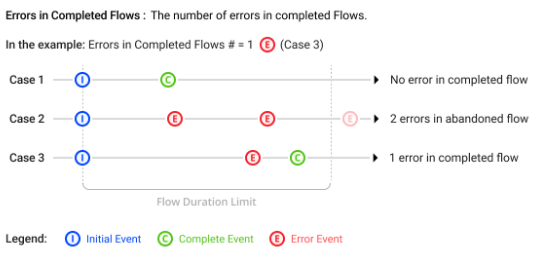
|
The number of errors in completed Flows. |
|
Flow Name Network Request Avg Duration 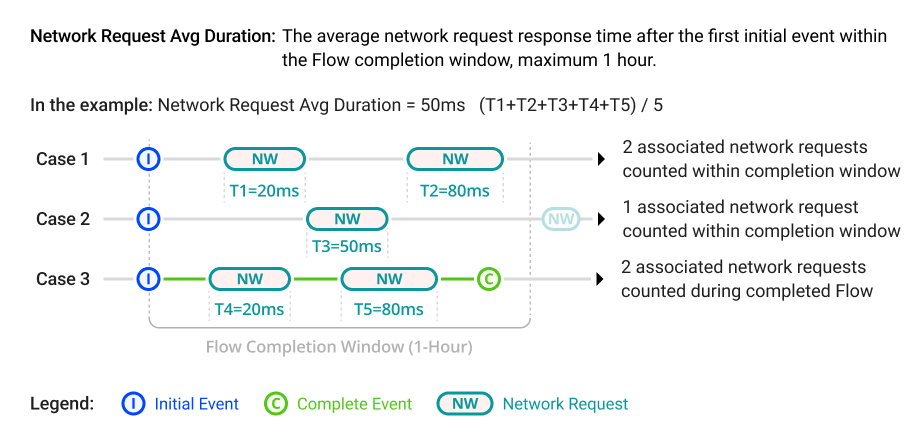
|
The average network request response time after the first initial event within the Flow completion window, maximum 1 hour. |
|
Flow Name Network Request Failure # % 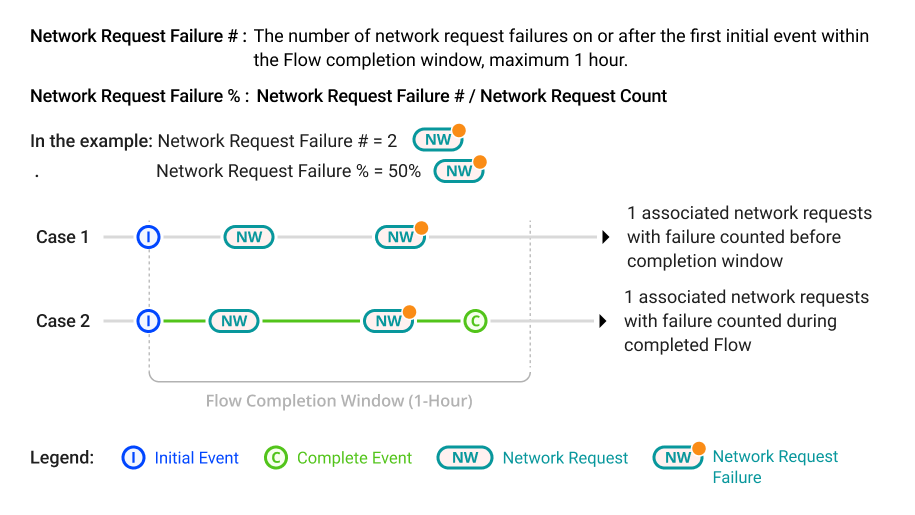
|
Network Request Failure #: The number of network request failures on or after the first initial event within the Flow completion window, maximum 1 hour. Network Request Failure %: Network Request Failure # / Network Request Count |
|
Flow Name Network Request Count 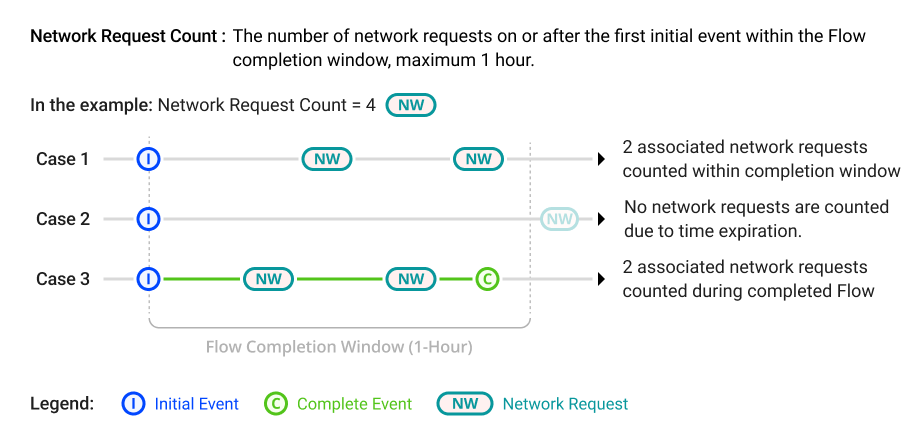
|
The number of network requests on or after the first initial event within the Flow completion window, maximum 1 hour. |
Metrics: Custom Metrics
Custom metrics are associated with specified initial/follow-up events to analyze data for complex user actions and app performance scenarios, such as analyzing the amount of time spent between viewer login and the start of video playtime, and the success rate of cart uploads to completed purchase.
App enables different types of individual metrics. Start mapping from a Conviva predefined event, a custom event, or a combination of both as mapping rules to comprehensively track the desired user behavior.
For how to create custom metrics, see Custom Metrics.