
App provides an easy-to-use interface and an advanced feature set that empowers industry-leading application performance analysis for both native and web applications.
App performance data with real-time, real-user experience monitoring connects app front-end experiences with backend network service performance to monitor and track Service Level Objectives (SLOs), such as engagement metrics, QoE measurements and KPI metrics, service performance metrics, and error messages. Specific data points help provide Service Level Indicators (SLIs) for critical user journey success rates and requried quality of experience levels. User timelines record user interactions for detailed activity summaries and deep understanding of how application performance and network service health impacted specific user experiences.
Getting started with App is straightforward. After integrating with low-code sensor integration, access the out-of-the-box metrics and metadata to monitor application performance metrics and explore dimensional attributes across your web and native application data.
Summary of what you can do:
Using the pre configured dashboards, such as User Experience Dashboard
Semantic Mapper: Enables raw event mapping and customization to simplify event organization and identity mapping.
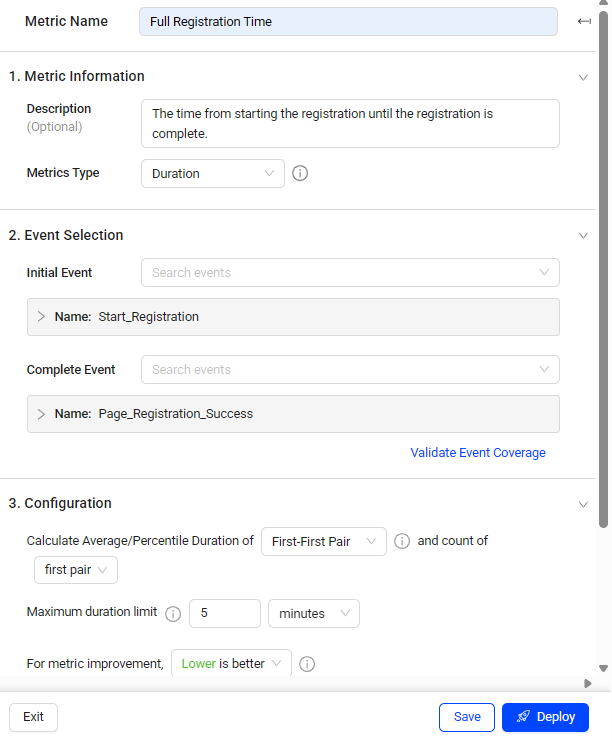
Metric Builder: Helps you build customized metrics including time interval metric and conversion metrics based on the mapped events. For example, create a metric to measure the time taken from the start of the registration or sign-up process to its completion. This metric enables you to analyze the registration process and determine if it is cumbersome.
Sensor Integration
Perform low-code integration of App Sensor to enable automatic, and semantic-less data collection.
Sensor Integration Feature
| Perform These Tasks: | App Sensors |
|---|---|
|
App integration workflow, for example, for Android:
|
For platform-specific app sensor integration instructions, refer to: |
Intellect Data Collection with Remote Configuration
Perform remote data collection updates to dynamically update the sensor data collection without complicated sensor rework.
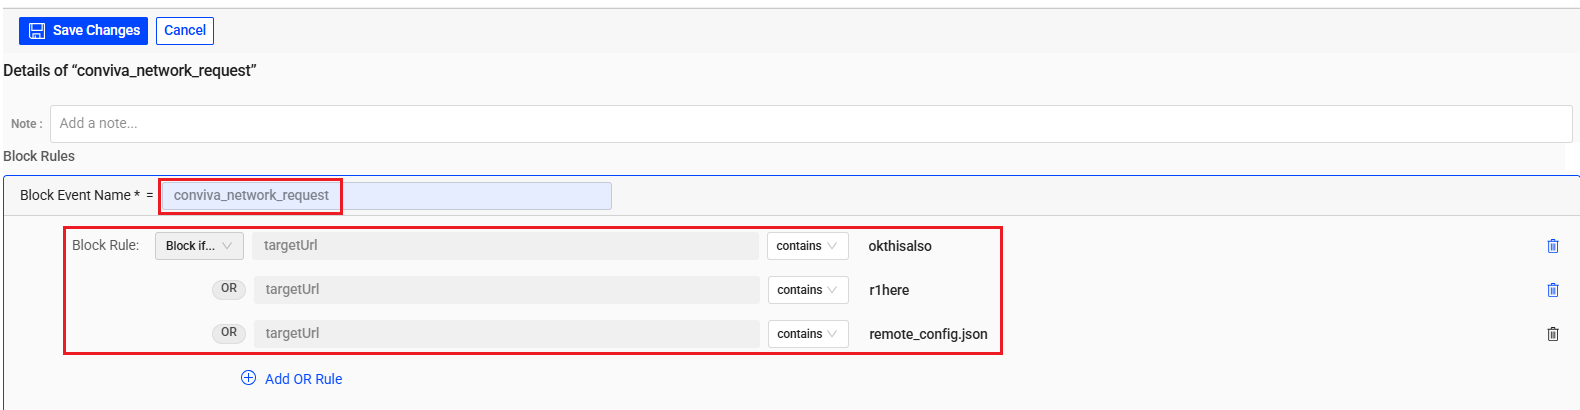
Block Event allows you to efficiently restrict event reporting to limit ingest to the most relevant and meaningful events from the sensor, ensuring the accuracy and relevancy of your experience-centric data.
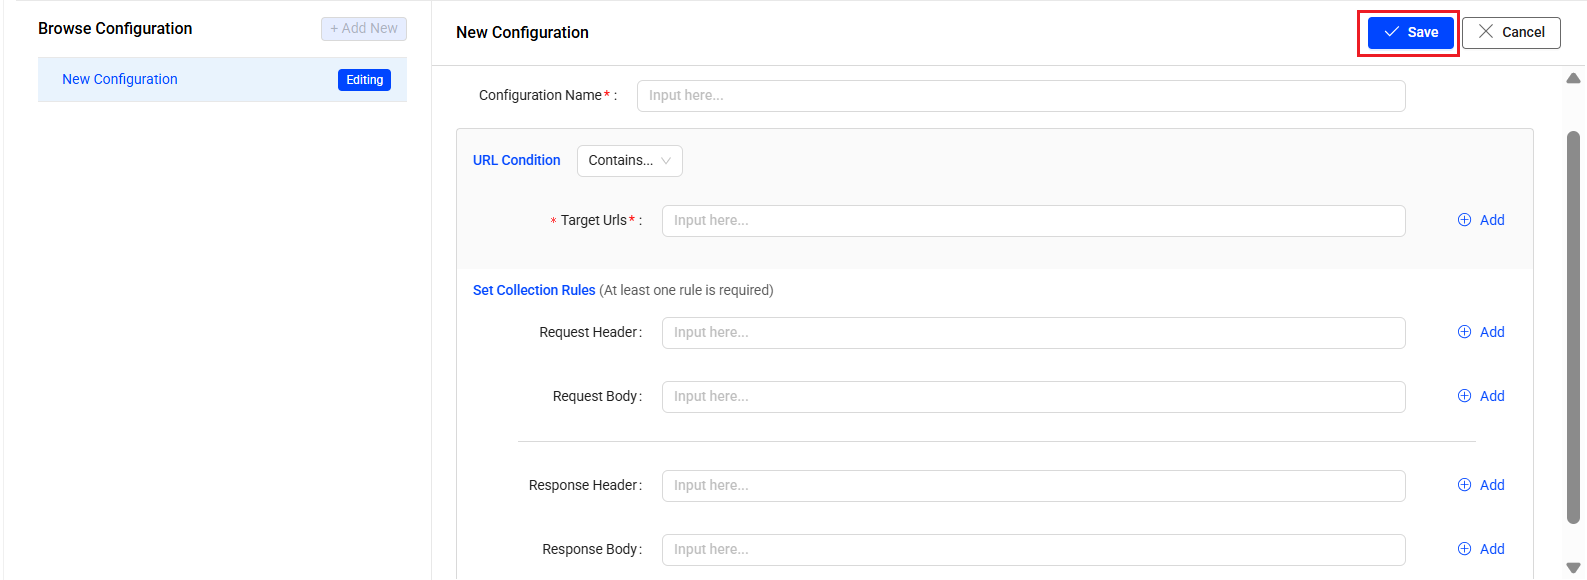
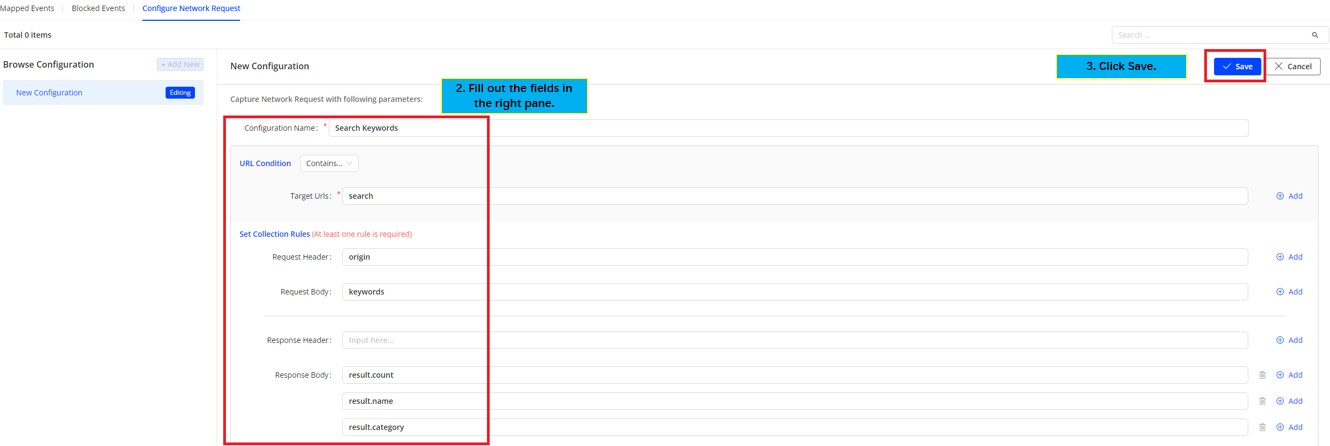
The Configure Network Request tab allows you to set collection rules for conviva_network_request events. When the rules are configured, the Conviva sensor collects events that match these rules. You can then select the collected events as raw data for mapping and metric building. The Management tab also displays all configured collection rules for review and update.
Blocking and Configuring
Blocking Events
| Perform These Tasks: | View Image: |
|---|---|
Learn more: Sensor Remote Control |
|
Configuring Network Request
| Perform These Tasks: | View Image: |
|---|---|
Learn more: Sensor Remote Control |
|
Using Trends
The Trends dashboard provides an easy-to-use interface with an advanced feature set that enables application performance monitoring and user behavior analysis within your applications.
Trends Features
Using out-of-box Metrics to Perform App Analysis
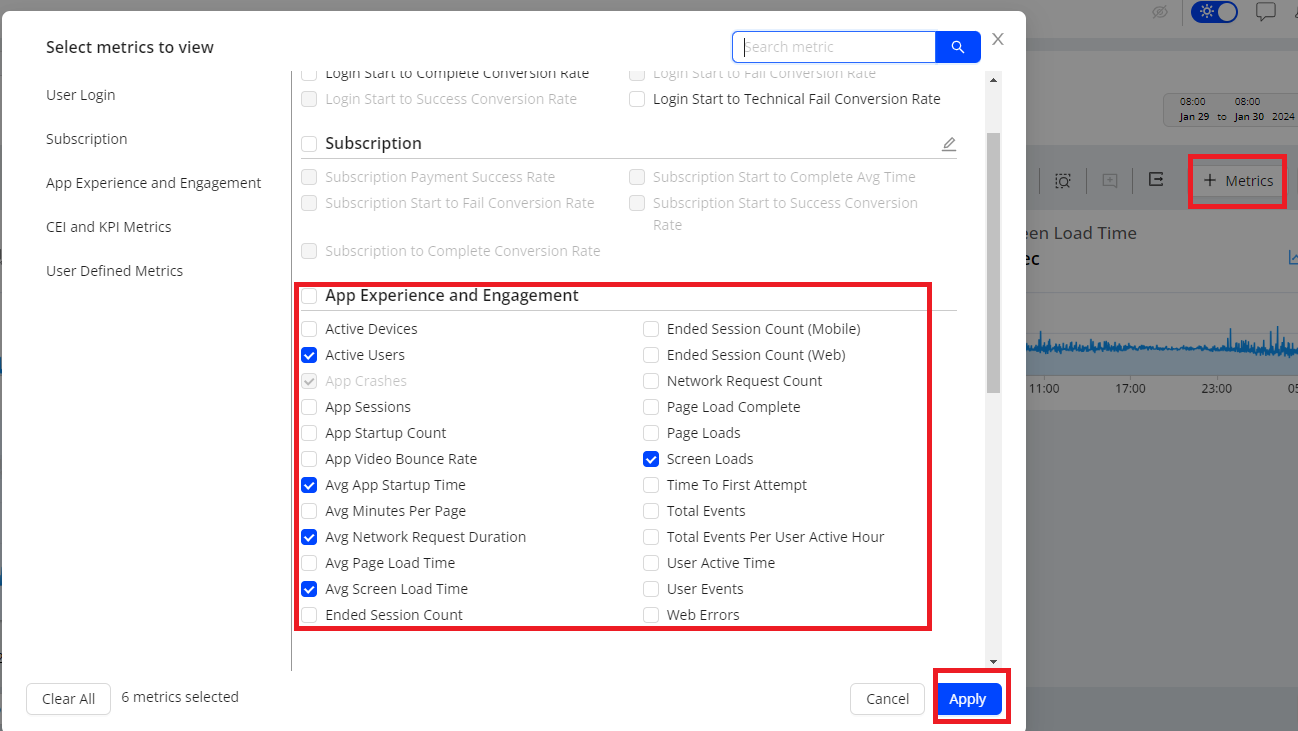
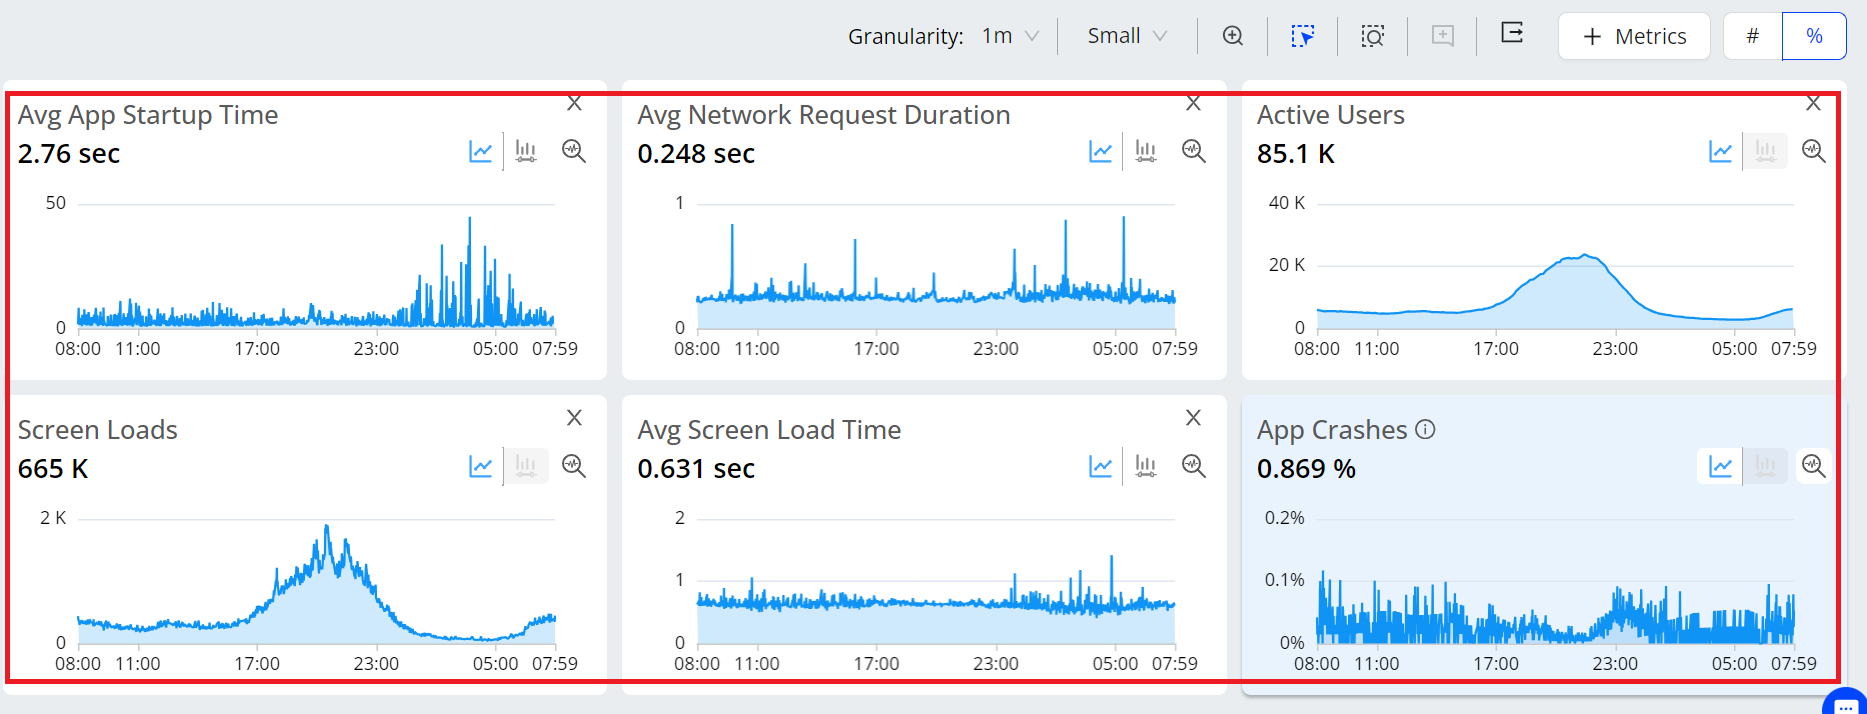
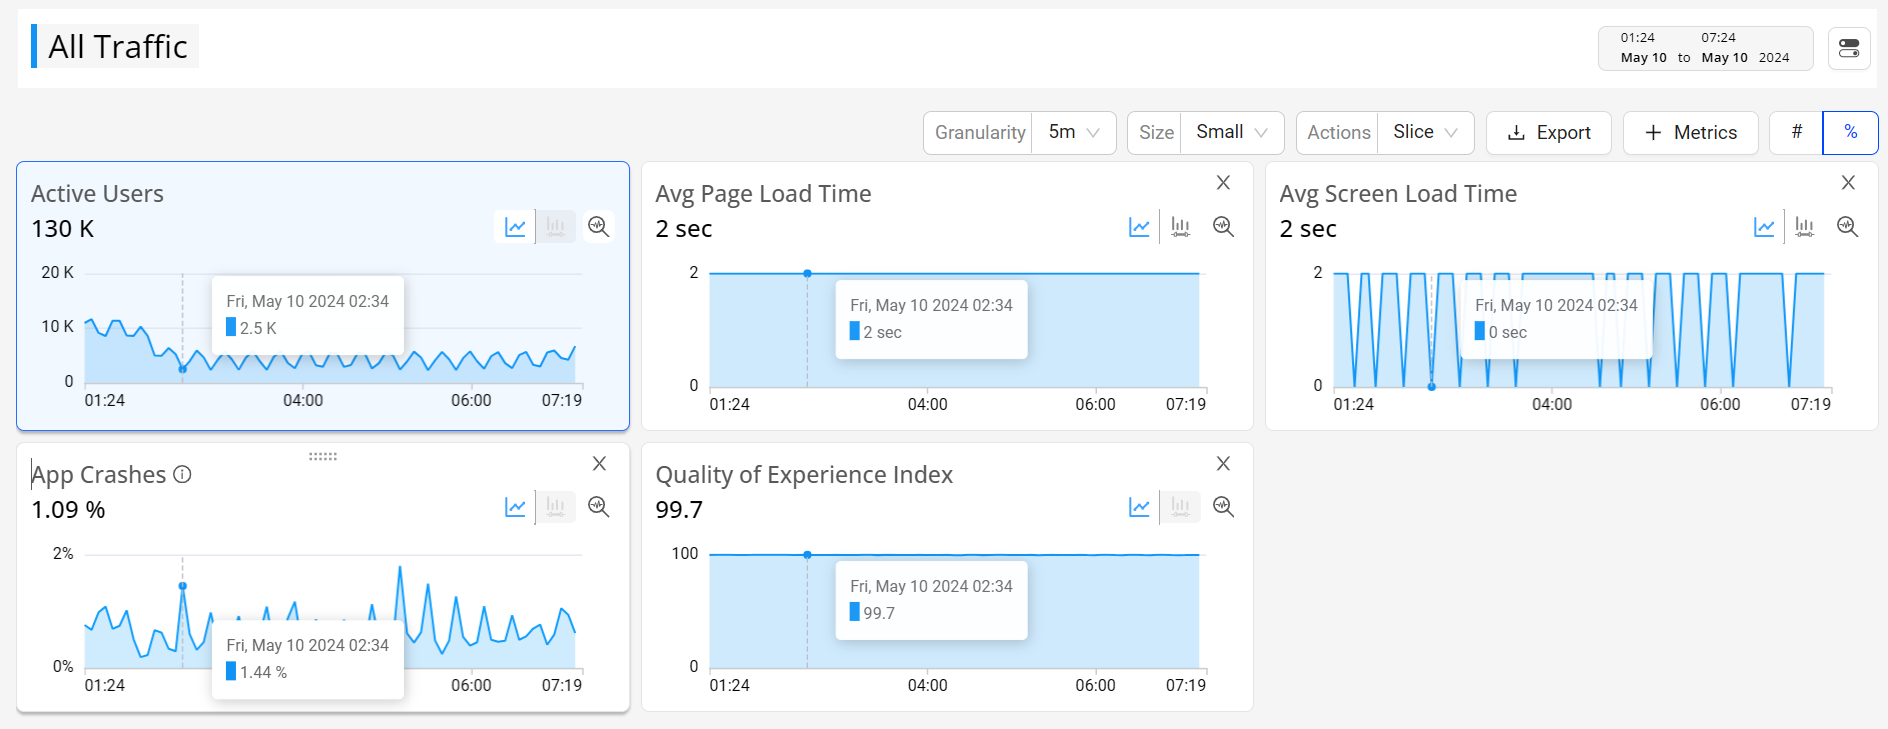
Conviva provides a set of out-of-box metrics, such as App Crashes, and Avg Screen Load Time, to help you quickly access application performance monitoring and user behavior analysis across your web and native applications. Using these metrics, view metric time series in the Trends metric widgets to discover time series performance patterns and anomalies. Also, in Trends drill-down across dimensional values in the dimension drill-down tables to discover impacts and root causes.
For the detailed definitions of out-of-box metrics, check App Metrics.
| Perform These Tasks: | View Image: |
|---|---|
|
|
| 2. Check the metric widget time series and distributions for data insights and performance. Select and slice the data to drill down specific anomalies. |
|
Learn more: App Trends |
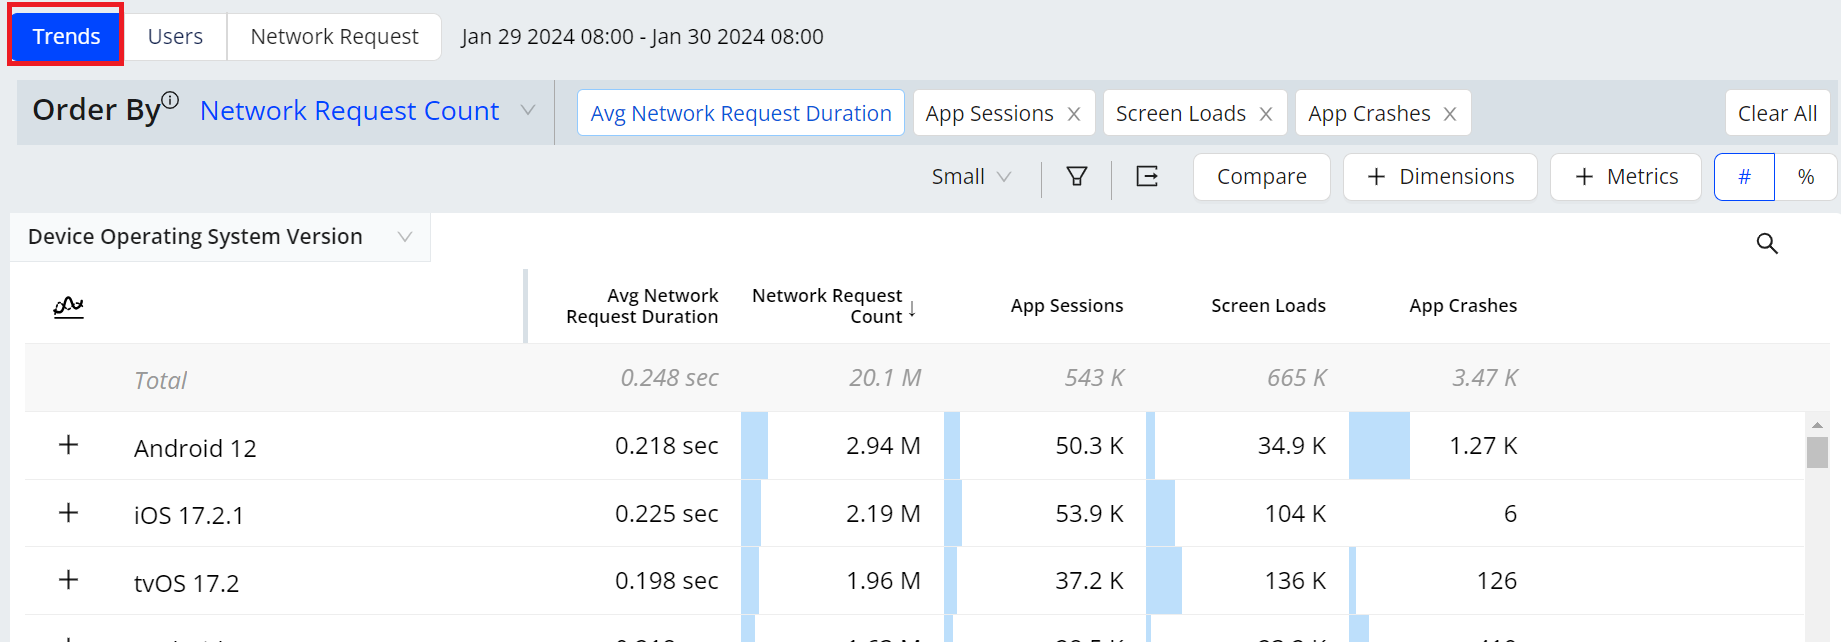
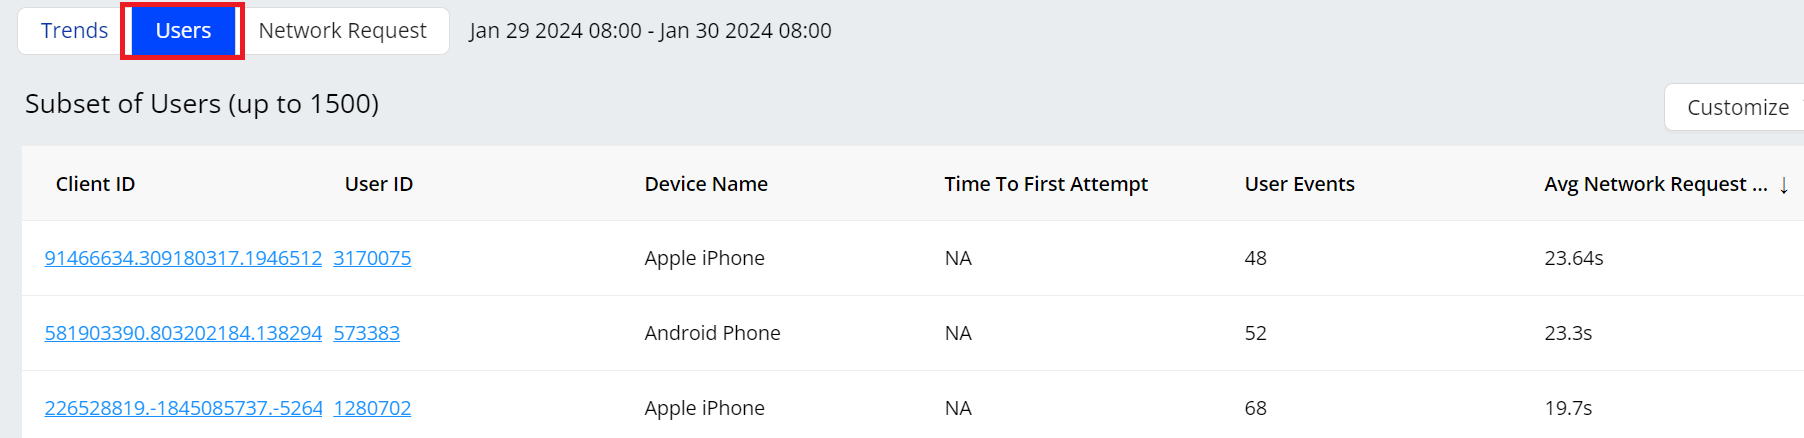
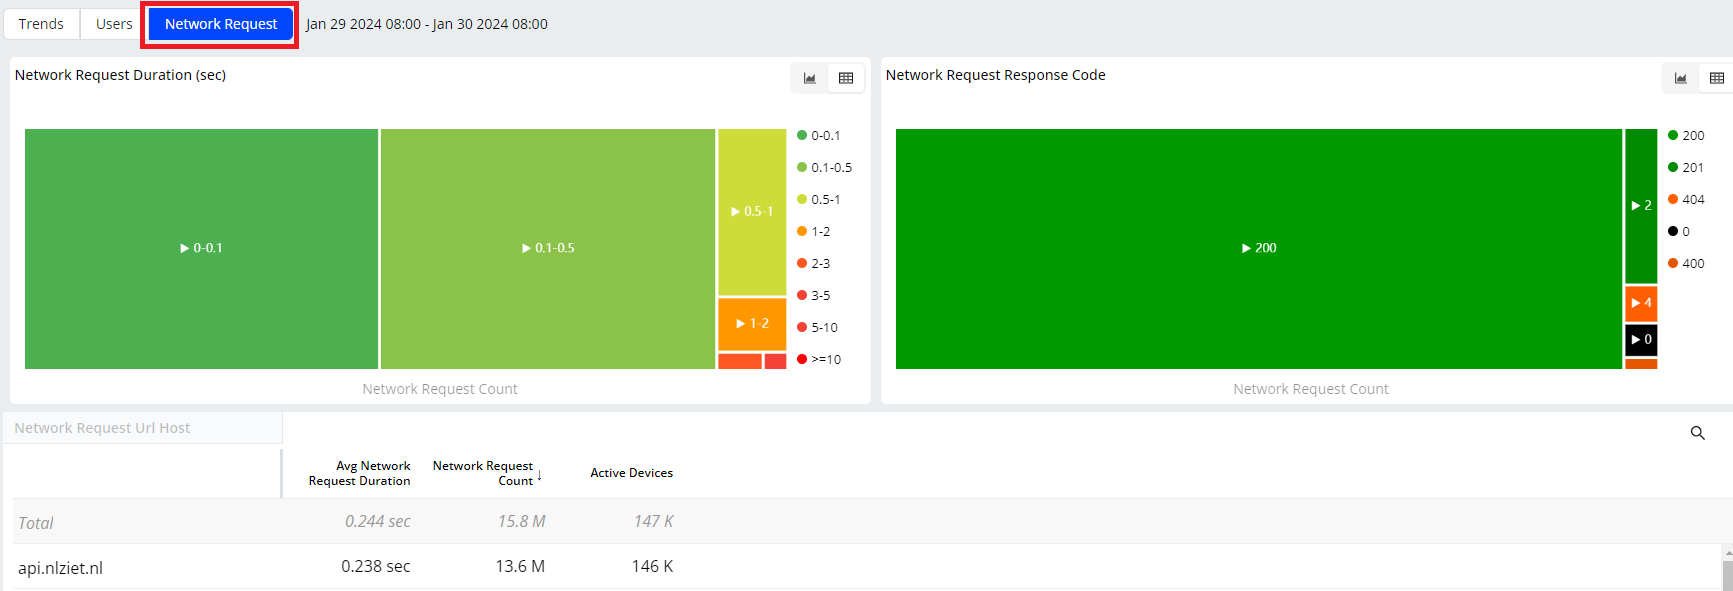
|
Creating User Defined Metrics in Trends
Enable to create user defined metrics directly in App.
Using Presets
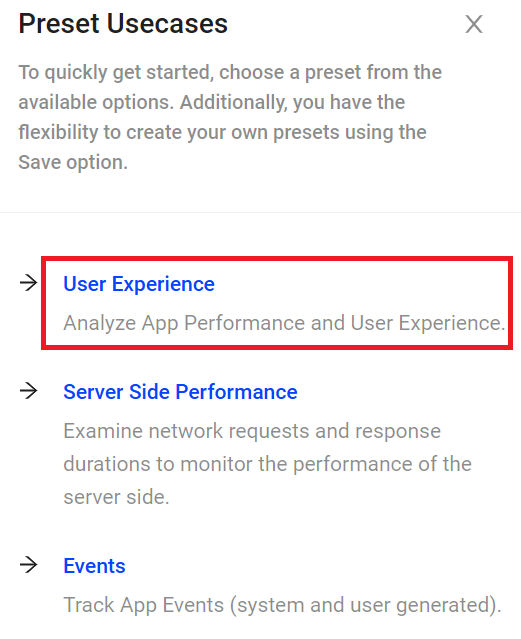
Offer pre-defined features as quick starting points for commonly used metrics and metadata use cases:
User Experience
Server Side Performance
Events
| Perform These Tasks: | View Image: |
|---|---|
Learn more: Preset |
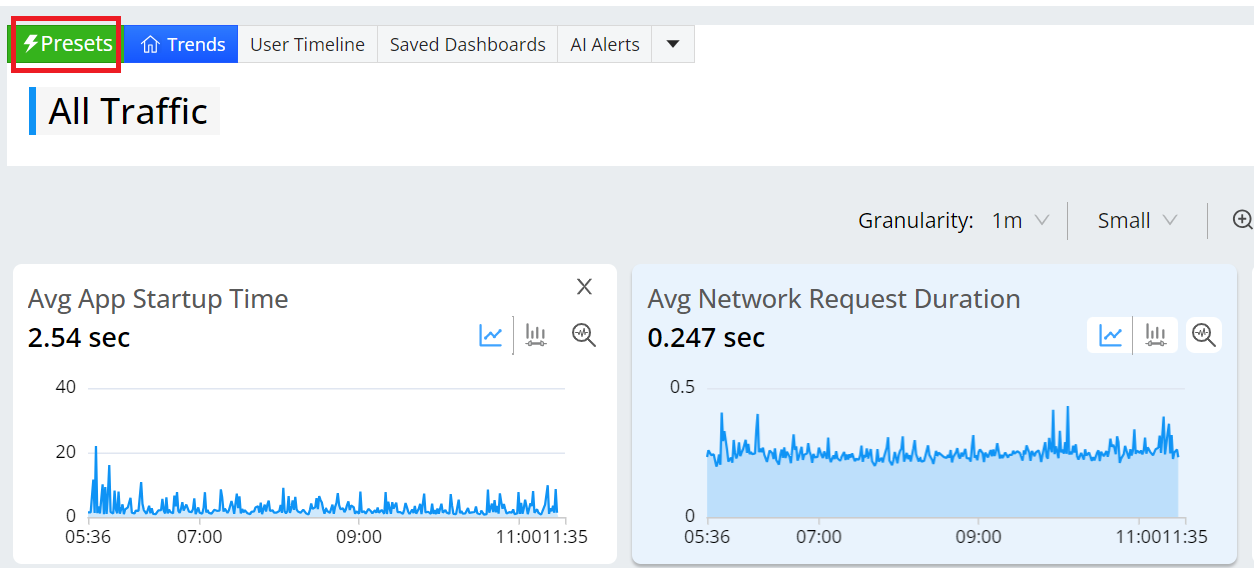
|
Performing Drill-down Analysis
Use drill-down analysis to effectively analyze app issues, identify error messages, and gain insights into user behavior.
| Perform These Tasks: | View Image: |
|---|---|
Learn more: Performing Drill-Down Analysis |
|
Event Discovery
Conviva LiveLens, Paths and Funnels enable event discovery as an important precursor to the development of meaningful and actionable metrics. These dashboards or tabs help identify and analyze key event flows essential for metric creation, such as network request response codes and UI element names.
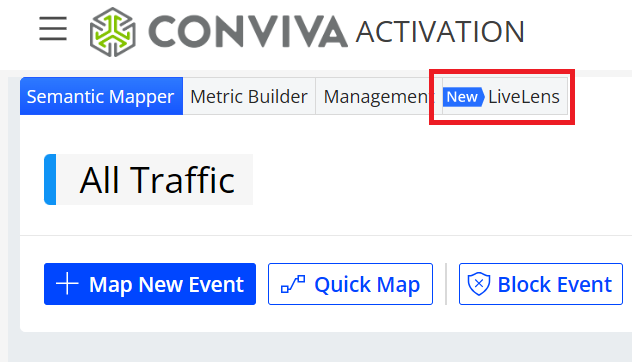
LiveLens: Shows a real-time list of the event names and tags as they occur while using your application. With this feature, monitor the event flows (initial and follow up events) for application activities to discover and confirm the event mappings for building metrics.
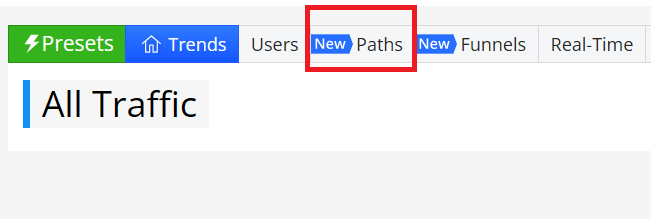
Paths: Visually shows the pattern of events in sequential path flows. This dashboard helps you understand the sequence and composition of events, providing insights for metric creation and potential issue identification.
Funnels: Visually tracks conversion rates across key event progress for selected dimensions. This dashboard helps you understand each step in conversion rates, such as from starting the login process to login success, and highlights potential conversion blocks.
Event Discovery Features
Exploring Events in Real Time
| Perform These Tasks: | View Image: |
|---|---|
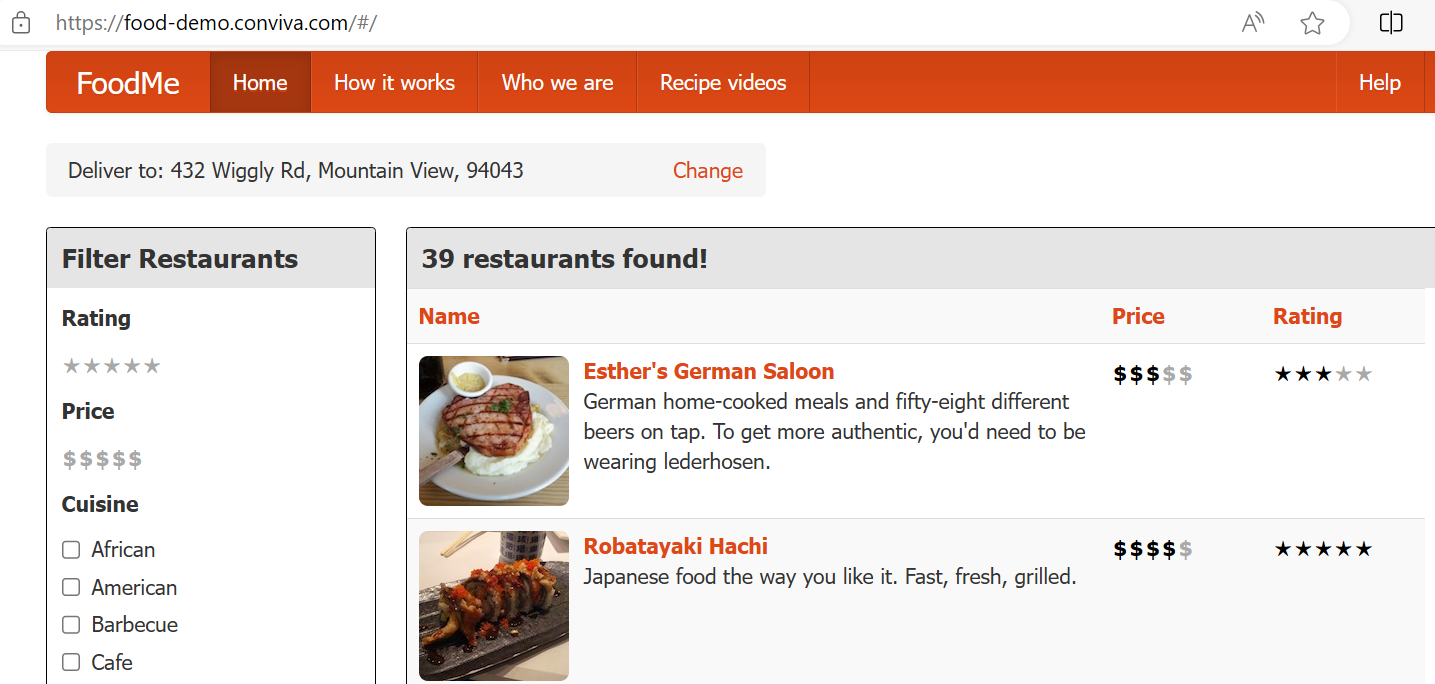
This Conviva demo website simulates the processes and user behaviors for online food ordering. |
|
|
|
If you follow the recommendation in step 2 to use the same network for the demo website and App, click Find to continue. If not, use the search engine on the device that opens the demo website to find the IP address, enter the IP address, and then click Find to continue. |

|
|

|
| 5. Explore the events in the Real-time Timeline area and related event details. |
The Real-time Timeline area shows follow-up events after clicking the Purchase button on the demo website. 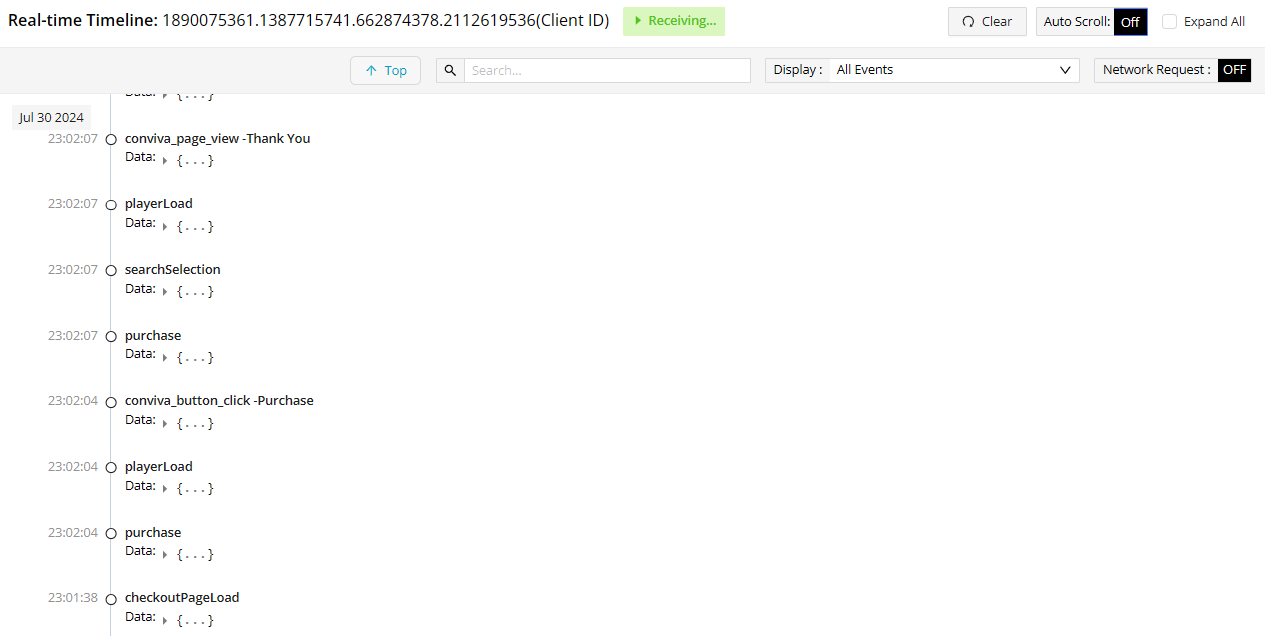
|
|
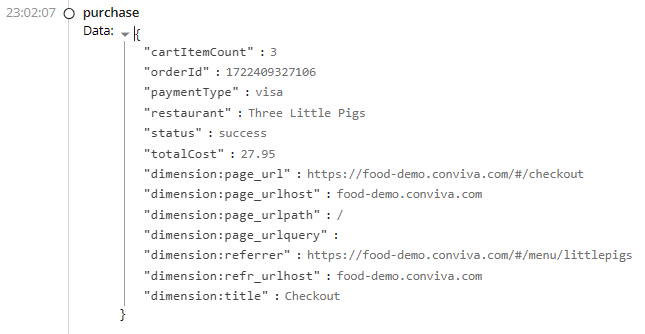
Expand the purchase events to view the details. 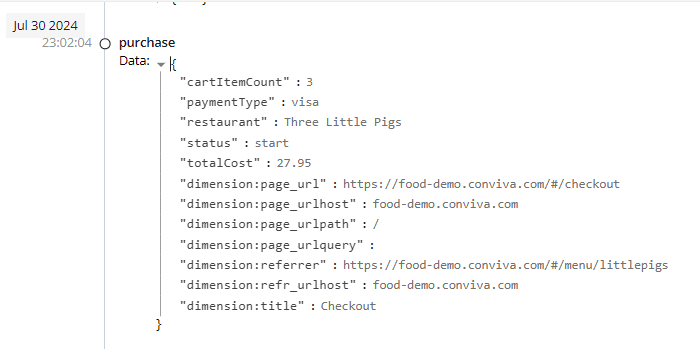
|
|
For more details on how to map events and use complex event combinations to create metrics, check Semantic Mapper and Metric Builder. |
Check Event Sequence and Conversation Rate
|
|
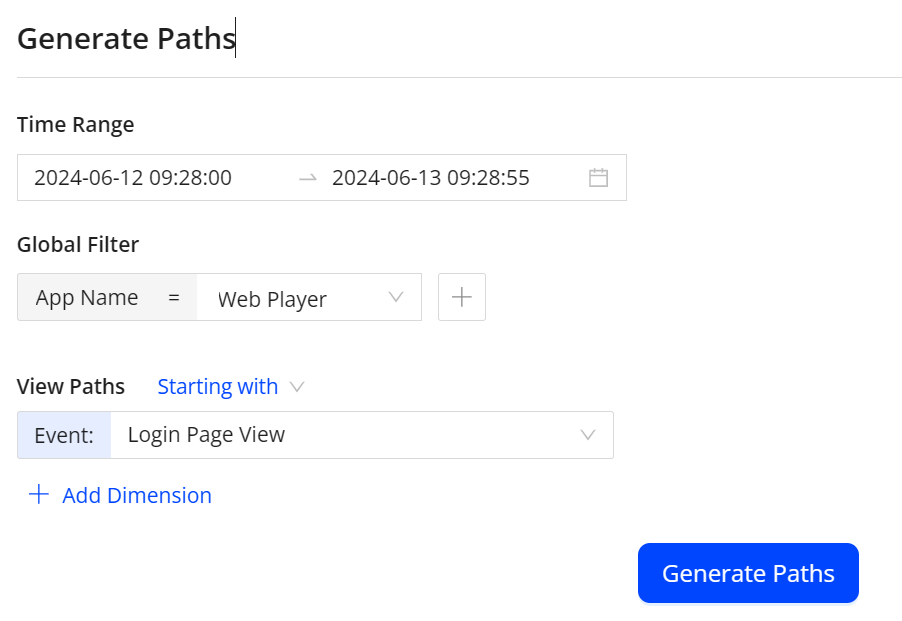
App Name: Web Player Starting with Event: Login Page View |
|
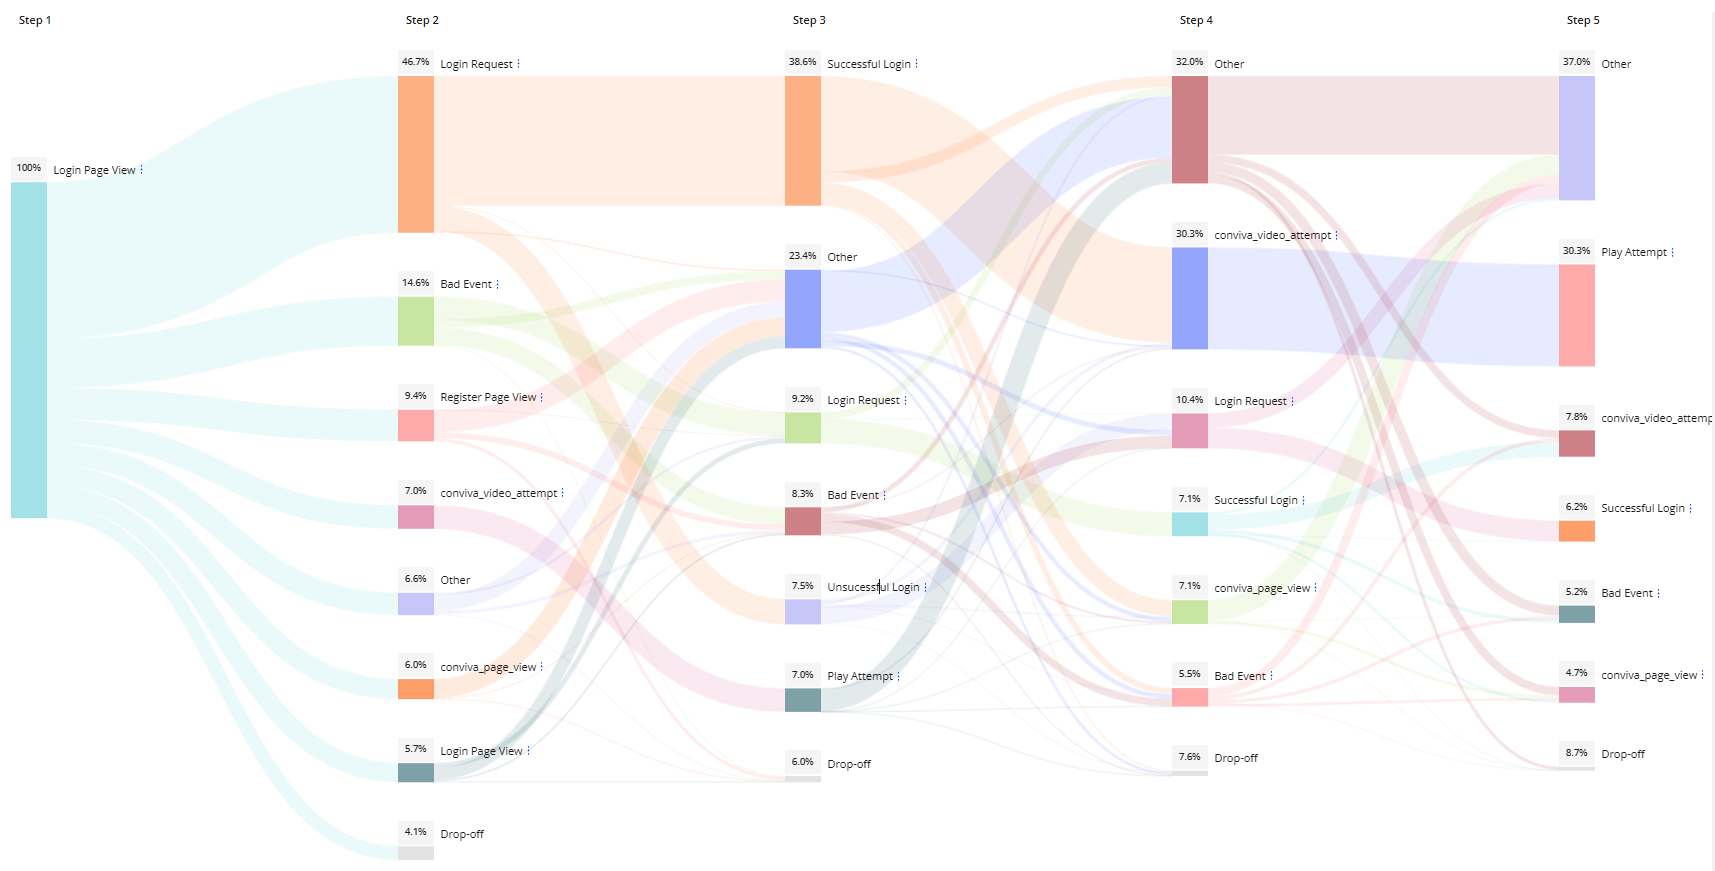
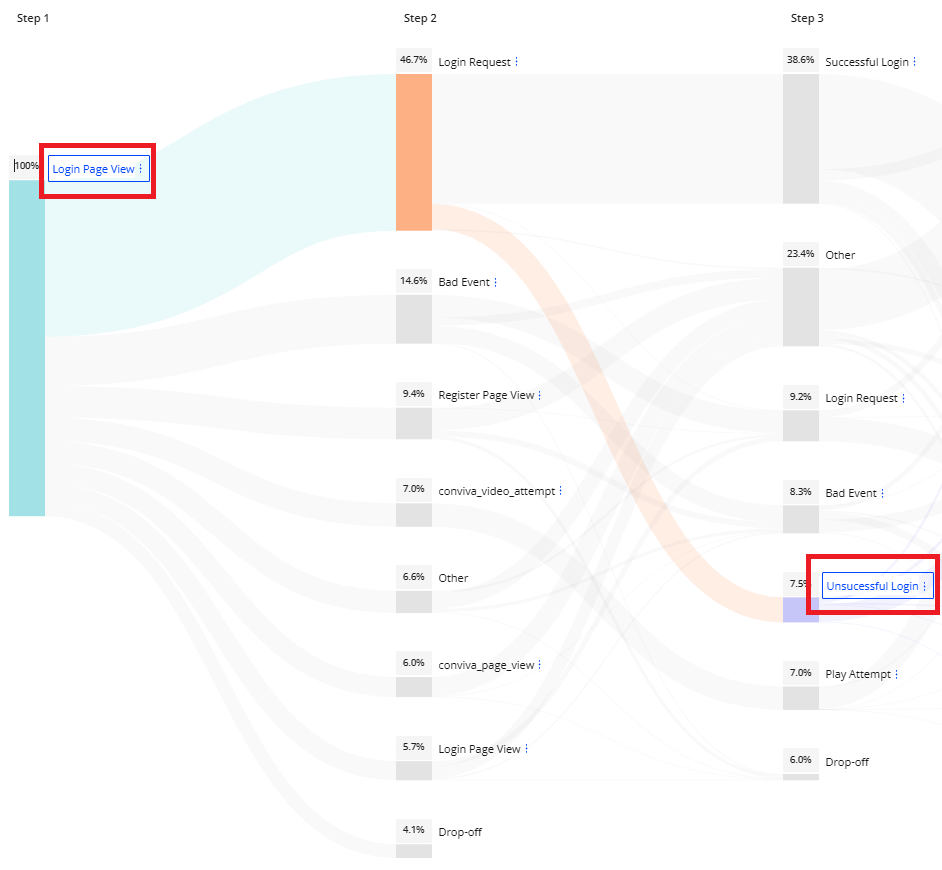
From the created paths, you can identify several events appearing after visiting the login page, such as Login Request, Bad Event, Register Page View, conviva_page_view, and Unsuccessful Login. The Login Page View and Unsuccessful Login events can be used to create a login failure metric for tracking the conversion rate from the starting login process to unsuccessful login. |
|
|
|
|
From the funnel diagram, determine if the conversion rate shows sufficient activity to support the metric creation. In this case, 11.32% is substantial. 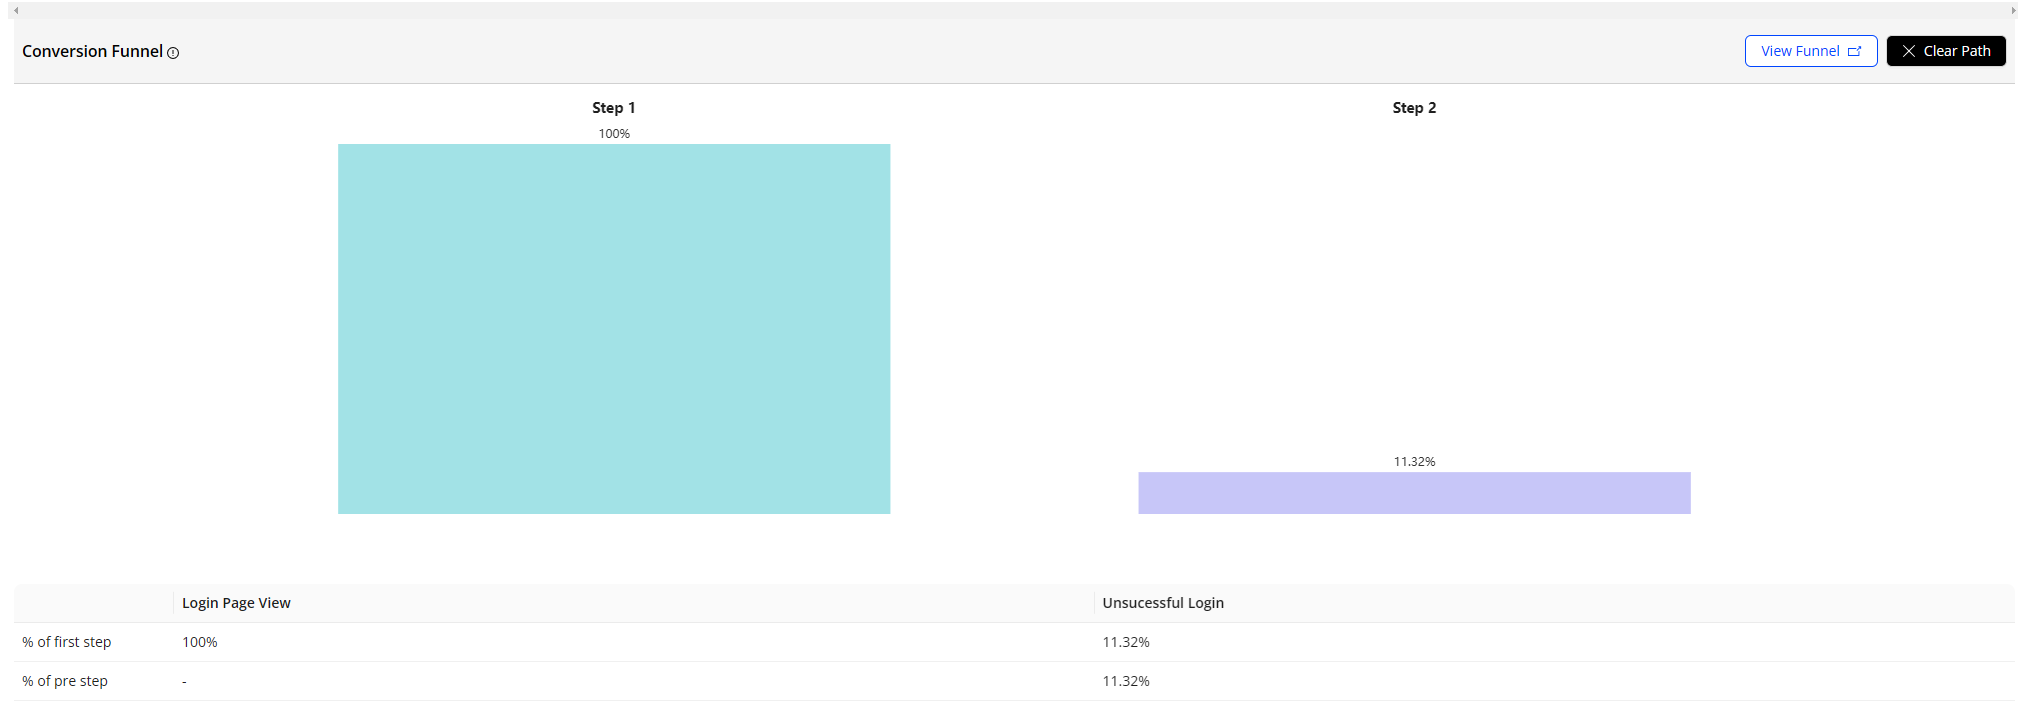
|
|
| 5. Click View Funnel and the Funnel dashboard opens automatically. |
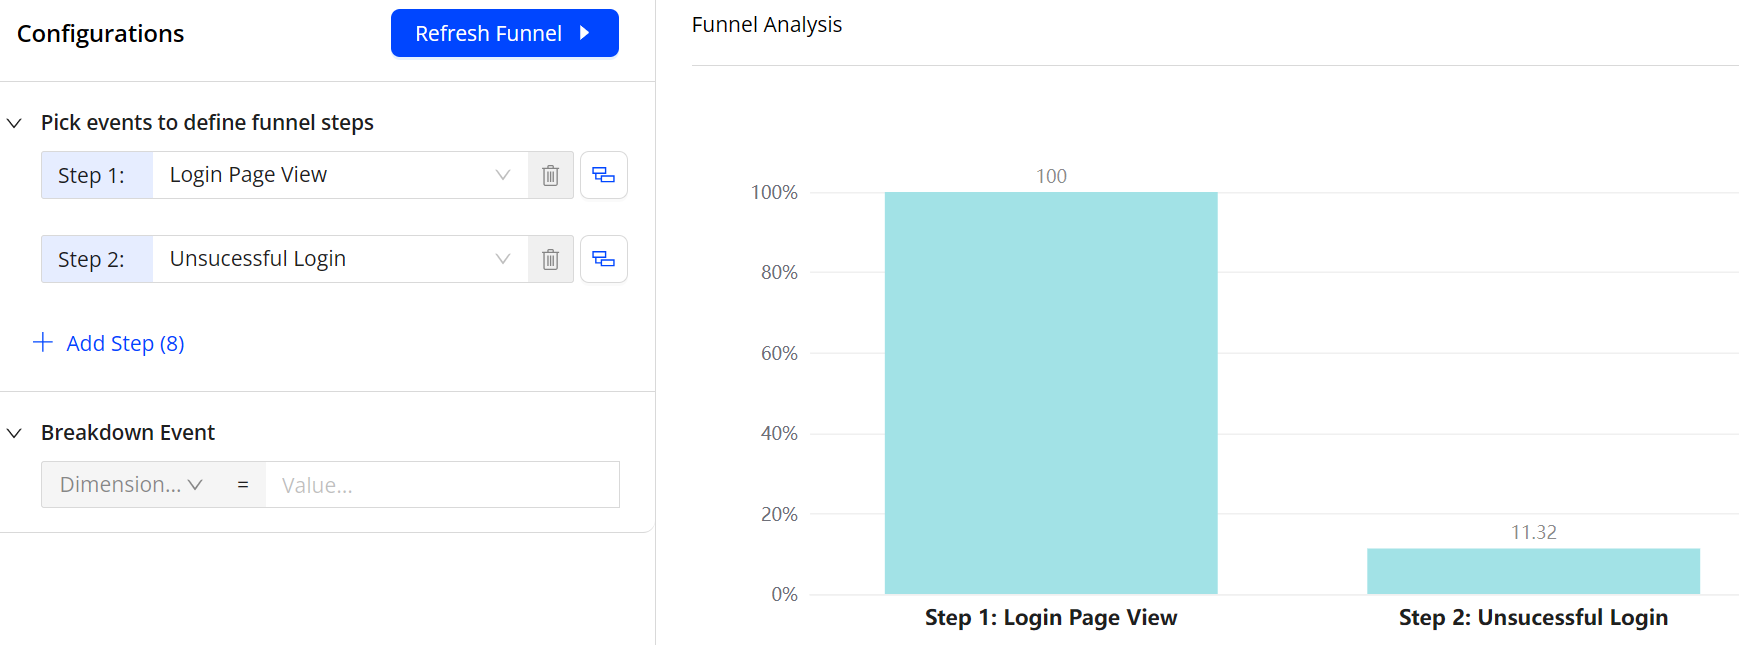
|
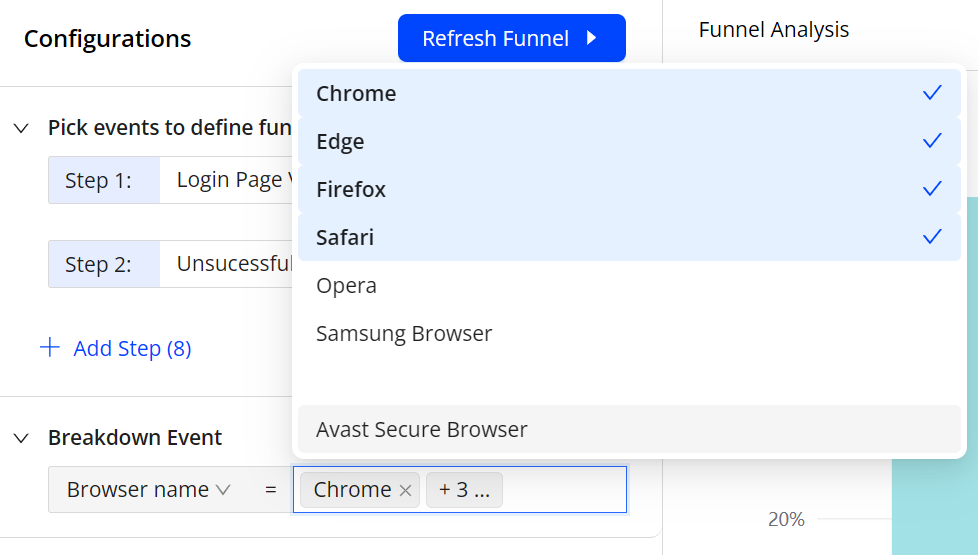
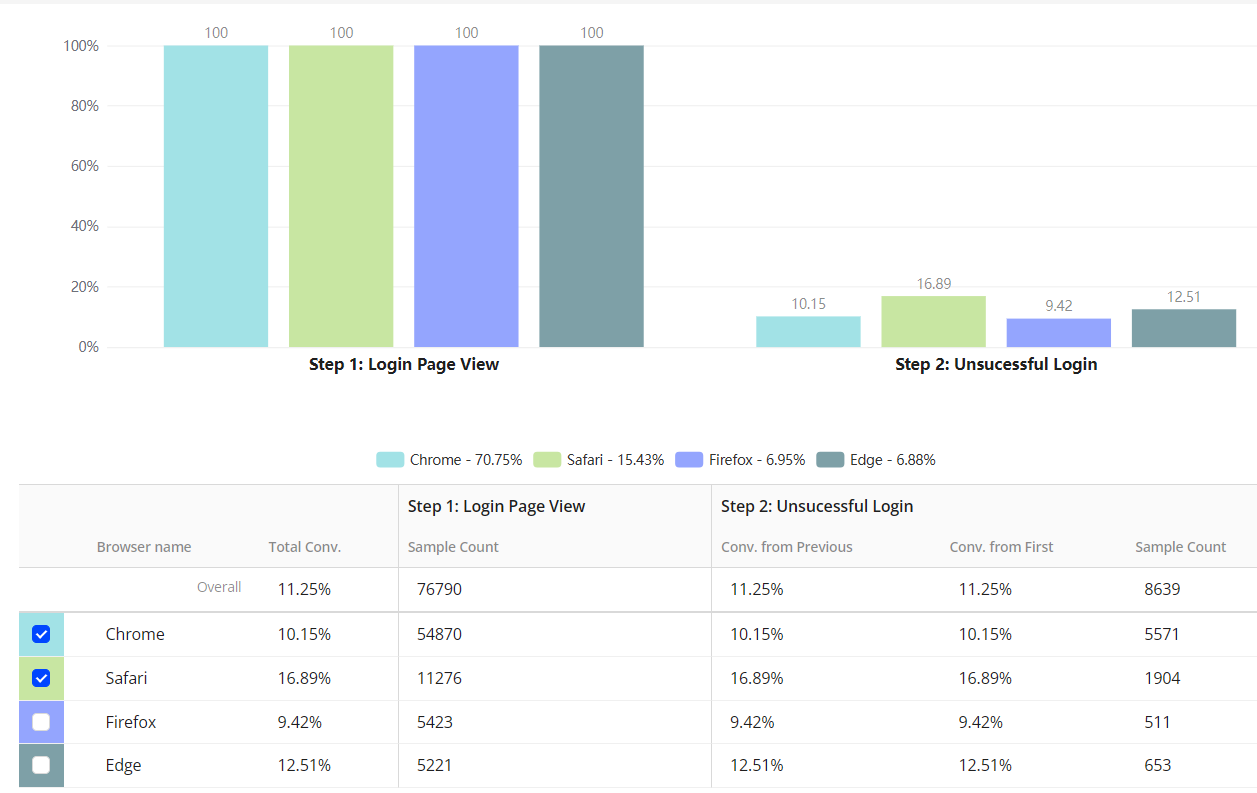
| 6. To track specific data conversion, set the breakdown event. For example, to check the conversion rate in different browsers, select Browser name from the drop-down list and choose specific browsers such as Chrome, Safari, Firefox, and Edge. |
|
With these steps, using the Login Page View and Unsuccessful Login events for a login conversion rate metric provides significant login insights. |
|
Activating Data
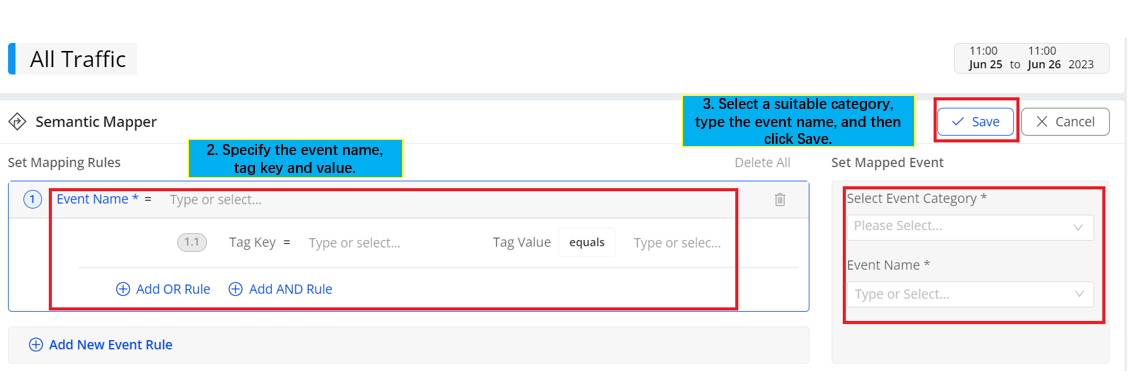
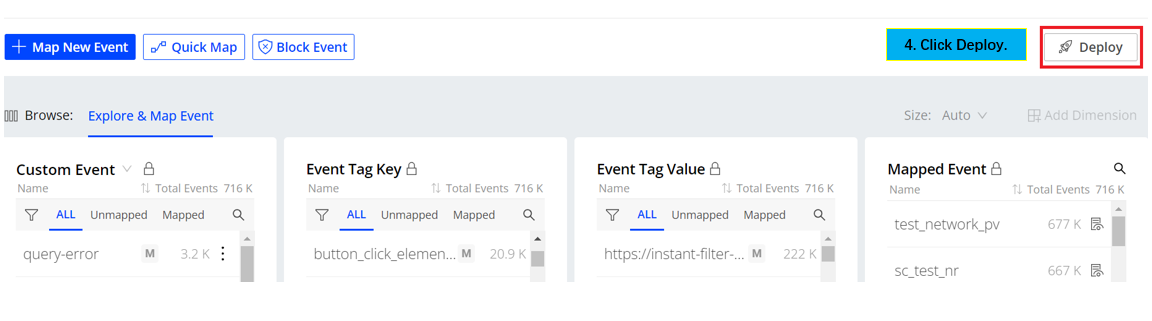
App data activation enables you to map new events and create metrics to efficiently explore and manage the current application events for enhanced insights and do data analysis for more complex scenarios.
Activation Features
Mapping New Event
Map events as App trend drill-down entities to enable deeper analysis using dimensional drill-down.
Map events to create customized metrics.
| Perform These Tasks: | View Image: |
|---|---|
Learn more: App Activation |
  |
Creating Flow Metrics
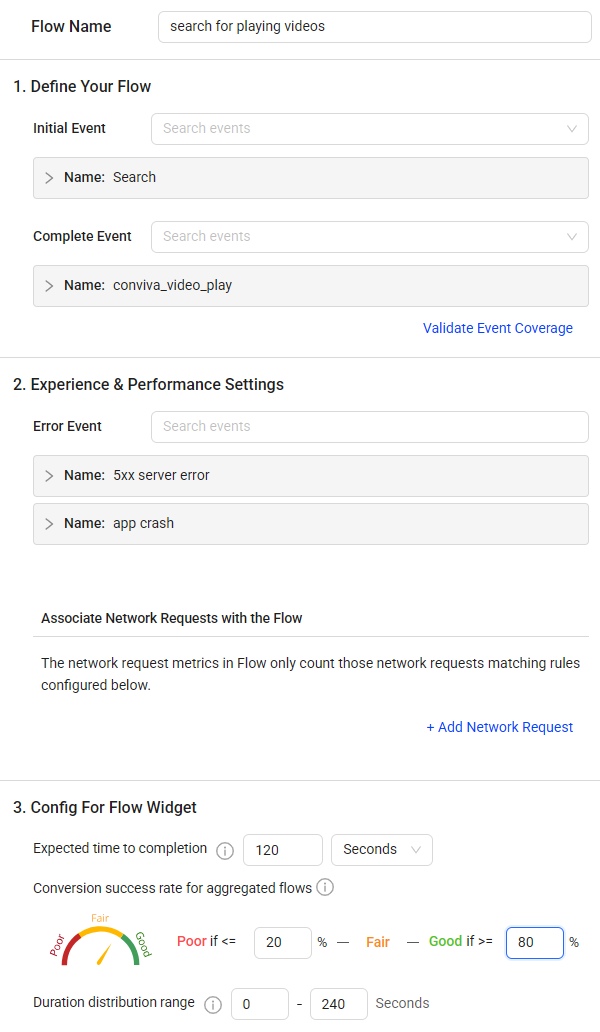
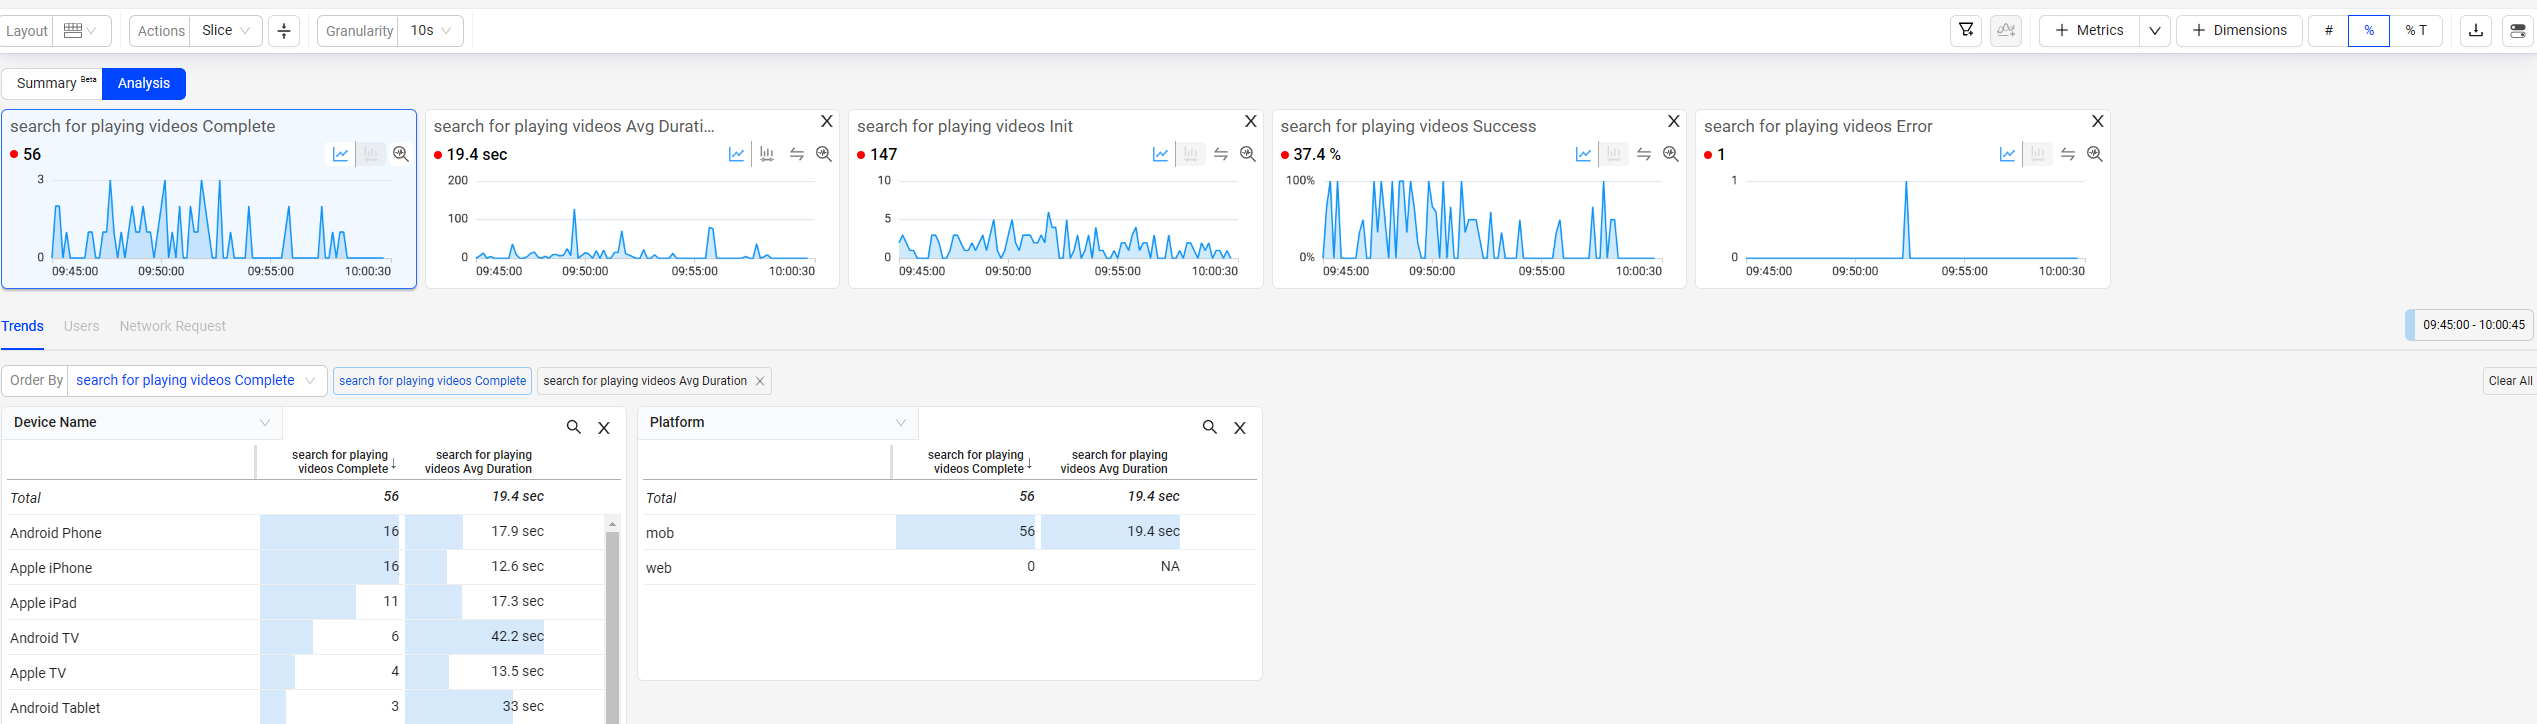
App enables flow metrics that reflect user journeys, supporting performance monitoring and measurement of critical application actions to optimize app outcomes and user experience.
| Perform These Tasks: | View Image: |
|---|---|
|
|
|
|
| 3. (Optional) Provide the Flow description and select or create a labels to clarify the Flow use in the UI. | |
|
|
| 5. Set experience and performance settings. | |
|
|
Learn more: Flows |
|
Building Custom Metrics
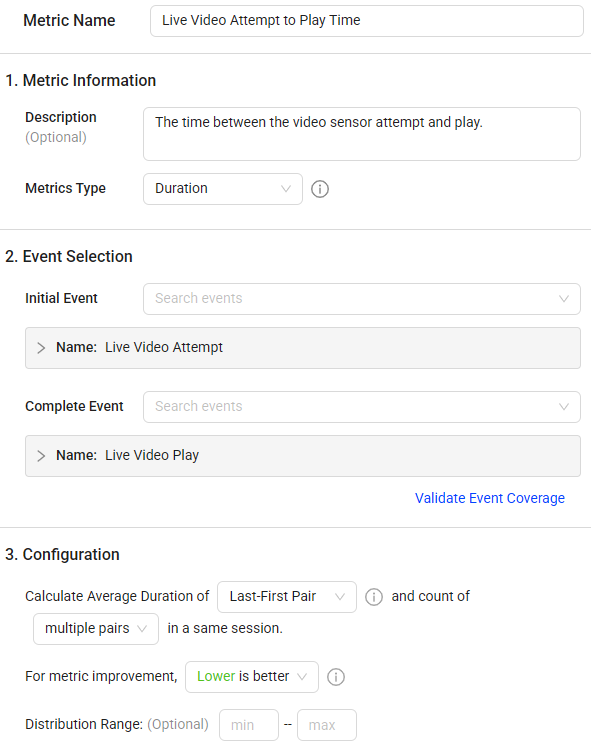
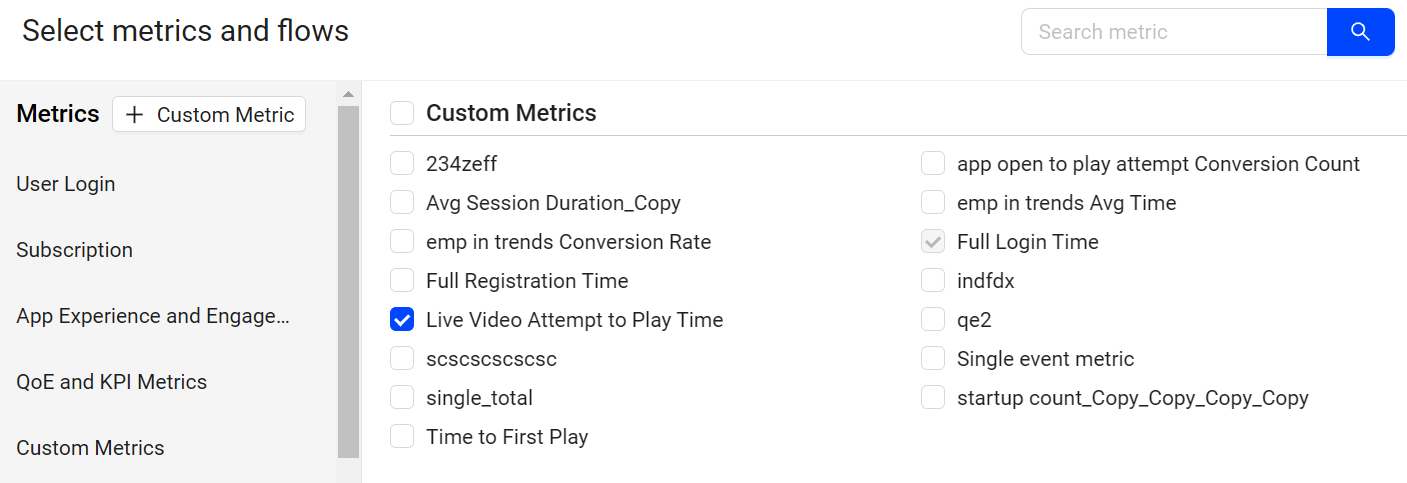
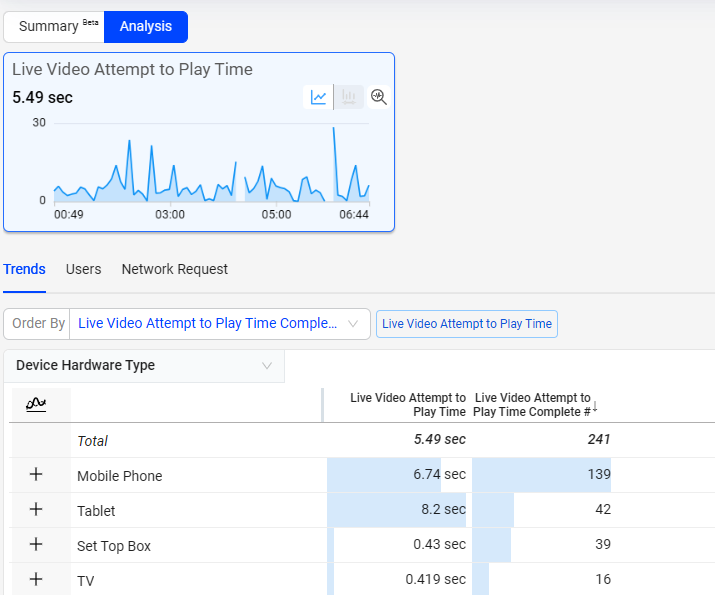
Customize metrics to analyze data for complex scenarios, such as analyzing the login process time.
| Perform These Tasks: | View Video: |
|---|---|
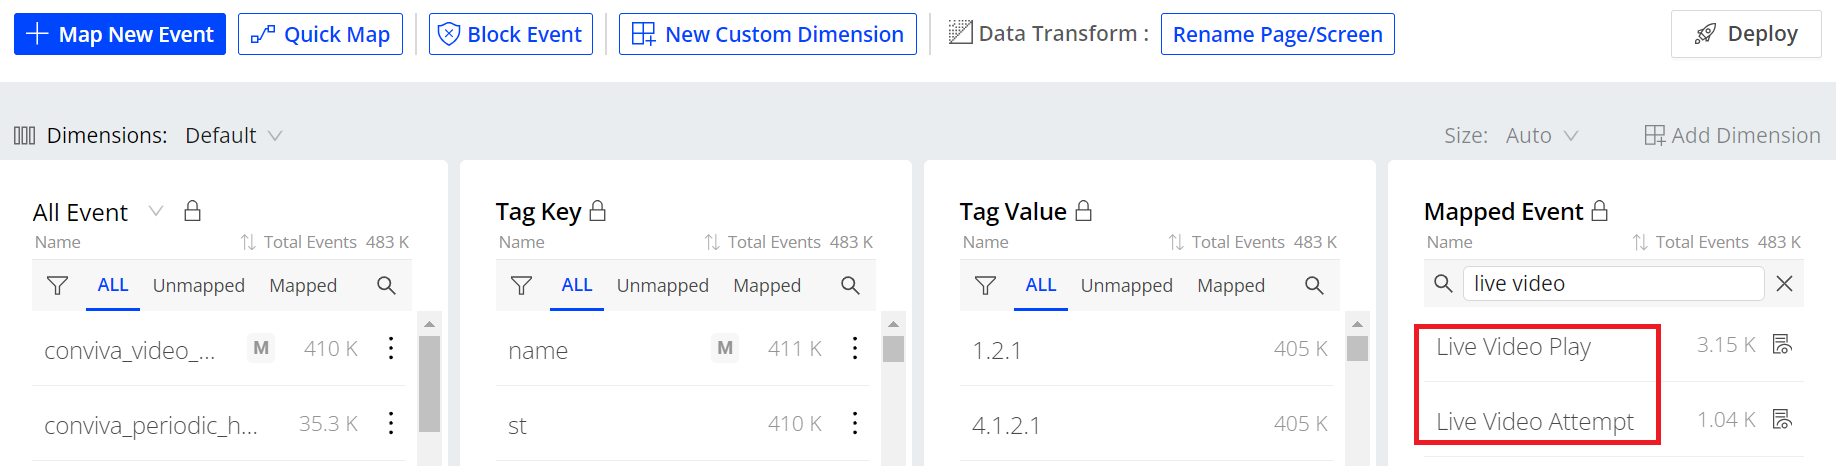
| 1.Confirm mapped event(s) are available. If they are not, map event(s). |
|
|
|
Learn more: Custom Metrics |
|
Setting Collection Rules for Network Requests
Set collection rules for _conviva_network_reques_t events. When the rules are configured, the Conviva sensor will collect events that match these rules. You can then select the collected events as raw data for mapping if necessary.
| Perform These Tasks: | View Image: |
|---|---|
Learn more: Configure Network Request |
|
Managing Data
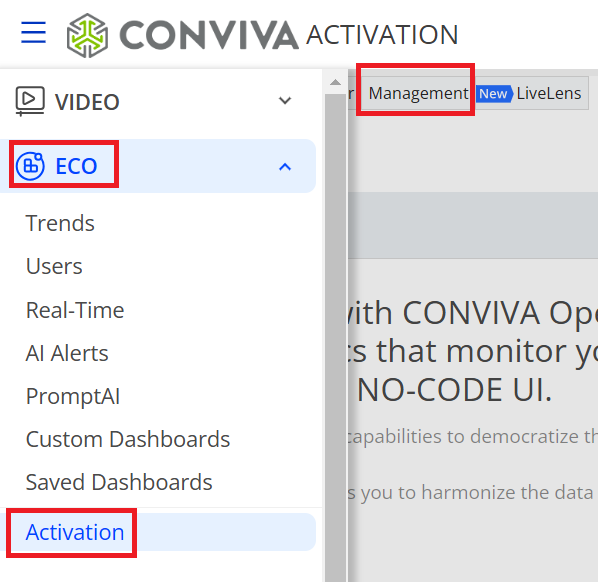
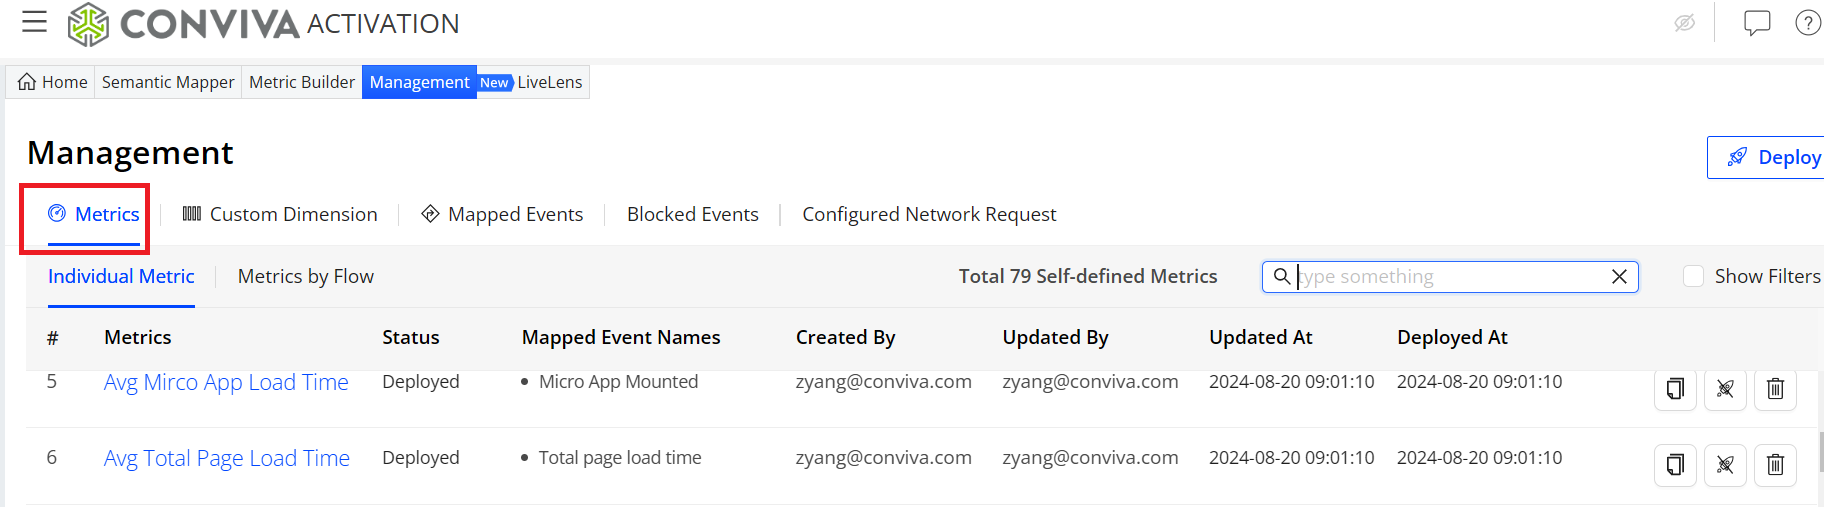
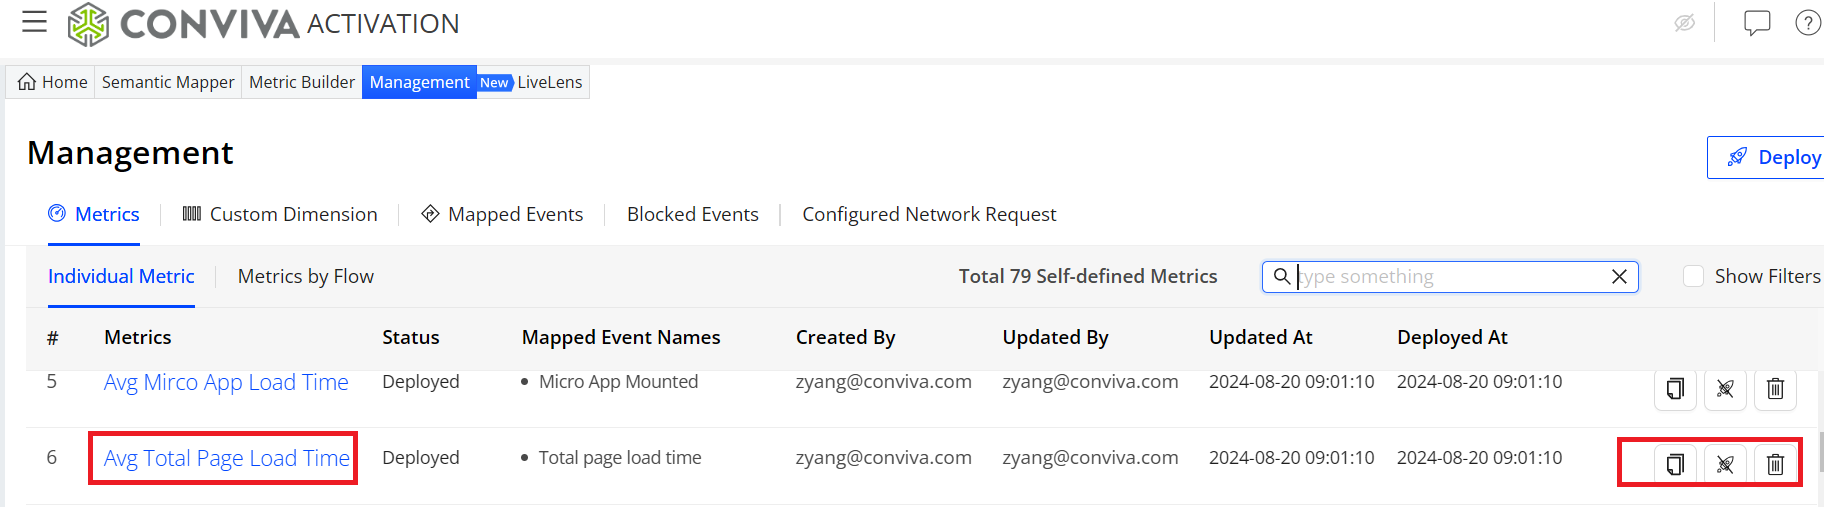
The Management tab allows you to effectively manage data, including tasks such as searching, reviewing, and deploying/undeploying specific mapped events and metrics to support your performance monitoring goals.
| Perform These Tasks: | View Image: |
|---|---|
Learn more: Management |
|
Viewing User Timeline
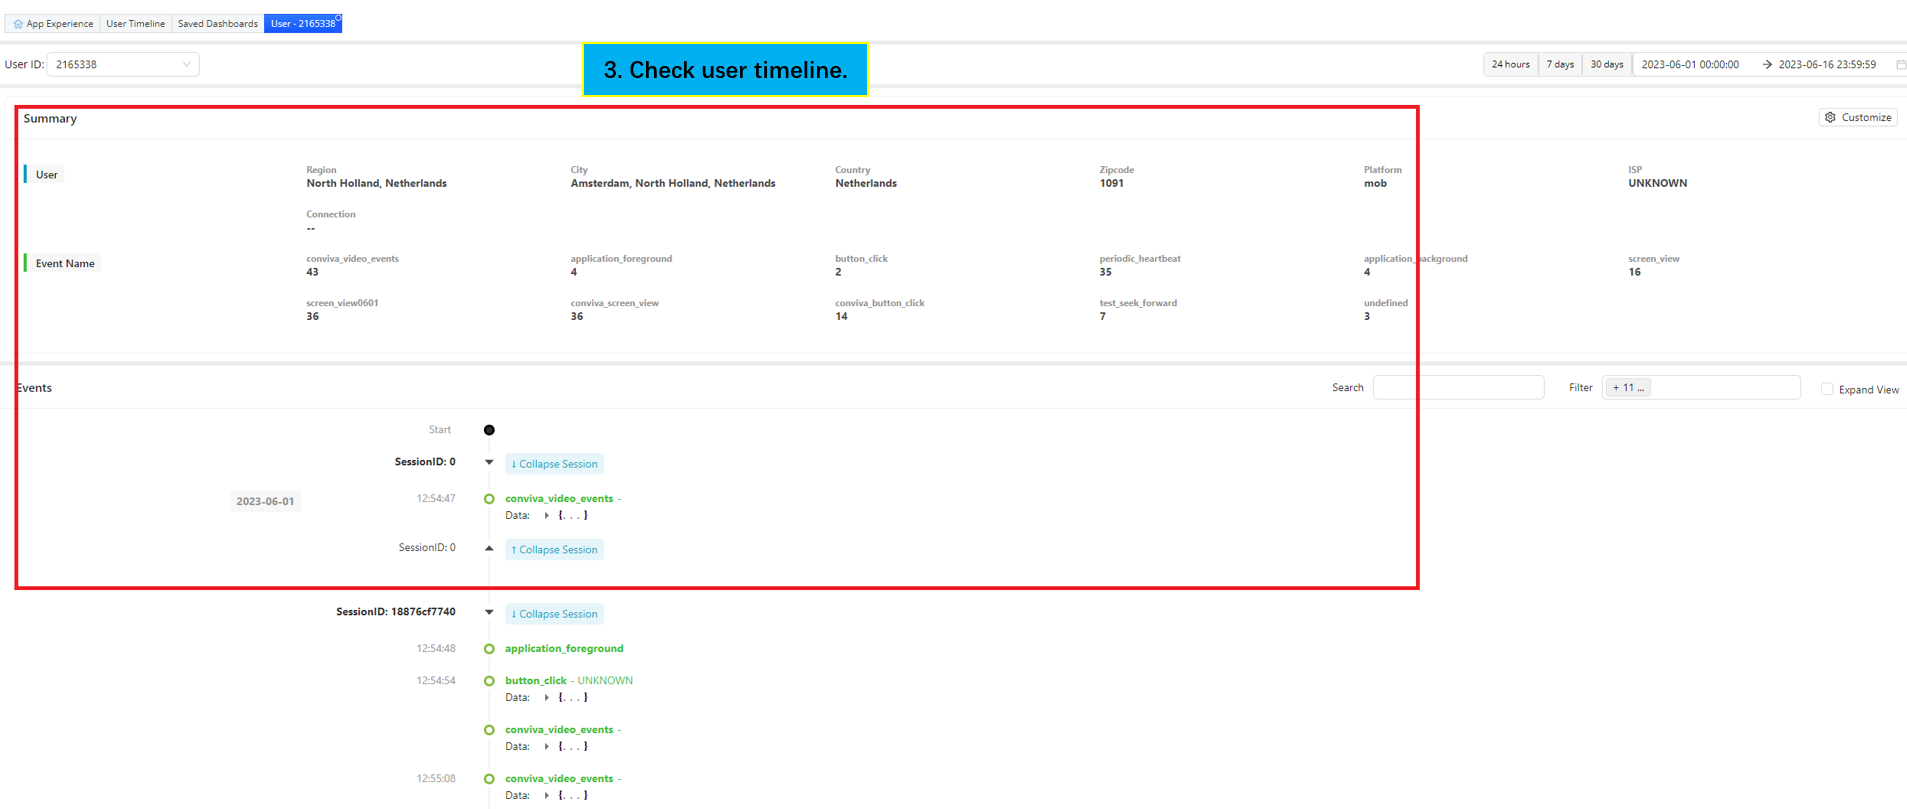
Drill down into session timelines for comprehensive and granular analysis of a session.
User Timeline Feature
| Perform These Tasks: | View Image: |
|---|---|
|
Access the user timeline for impacted viewers or by user id.
Learn more: User Timeline |
AI Alert
AI alerts is an advanced feature that eliminates the need to determine the sensitivity, identify the relevant dimensions that you need to monitor, and set manual alerts to notify related individuals and groups.
App also enables you to integrate manual alerts and AI alerts with PagerDuty, enhancing Conviva's advanced App alerts with PagerDuty escalation management and notifications.
AI Alert
Setting Webhook Notifications
Conviva PagerDuty Integration Guide for App
Using Custom Dashboards
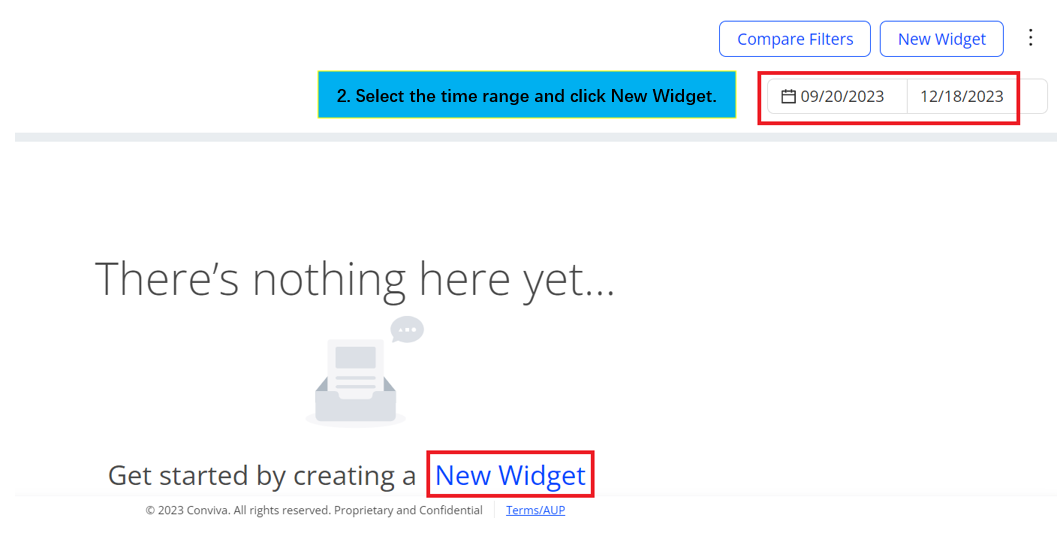
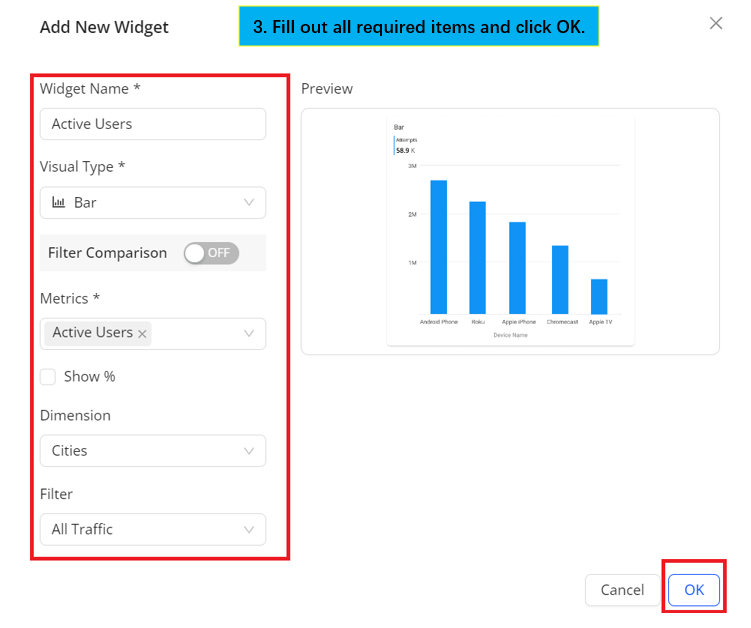
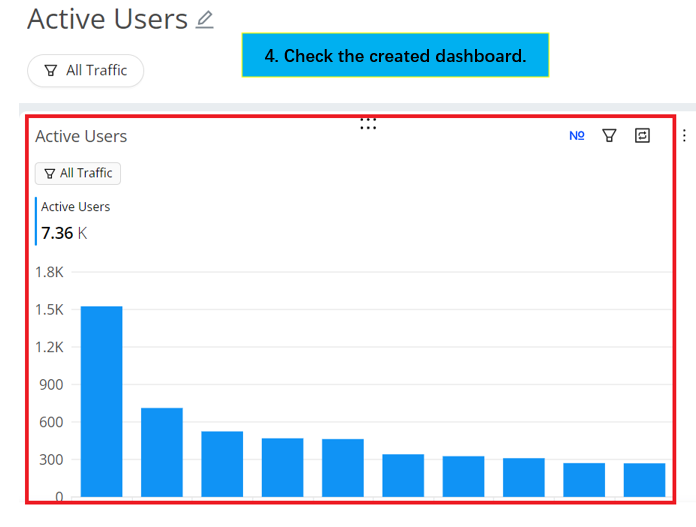
Enable the combination of widgets and display options to highlight the insights that are most meaningful to your users and business.
Custom Dashboards Feature
| Perform These Tasks: | View Image: |
|---|---|
Learn more: Custom Dashboards |
|
Custom Metric Creation Use Cases
These use cases provide a hands-on way for you to quickly implement custom metrics using Metric Builder and other App features. The custom metrics in the use cases are commonly used for analyzing the application performance and user experience.
Use Cases
Full Sign-Up Time
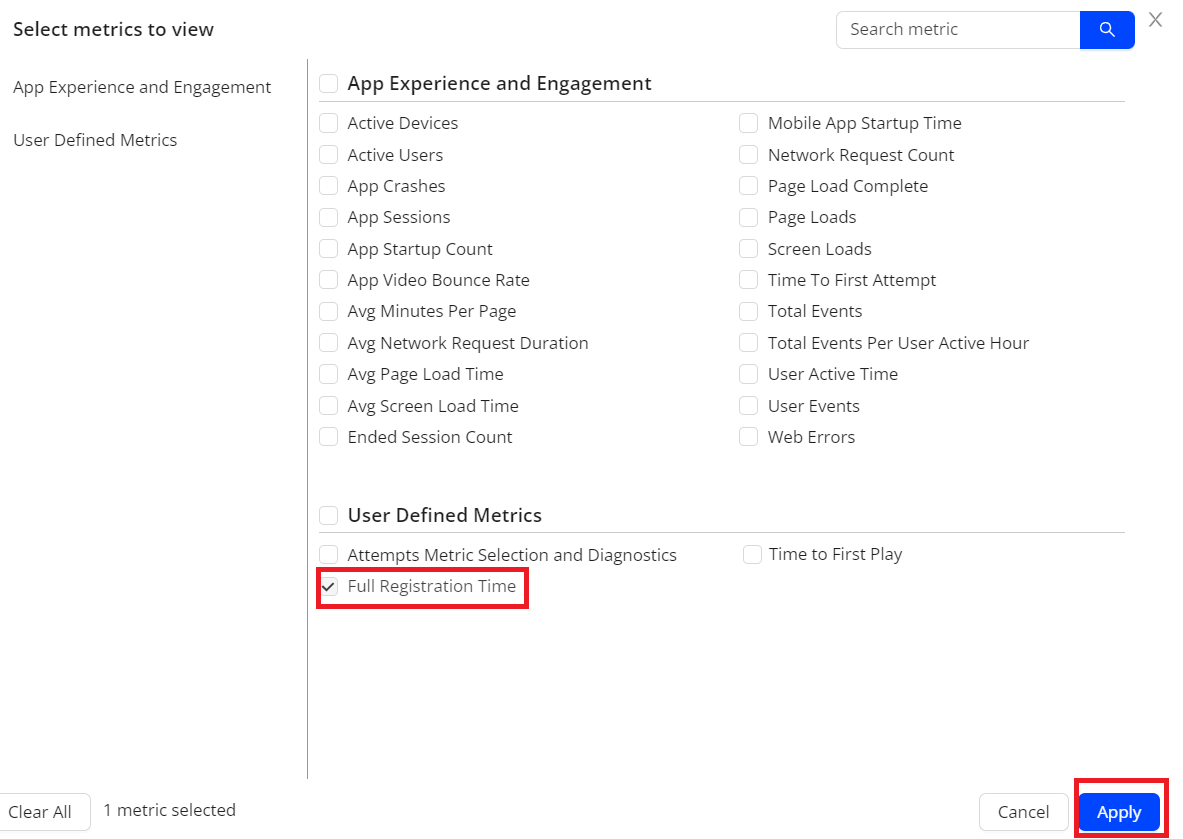
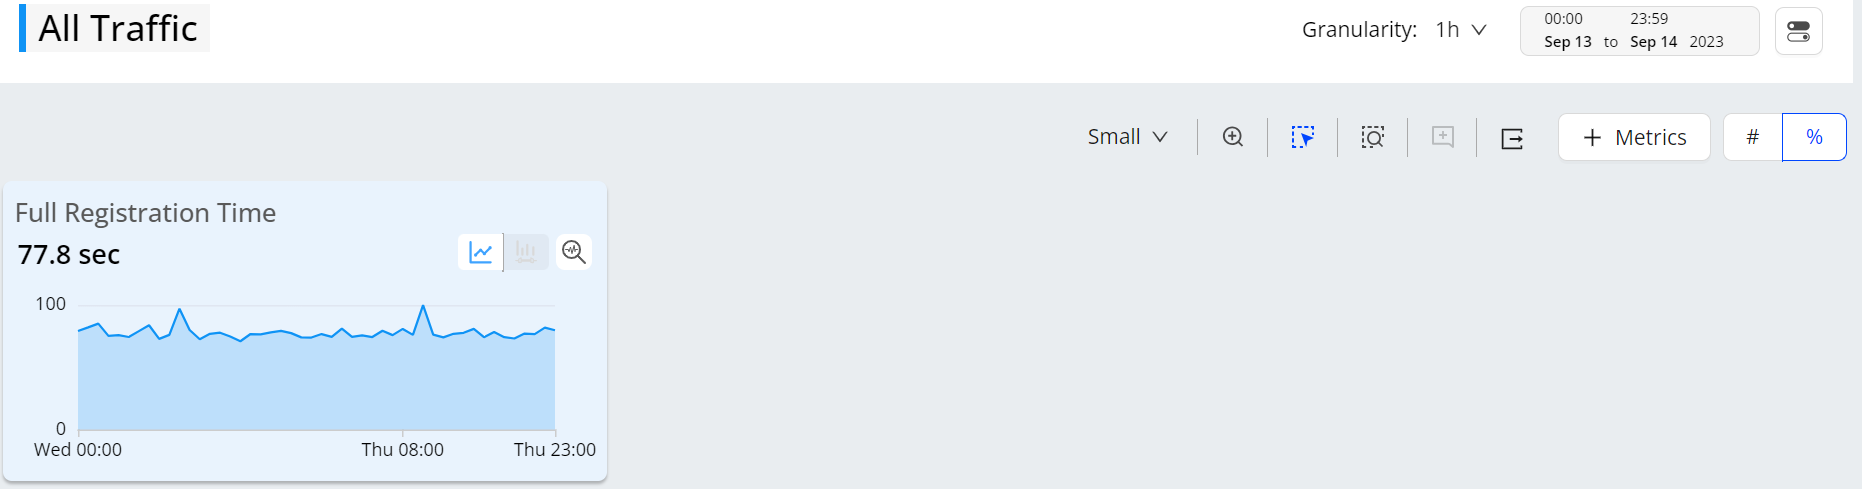
The custom metric Full Registration Time measures the time from starting the registration or sign-up process until the registration is complete. This metric enables you to do analysis of registration process and identify whether the process is cumbersome.
| Perform These Tasks: | View Image: |
|---|---|
|
|
|
|
|
  |
Full Login Time Monitoring
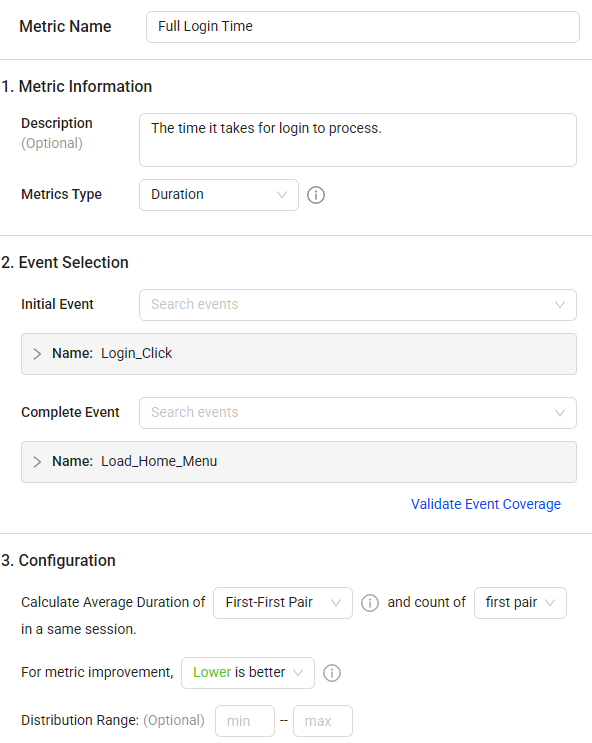
The custom metric Full Login Time measures the time taken for the entire login process, including the loading of the login form/page, user input of their username and password, form submission, and the subsequent loading of the page users are redirected to upon login. This metric is essential for analyzing application performance and identifying the root causes of slow login times.
| Perform These Tasks: | View preview image: |
|---|---|
|
|
|
|
|
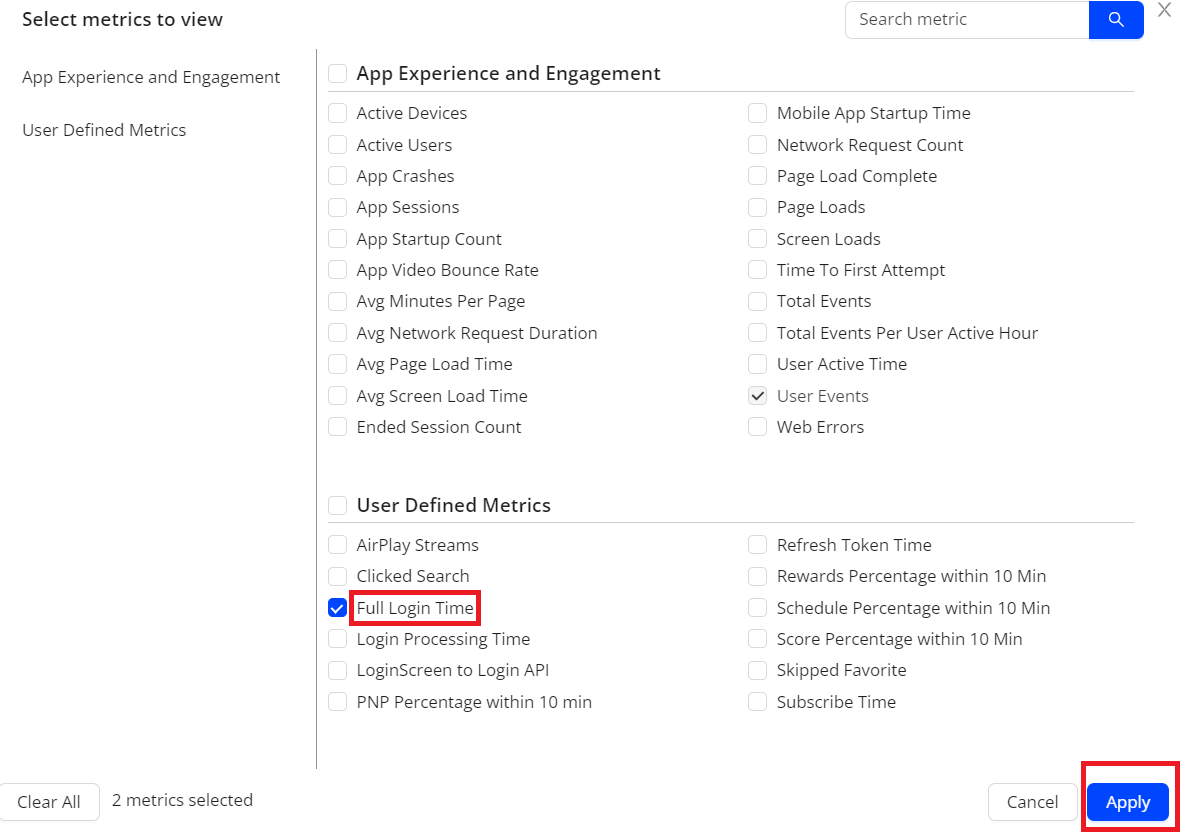 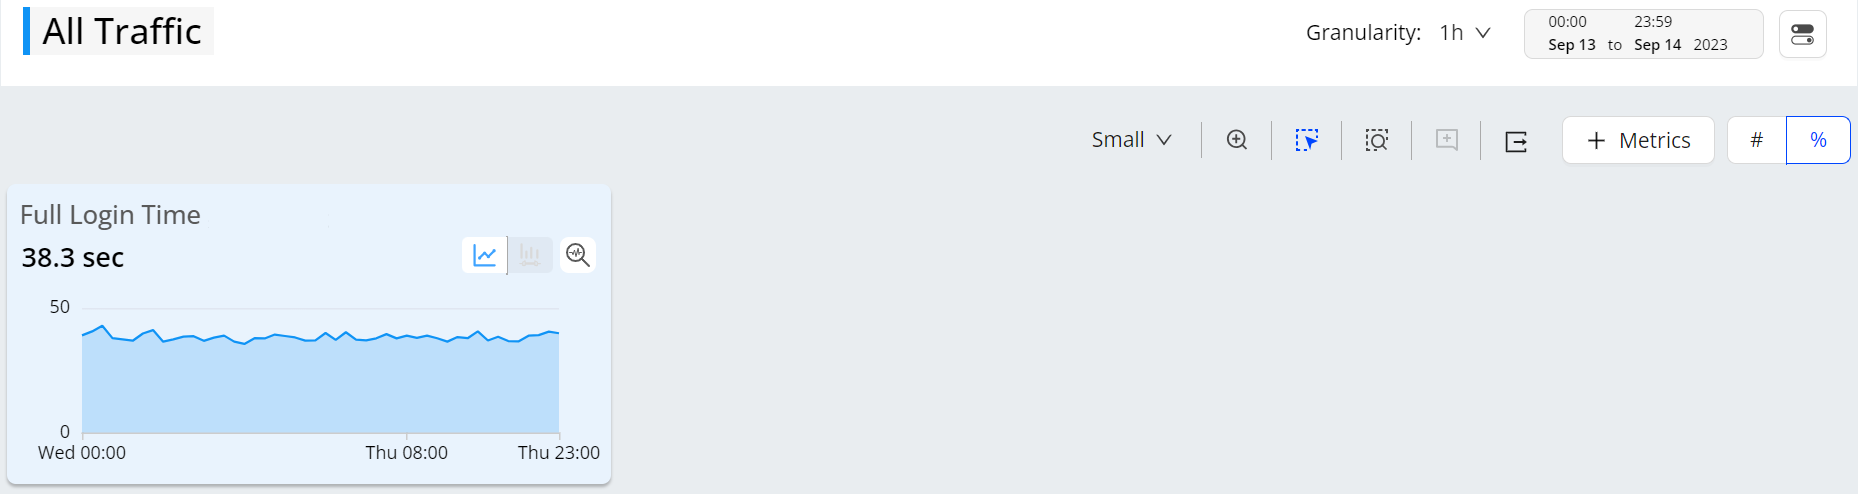 |
Monitor Critical User Journeys
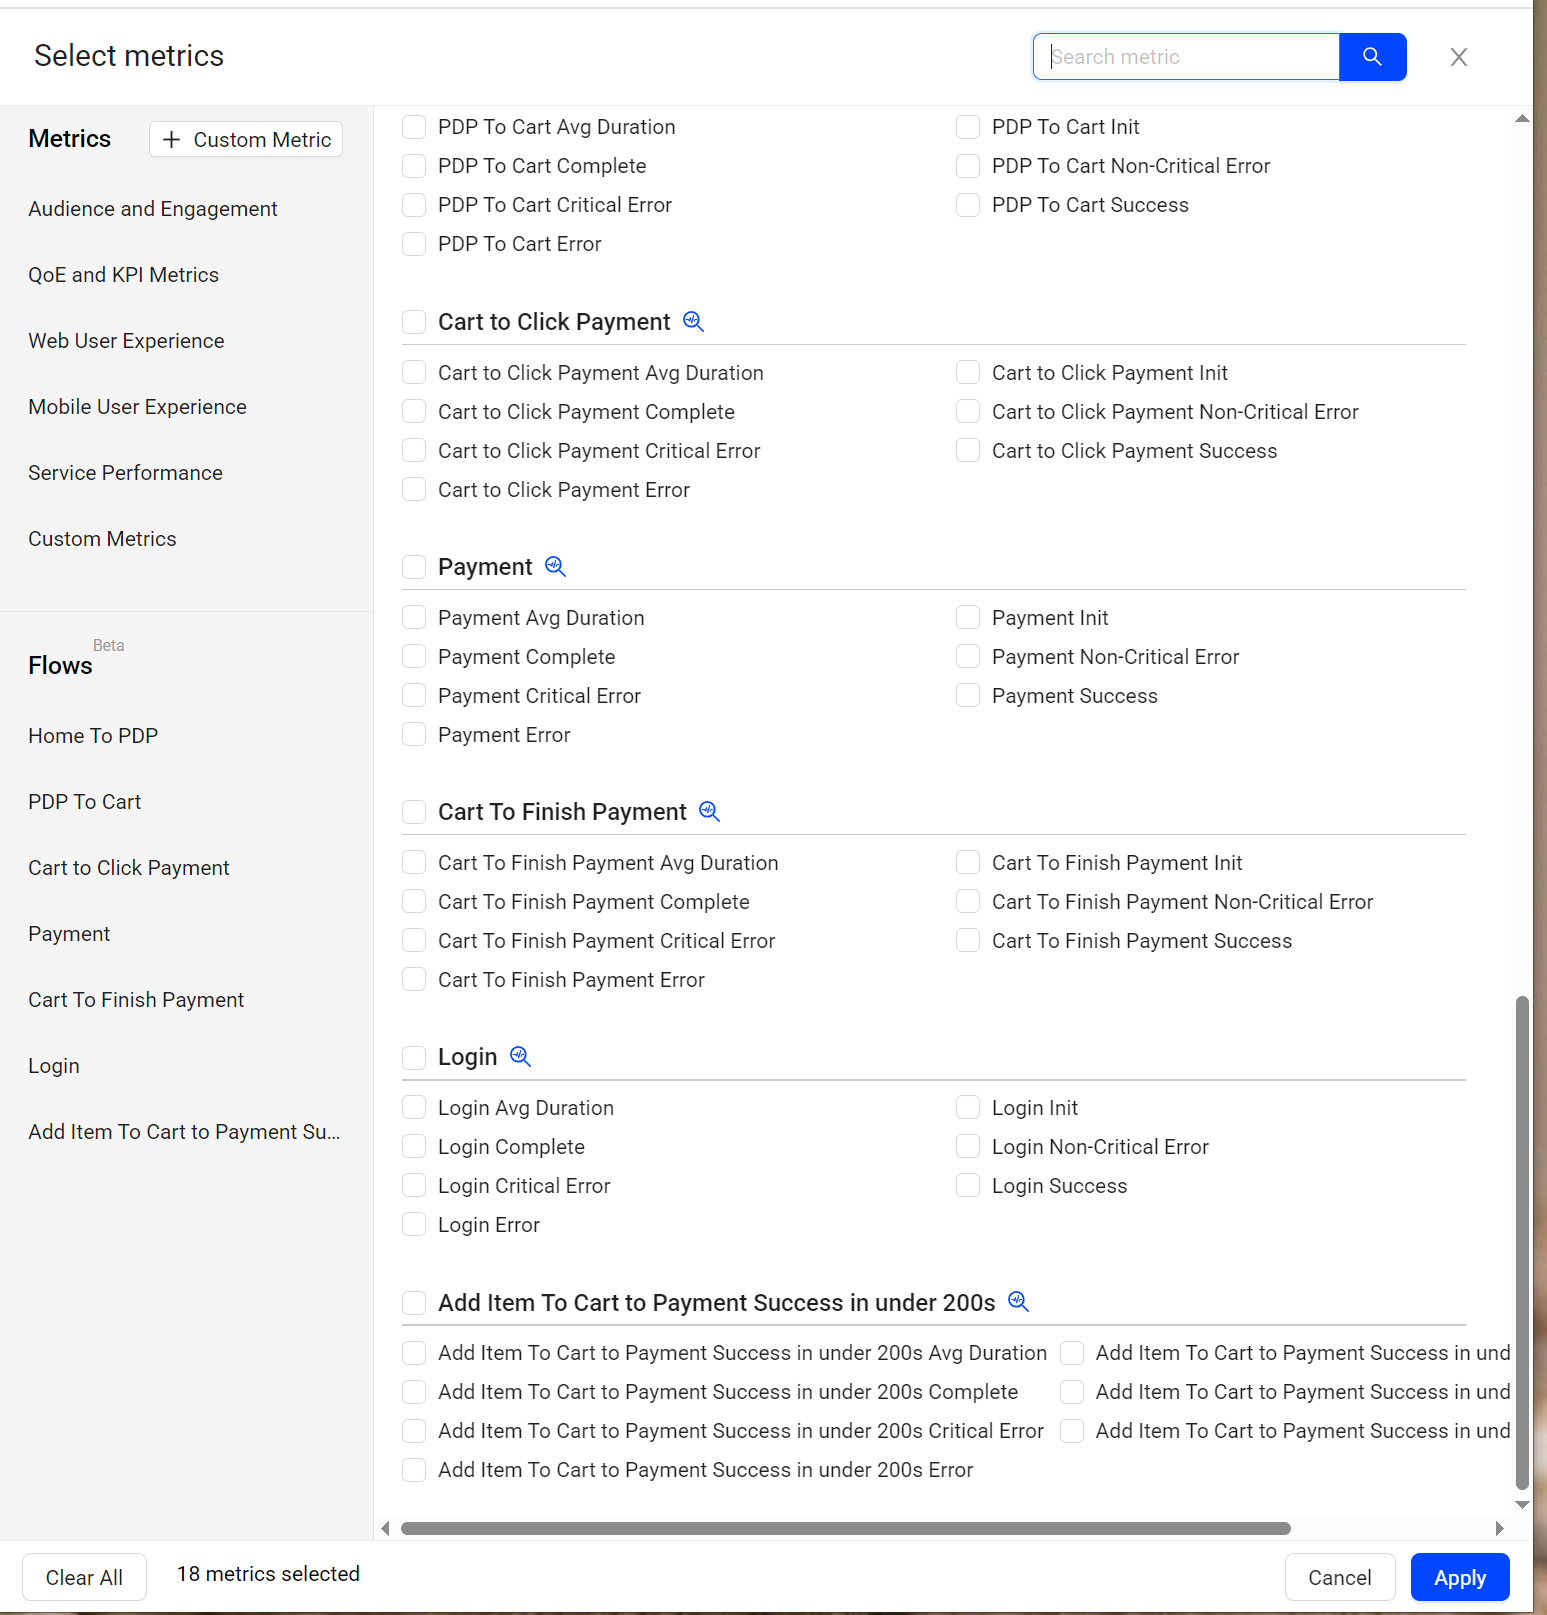
In App, configure flows to monitor user experience progress and success levels during critical app and web user journeys, such as login completion, PDP search to purchase, and checkout processing.
App flows represent critical steps in real-user journeys that enable continuous monitoring and step-wise activity progress in real-time, measuring critical user journey durations, success rates, and completions. For continuous diagnostics within Flow activities, App generates AI-based alerts on progress and completion anomalies to diagnose and optimize user digital experiences.
Use Flow success rates, anomaly detection, error rates, and duration tracking to quickly point toward root cause fixes and digital experience improvements. With OpenTelemetry-compatible tracing, Flows can connect front-end app experiences directly with backend server performance. For more detal, see Flows.
| Perform These Tasks: | View preview image: |
|---|---|
|
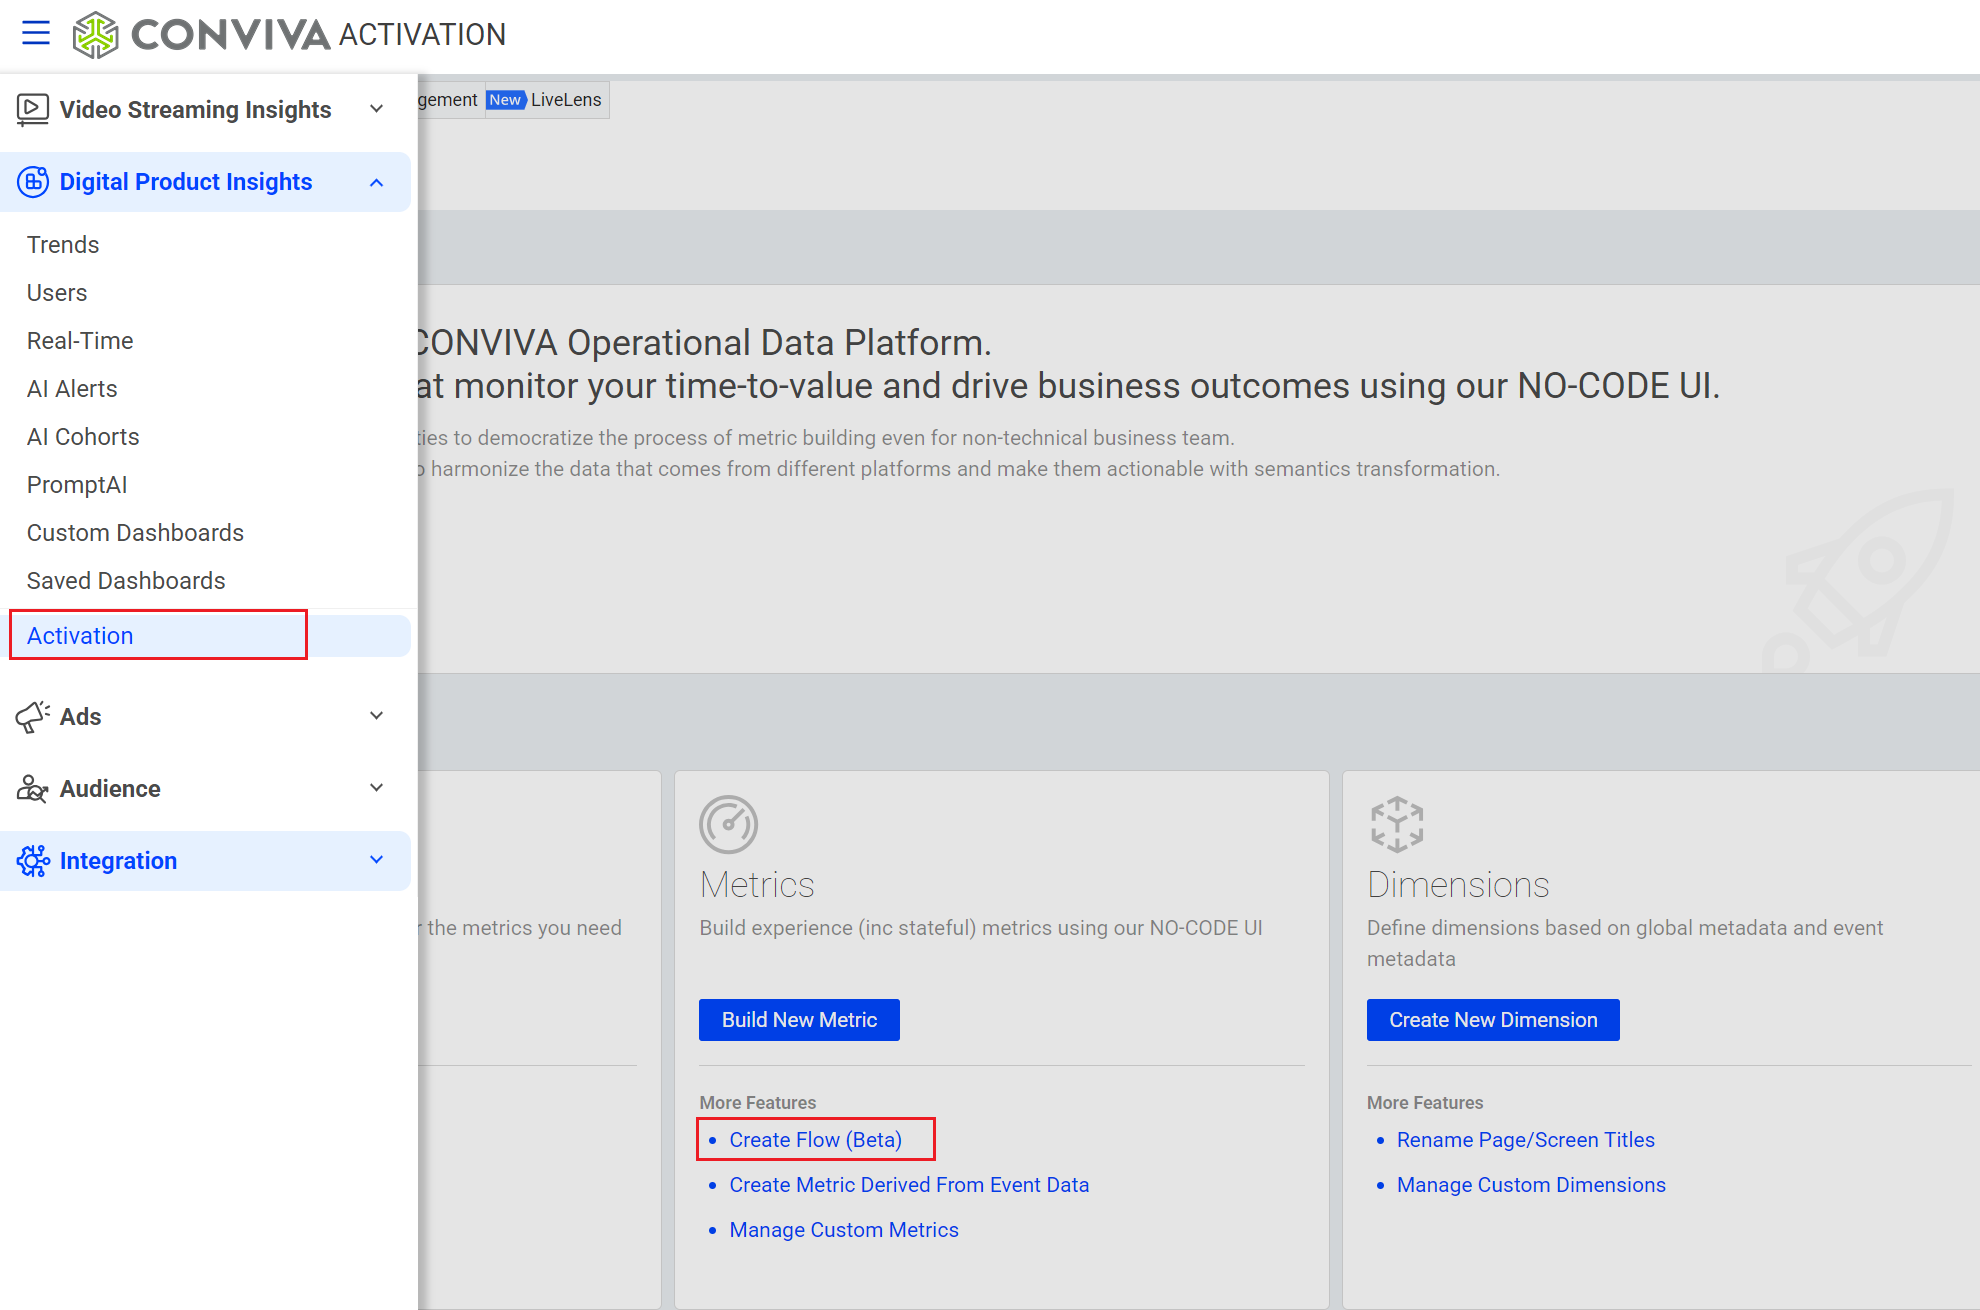
|
Also, set the range of data buckets in the distrbution. |
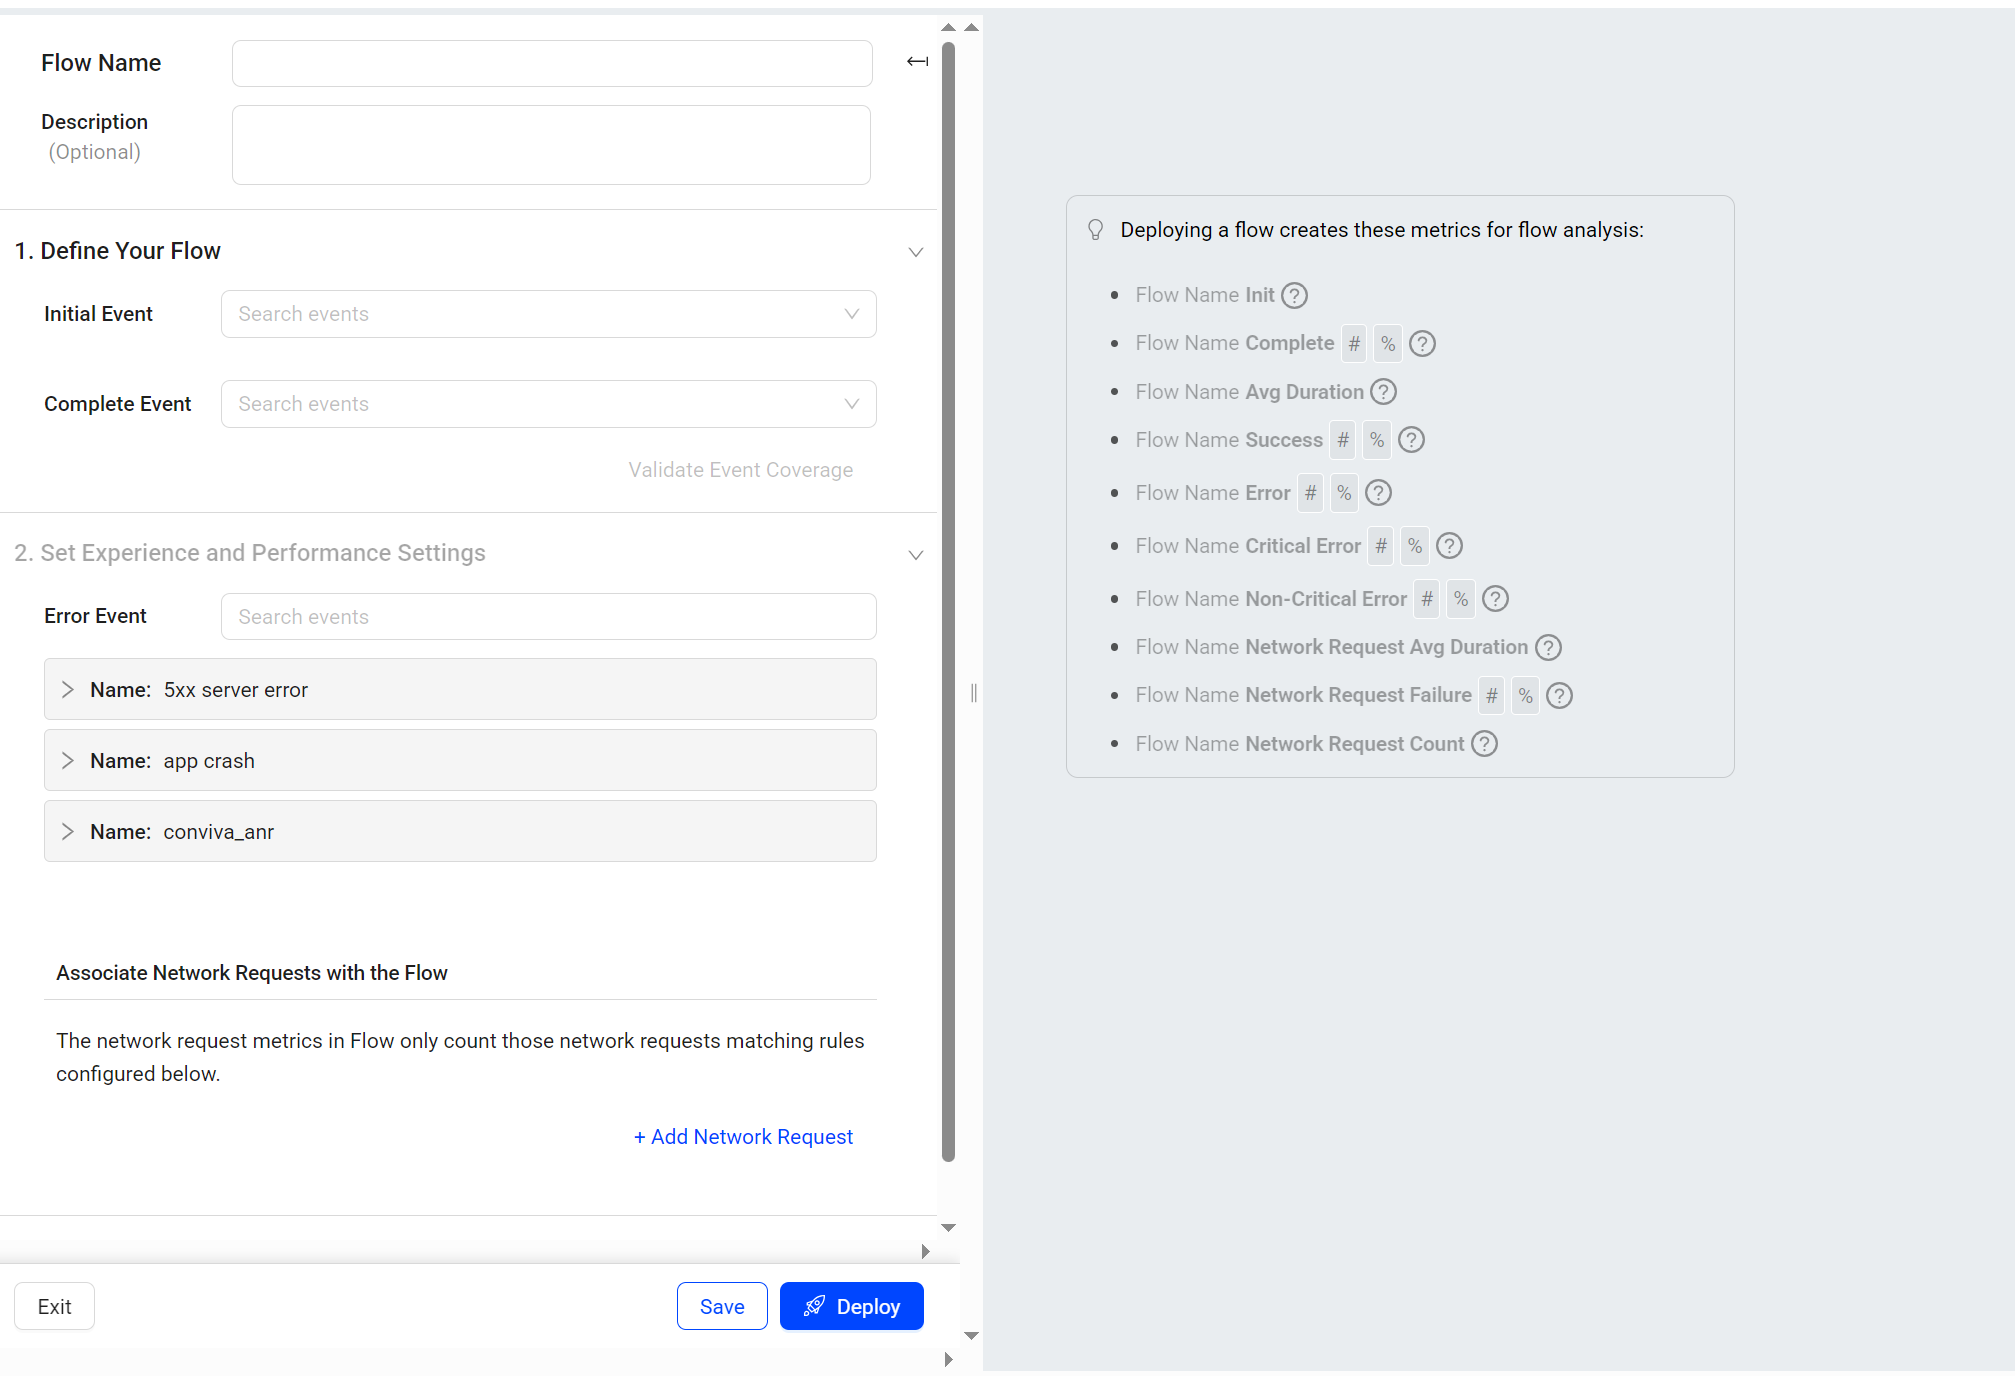
|
Examples of Flows:
|
Diagnose Performance Issues Impacting User Experiences
App provides features for deep drill-down cross-dimensional analysis for easy analysis across dimensions, such as device model, application version, and error messages, for real-time and historical data, isolating service performance and real-user experience for deep insights into impacted user experiences.
Dimensional Data Drill-Downs
Select up to eight dimensions enabling advanced analysis across dimension tables for deep data drill-downs. Clicking dimension values in dimension tables provides advanced analysis across dimensional value combinations, such as Apple TV 4k, app version 5.6.2 and user ID 2163548, for flexible impact and combined data analysis. For more details on App app performance monitoring and connecting performance data with real-time user experiences, see Trends.
Event Sequences in User Experience
Use the Paths dashboard to create a Paths chart that visualizes the sequential pattern of user events based on a starting event and subsequent filtered events, highlighting the sequence of events and the composition of events for metric creation and potential issue identification.
| Perform These Tasks: | View preview image: |
|---|---|
|
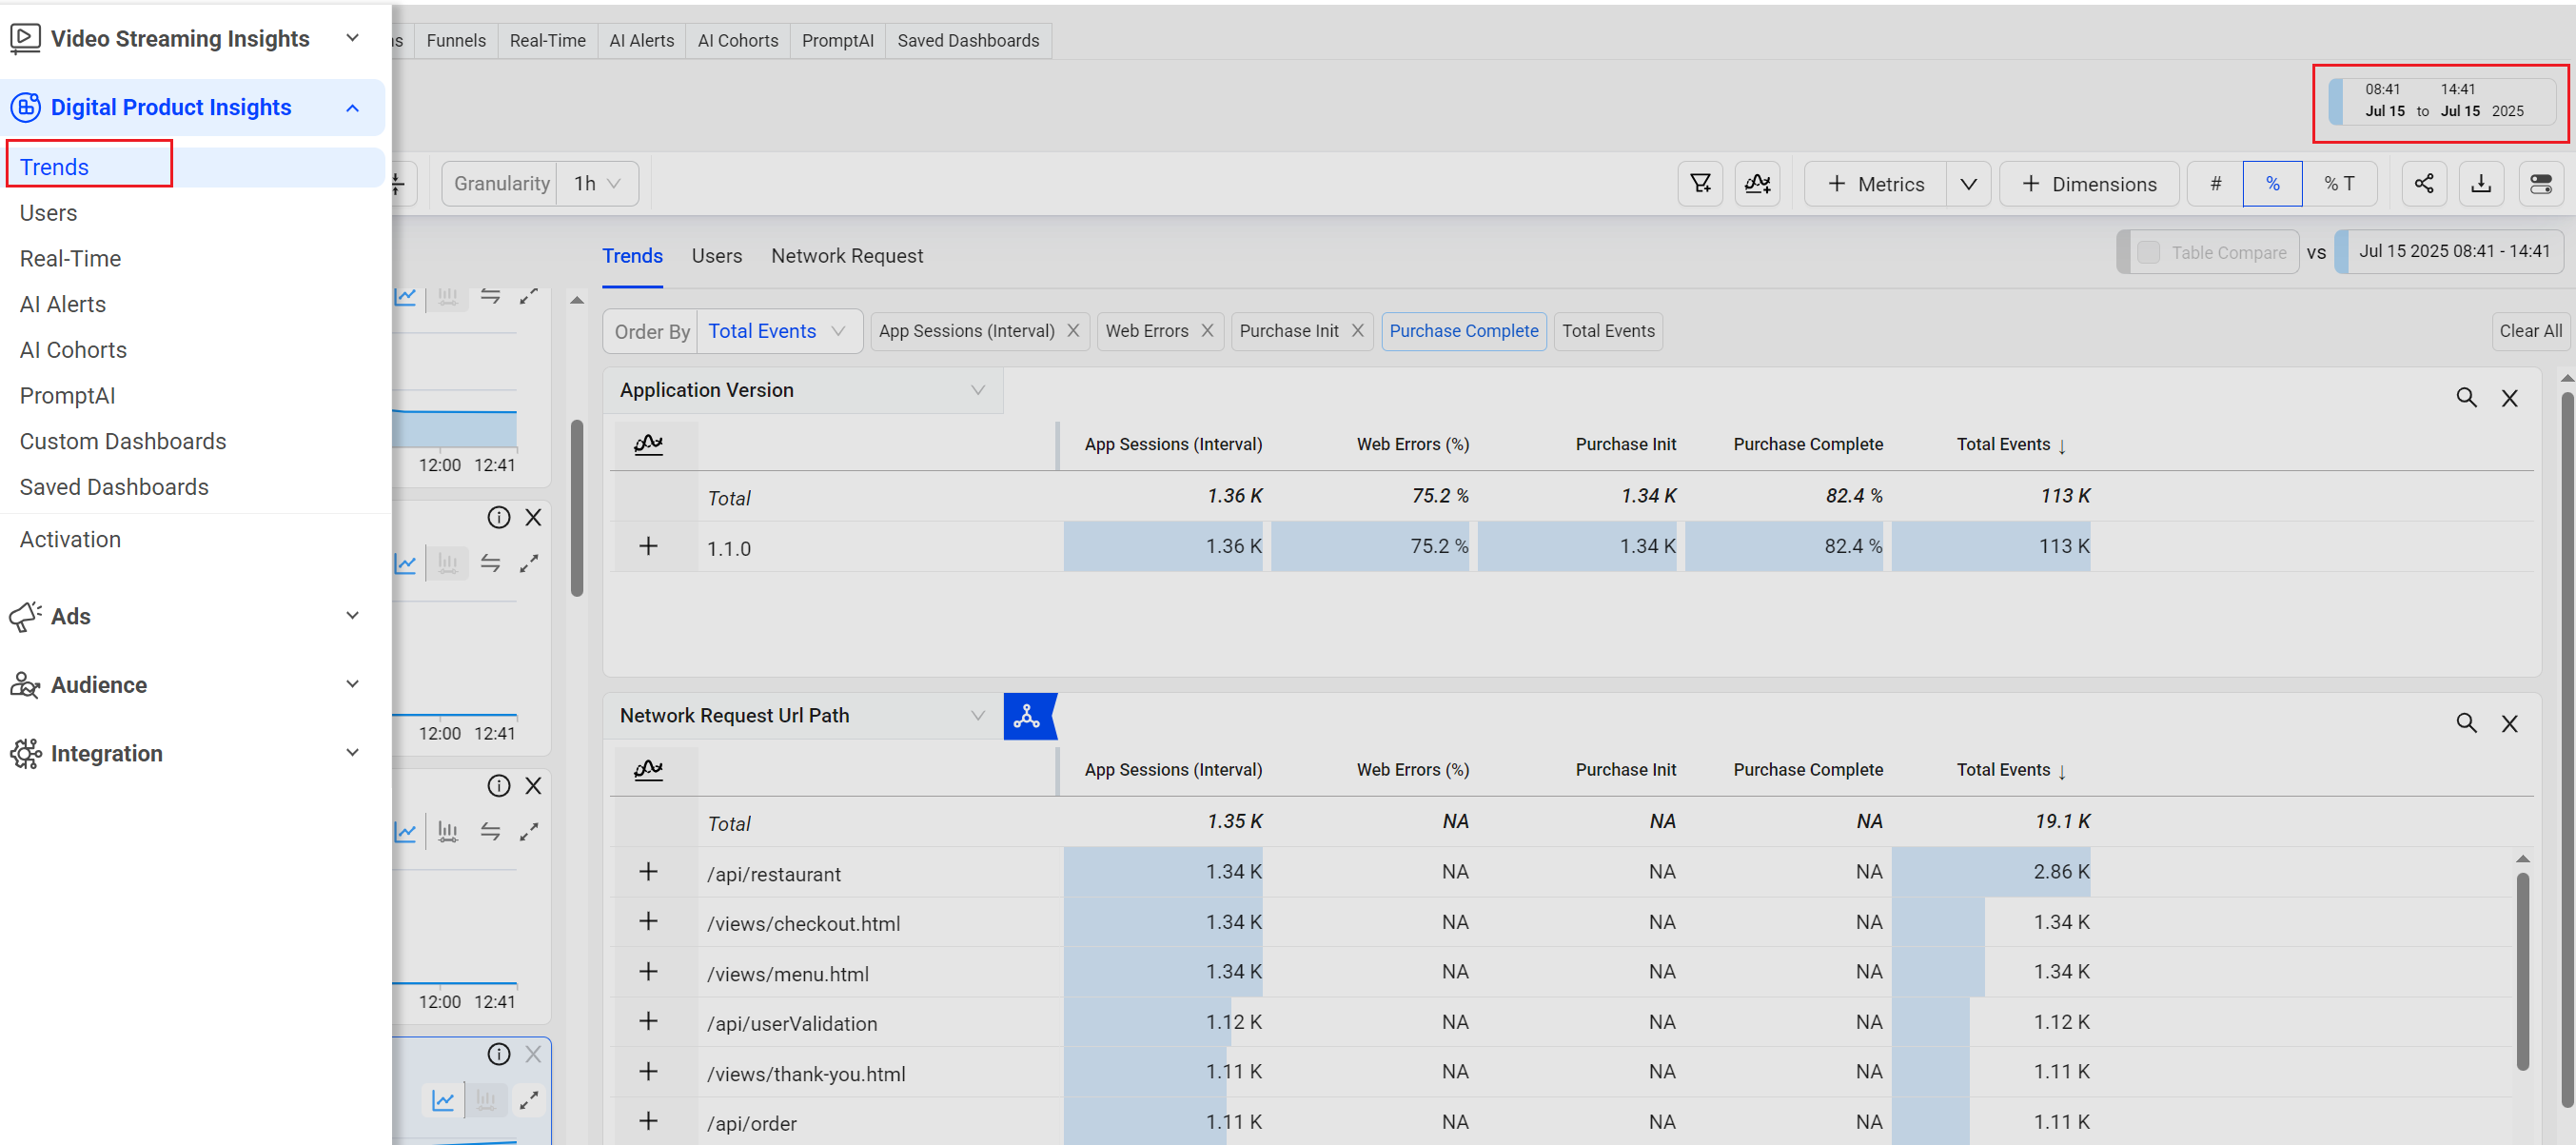
|
|
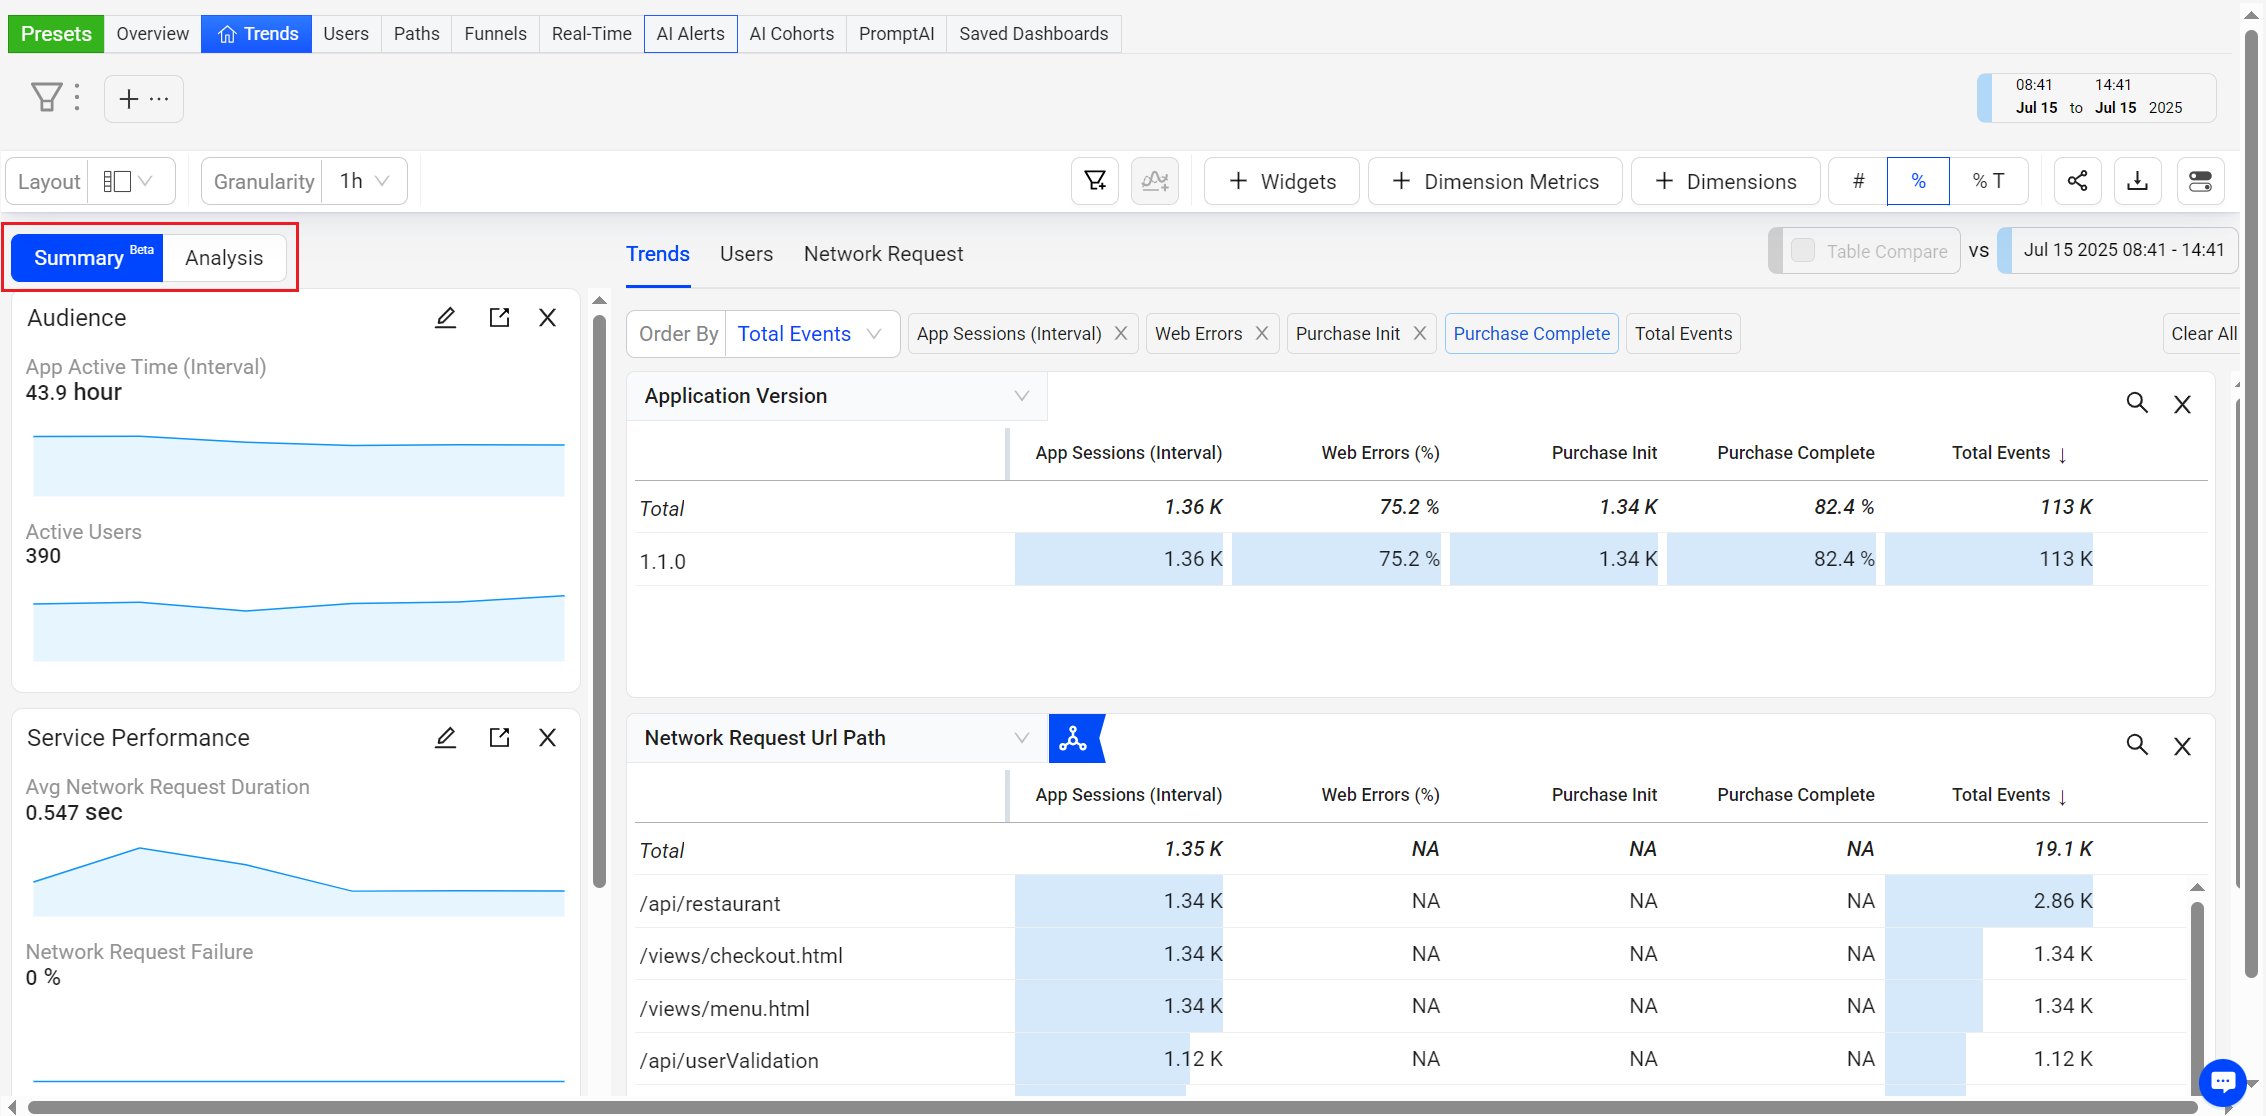
|
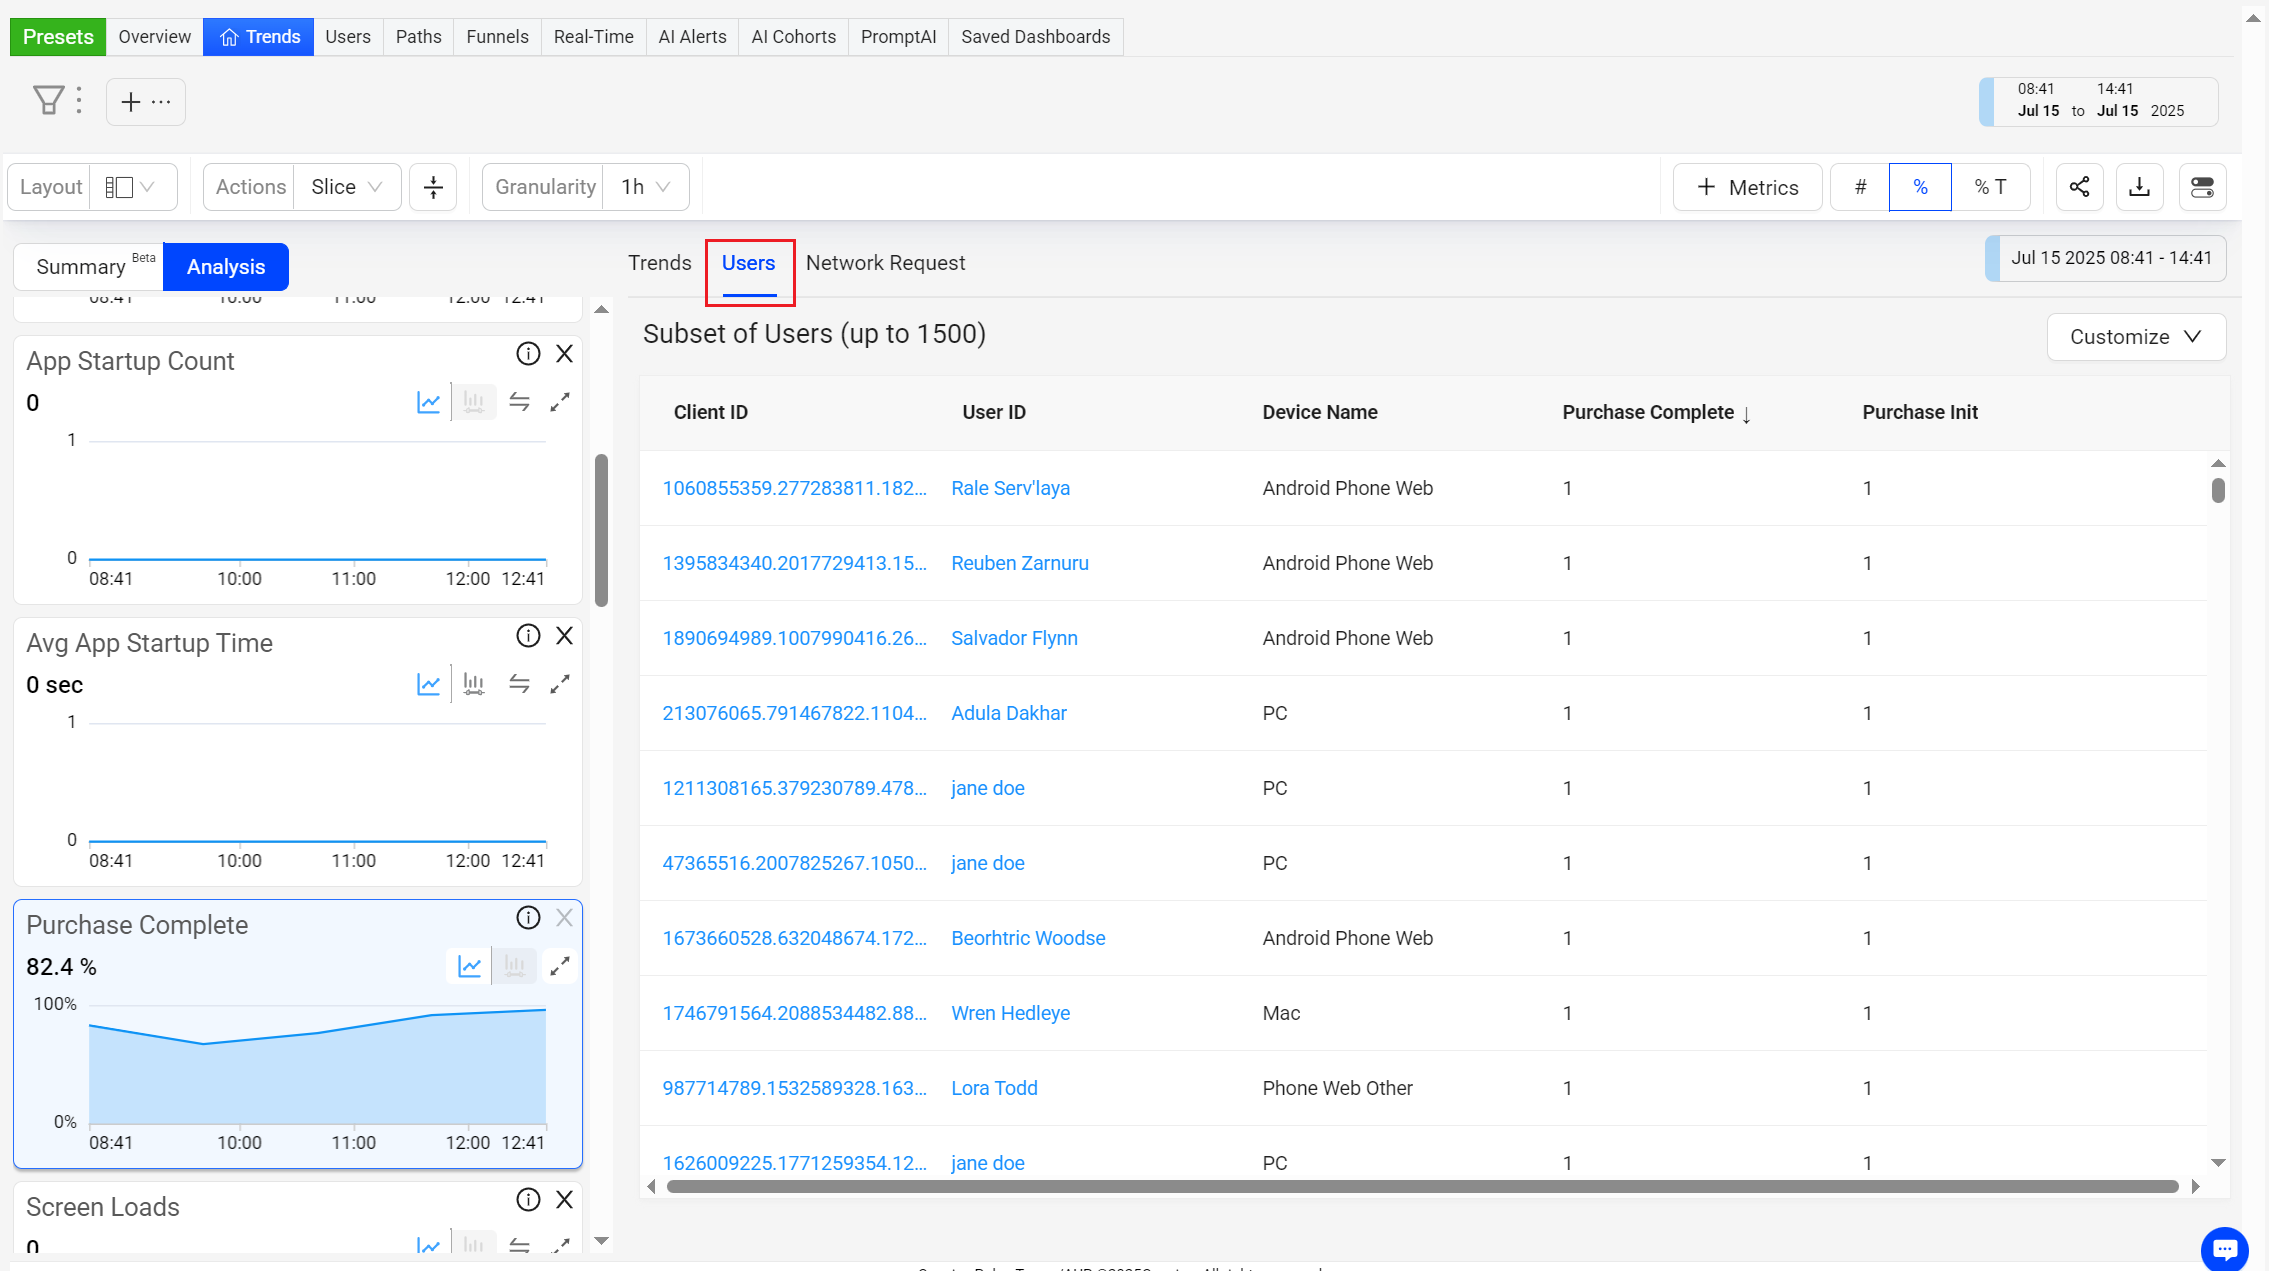
User timelines provide a detailed list of user events and event data, such as network request paths and response codes, page titles, and payment type. |
|
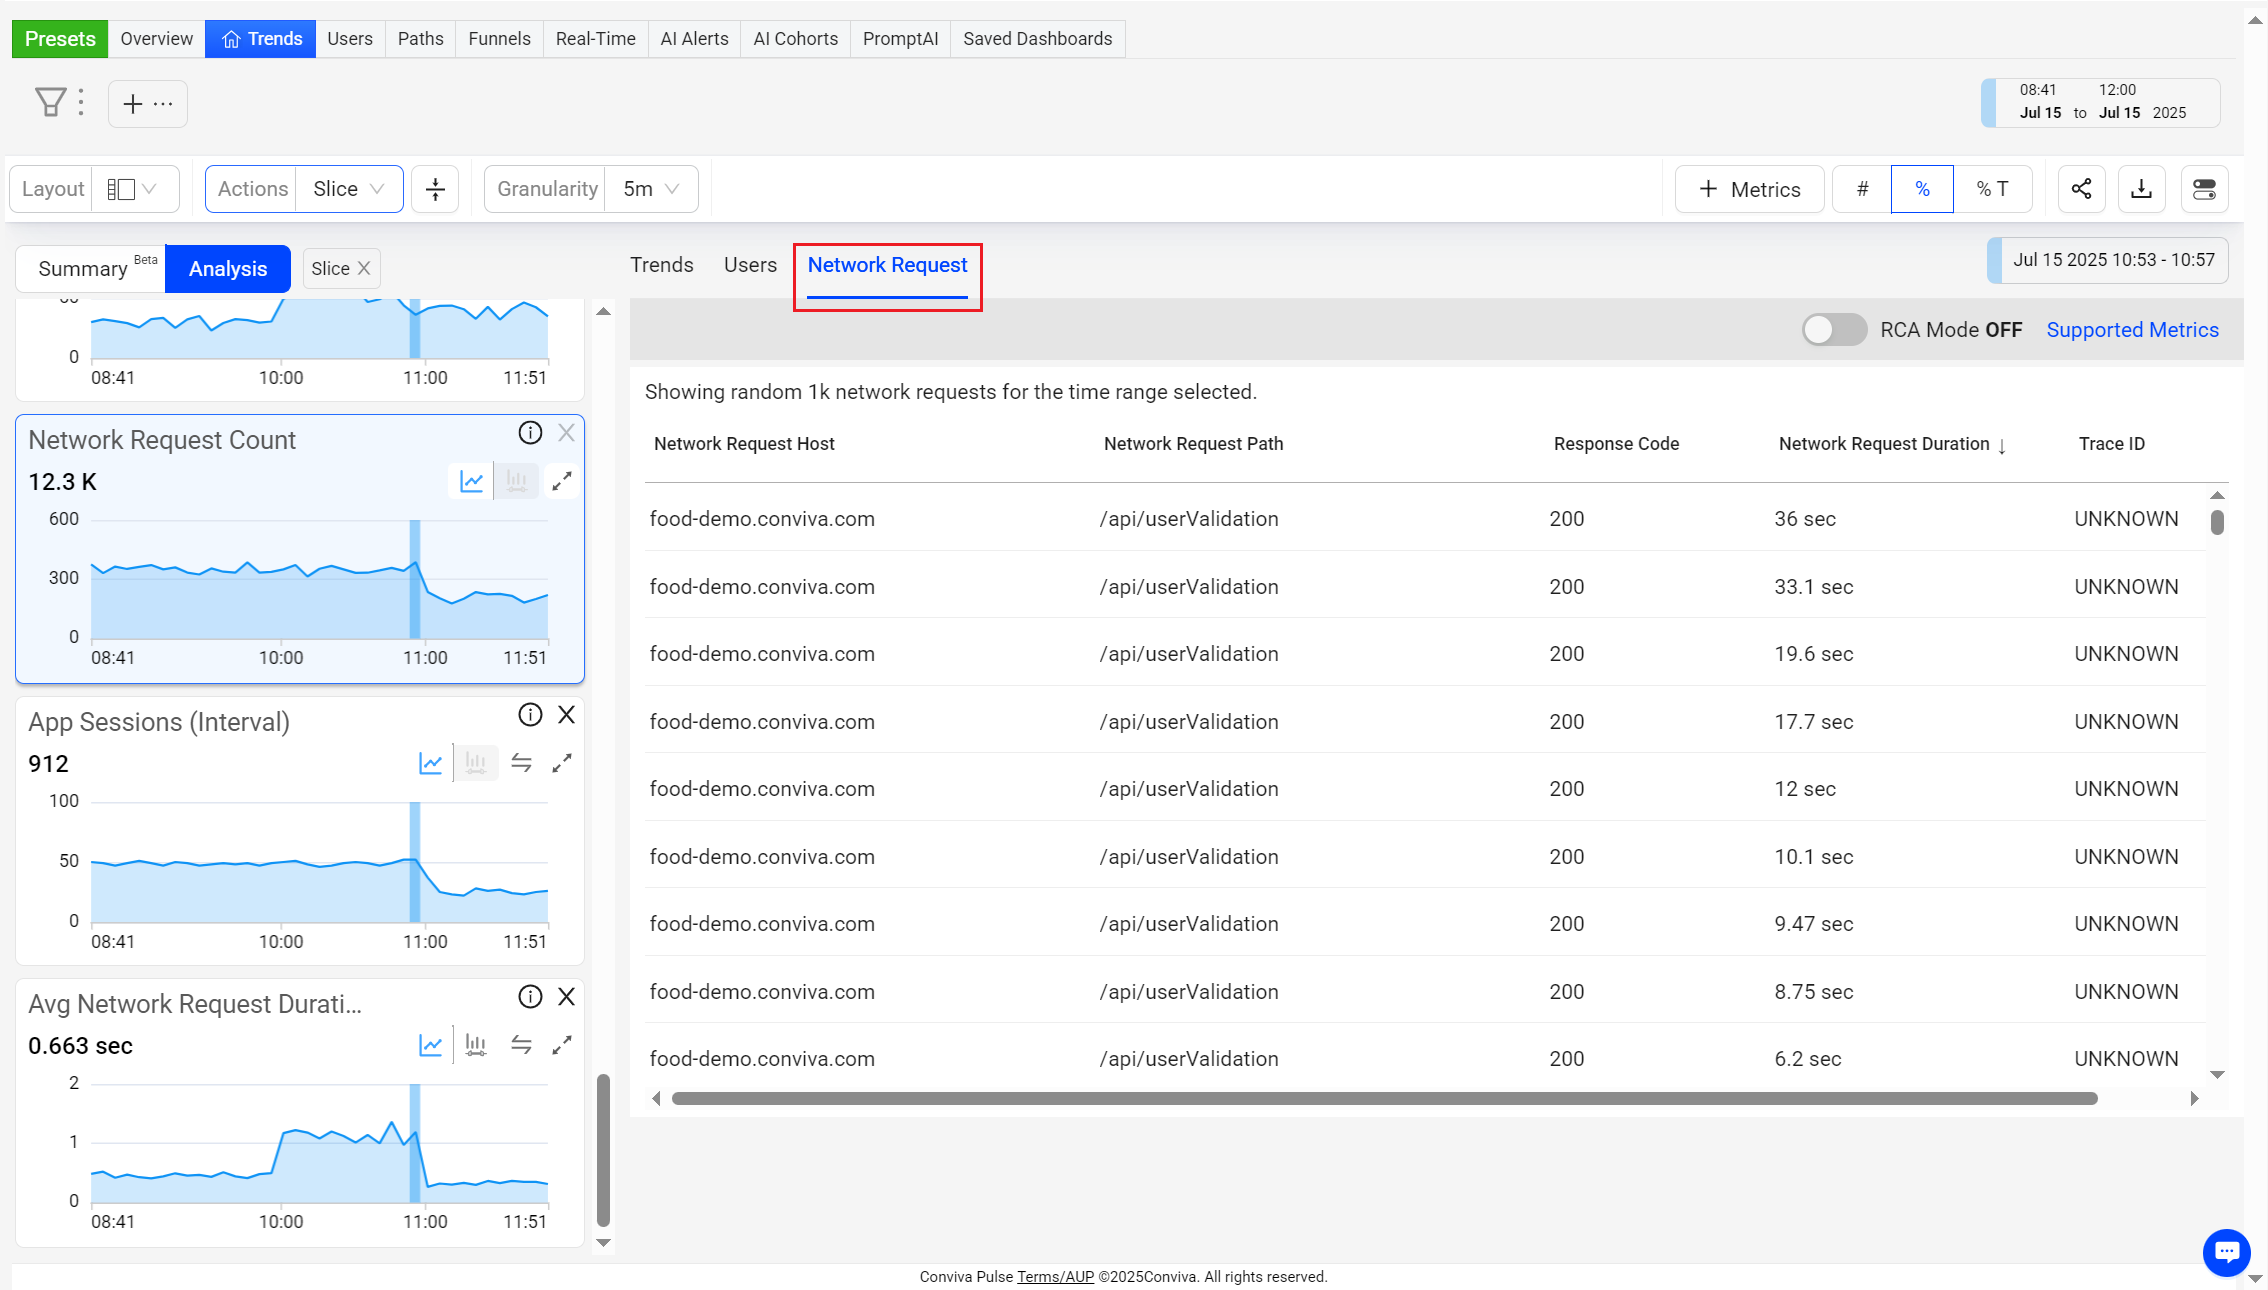
In a metric widget distribution, for example Network Request Average Duration, select the impact range and turn on RCA Mode to view the auto-generated root cause hypothesis with related network API call data. |
|
|
Monitor User Experience Metrics During Software Releases to Confirm Release Quality
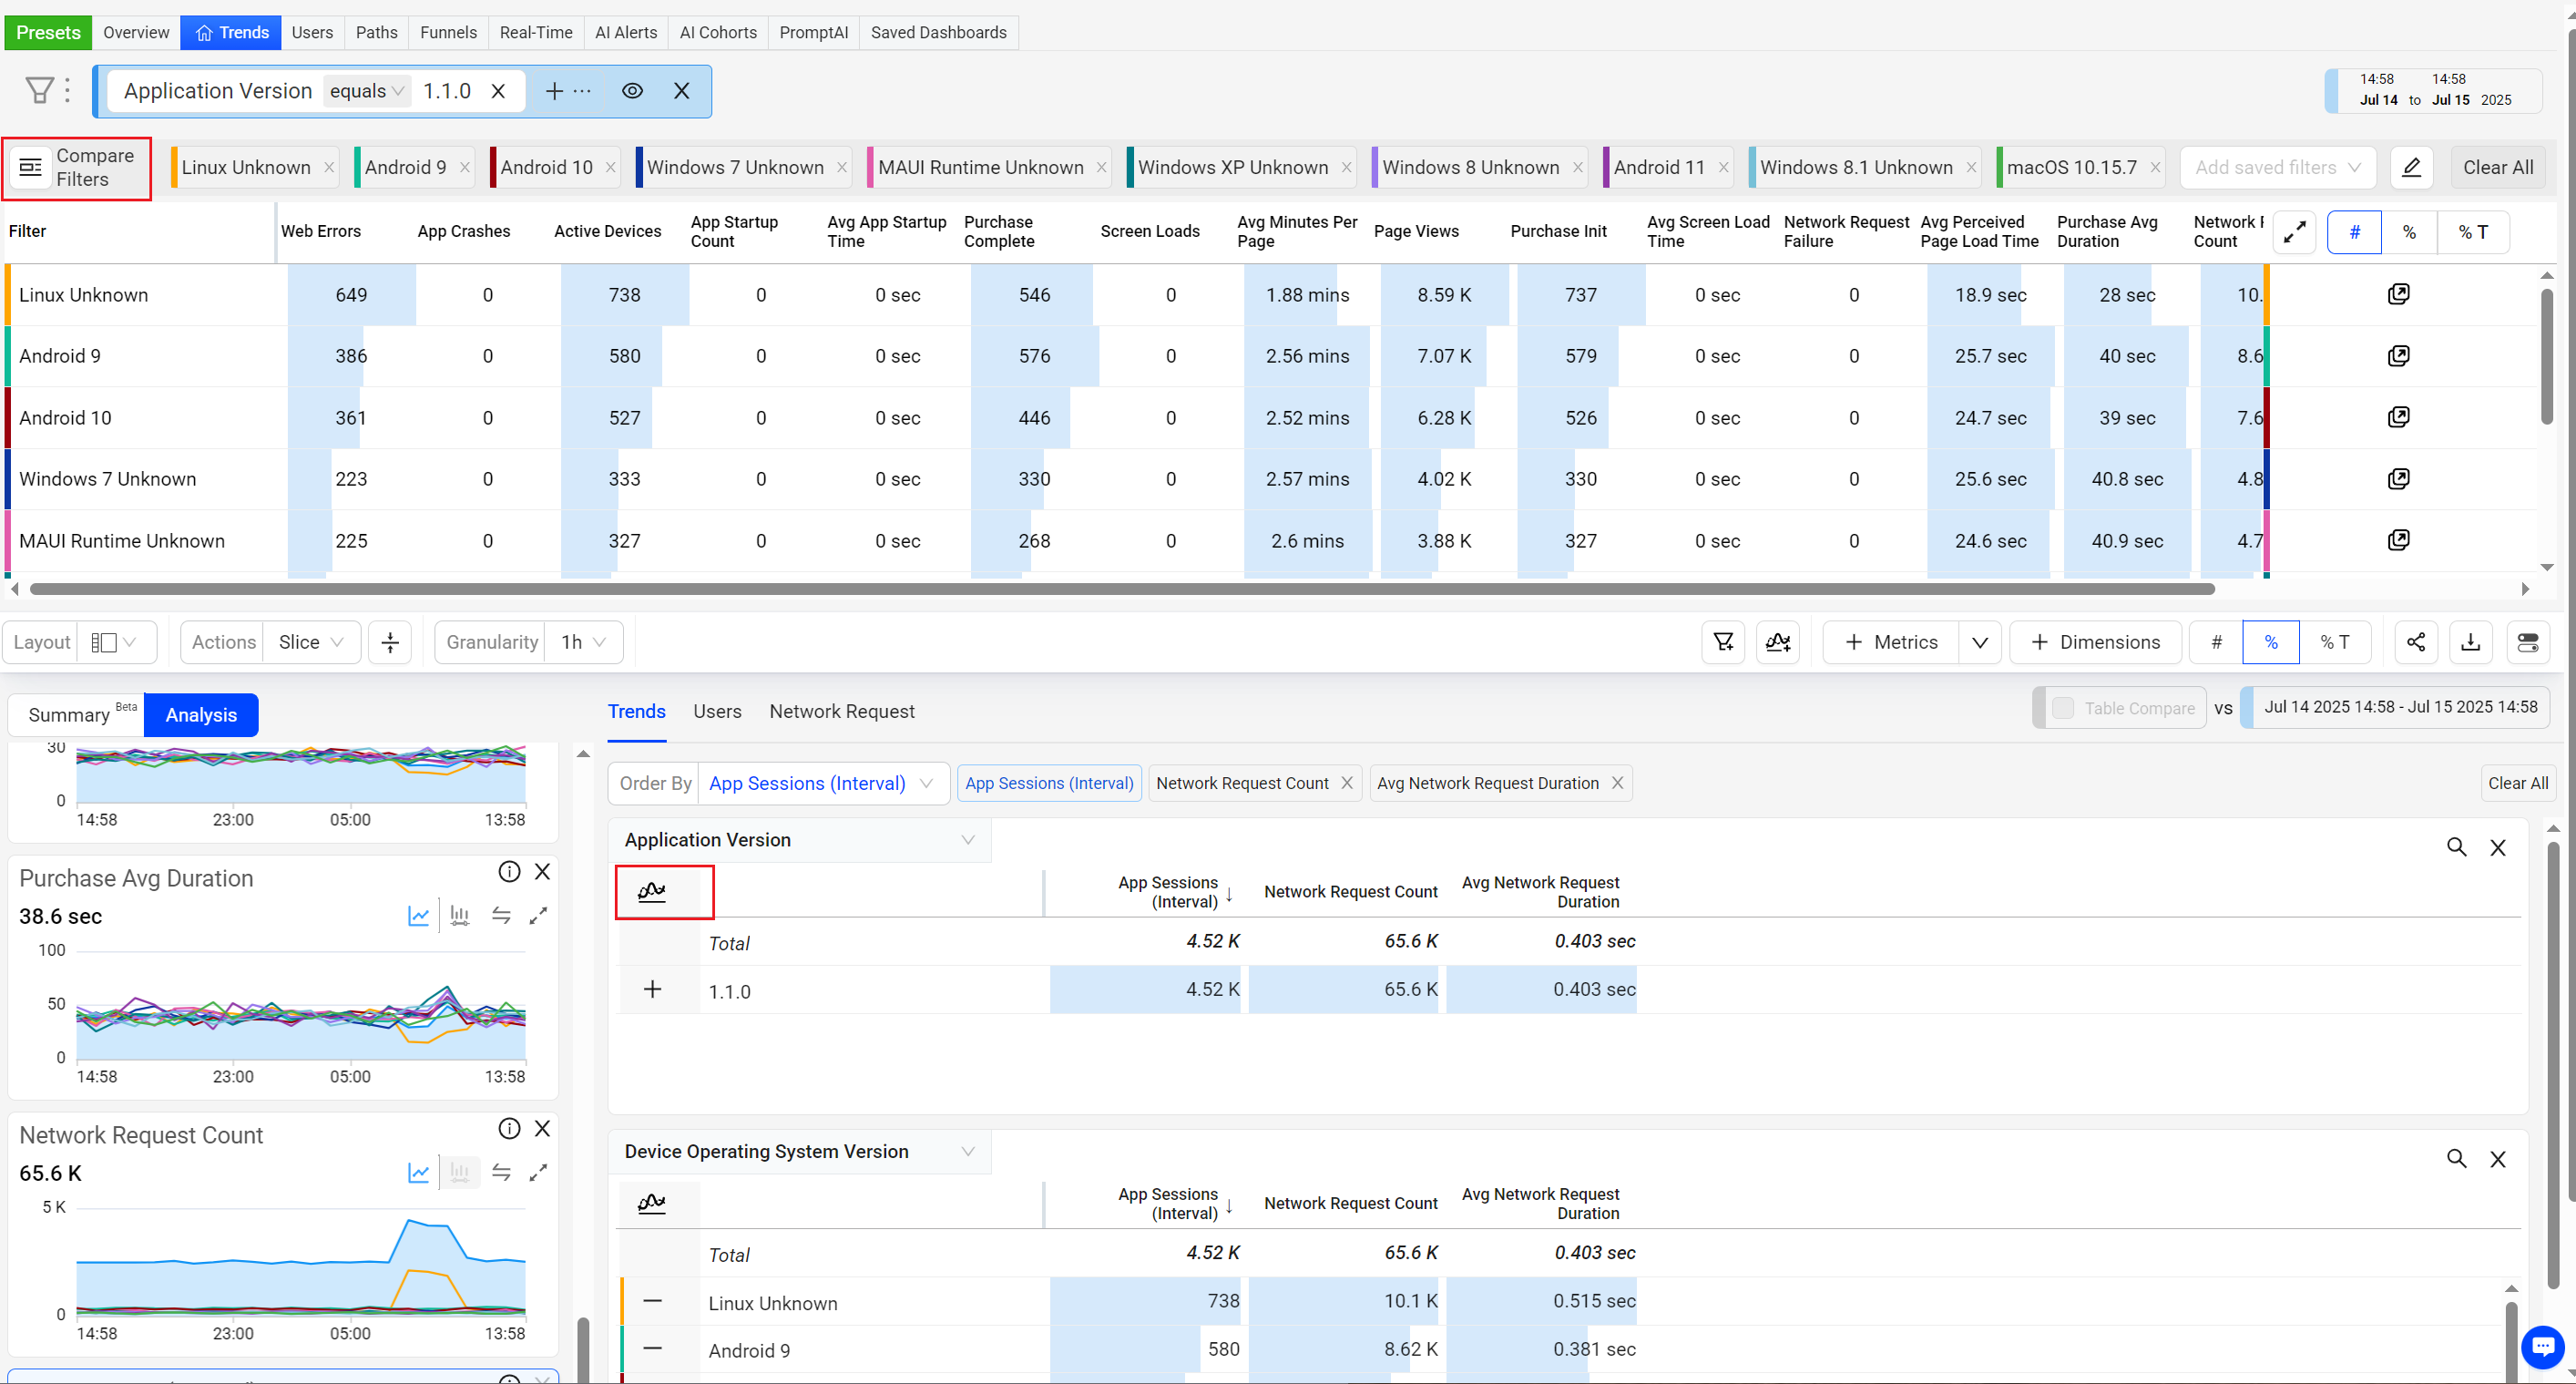
With App, easily monitor software releases and compare version performance to bench release adoption and mitigate new release issues. With the Application Version dimension displayed in the dimension tables, click the quick compare icon to display a comparison view of the top 10 releases.
| Perform These Tasks: | View preview image: |
|---|---|
|
|
Also, filter on a version to view the metrics across dimensions, such as browser versions. |
|
Monitor and Alert on API Performance
| Perform These Tasks: | View preview image: |
|---|---|
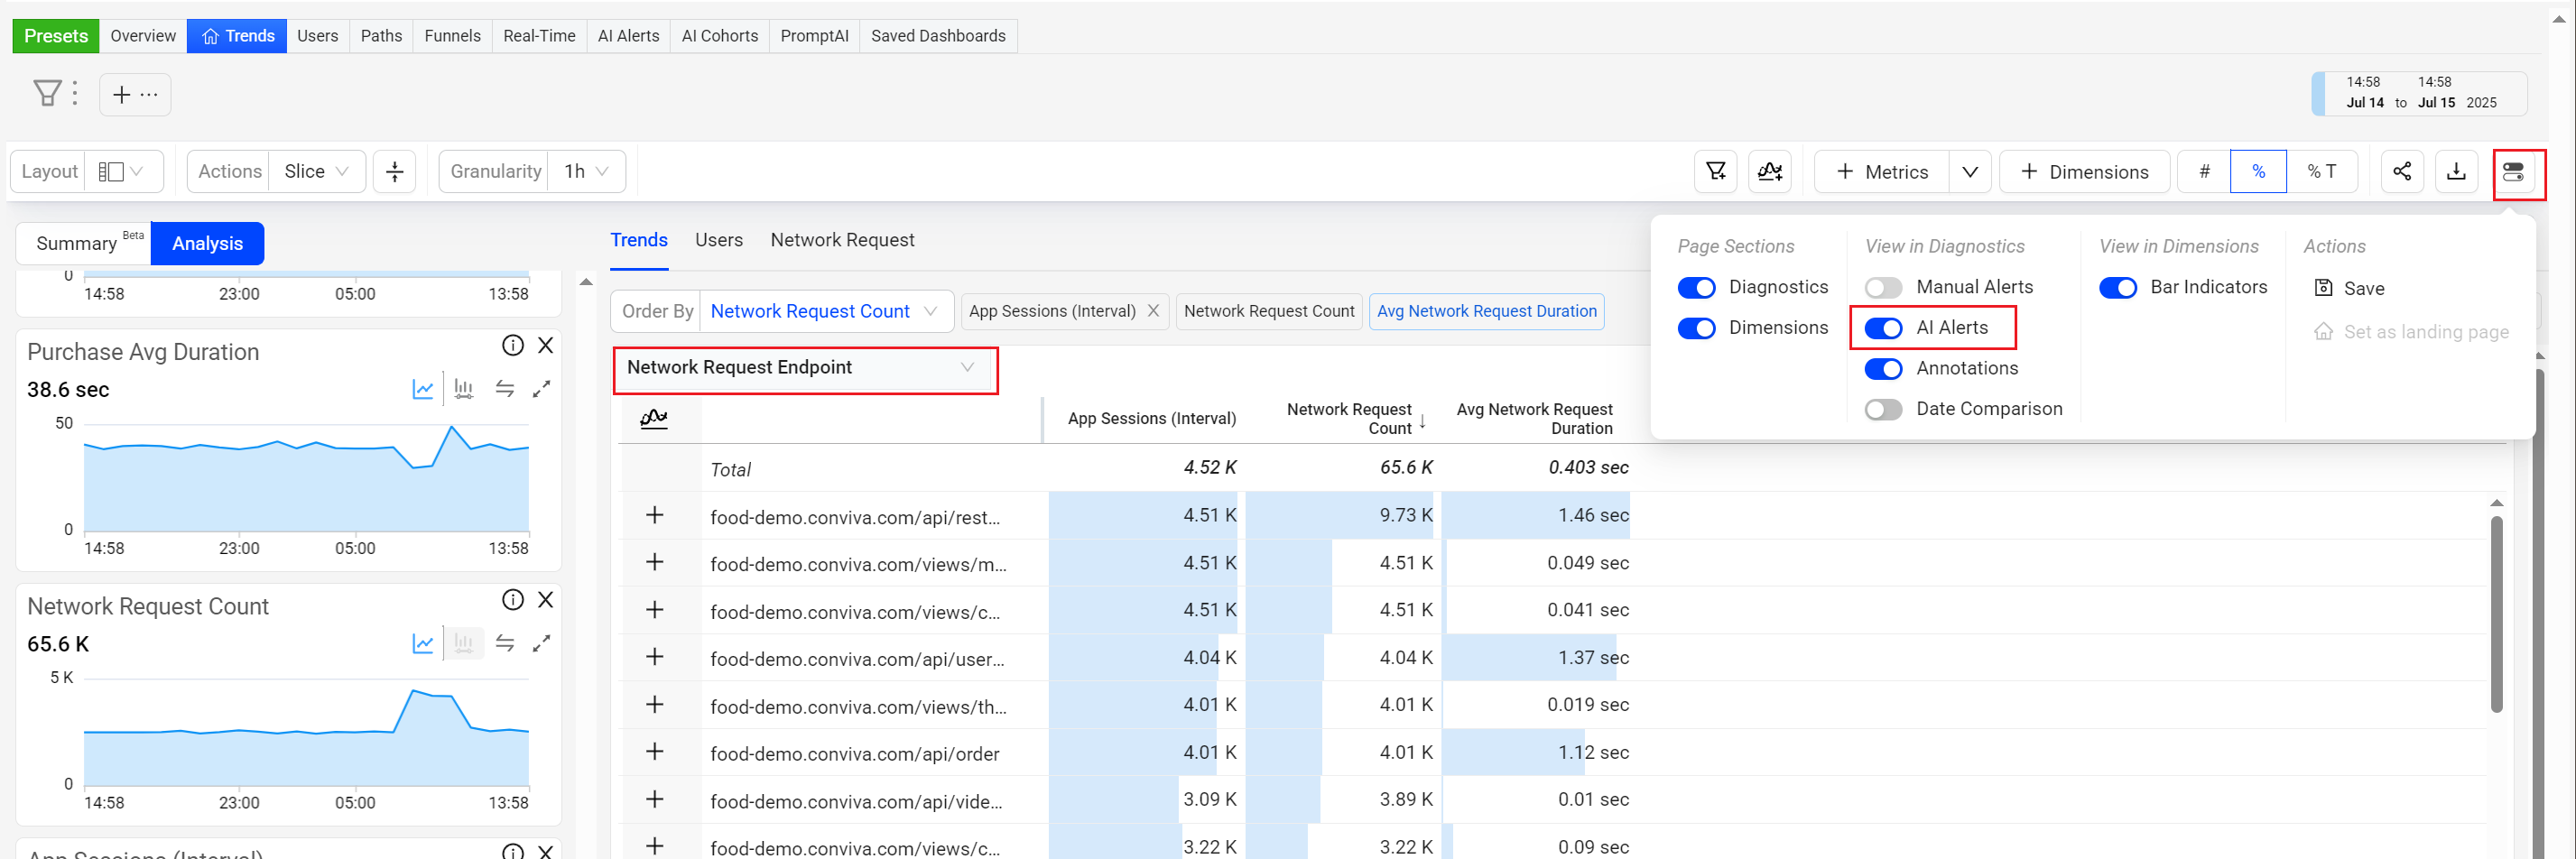
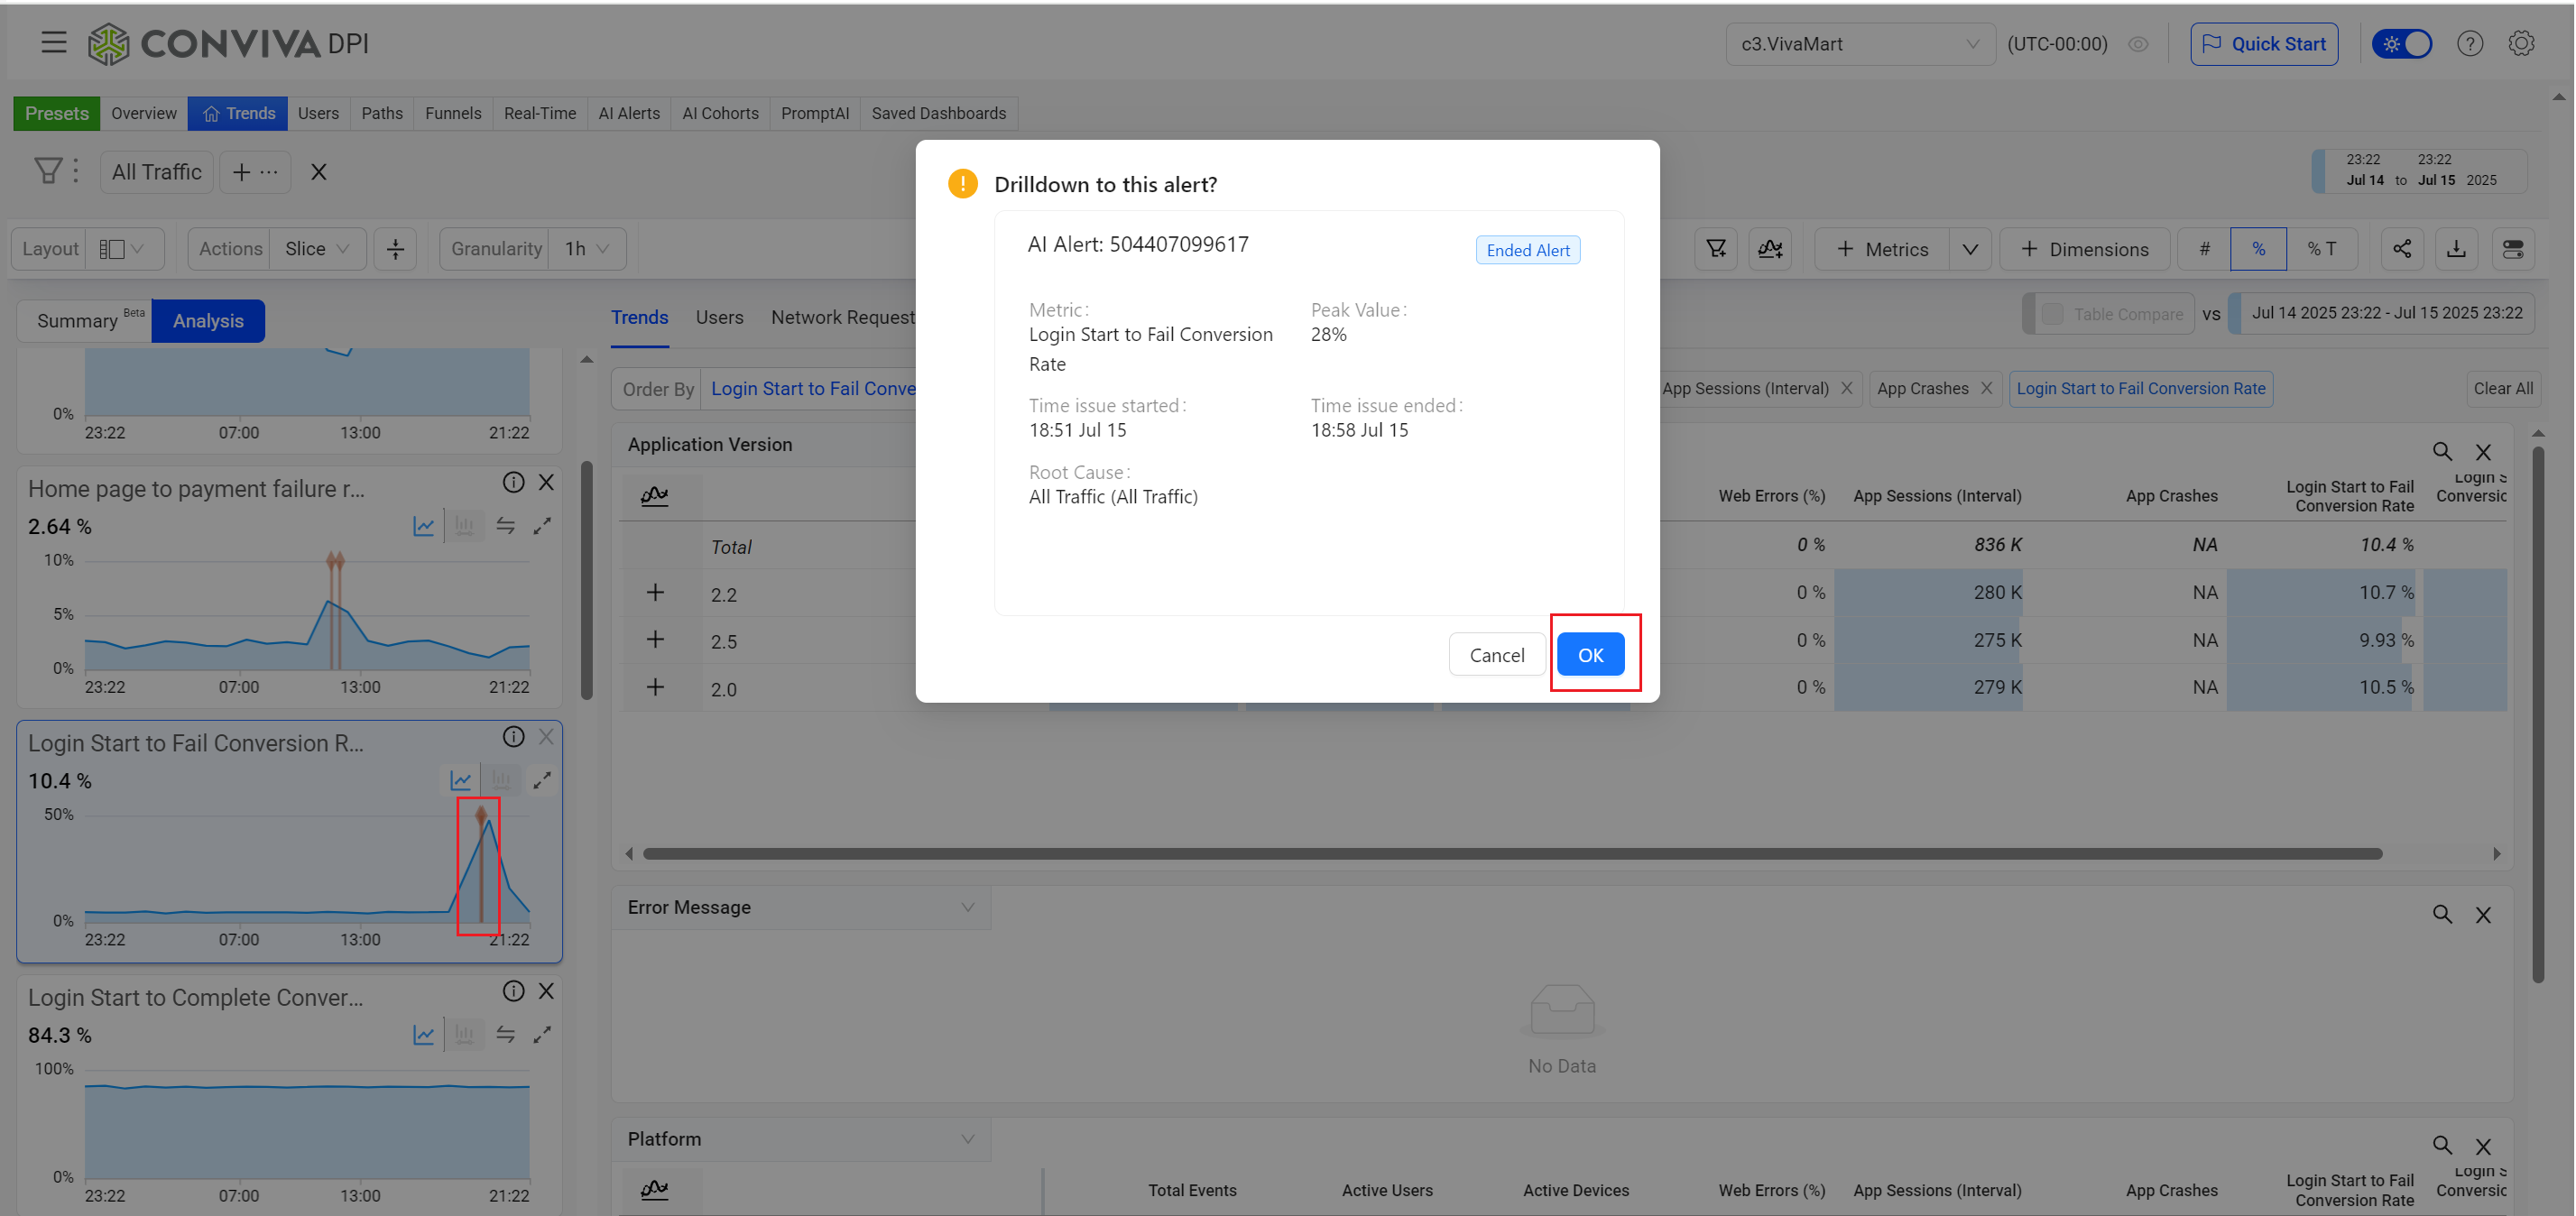
Set the display options to show AI alerts in the time series widgets. |
|
|
|
Track Application Service Levels and Performance Indicators
| Perform These Tasks: | View preview image: |
|---|---|
|
|
|