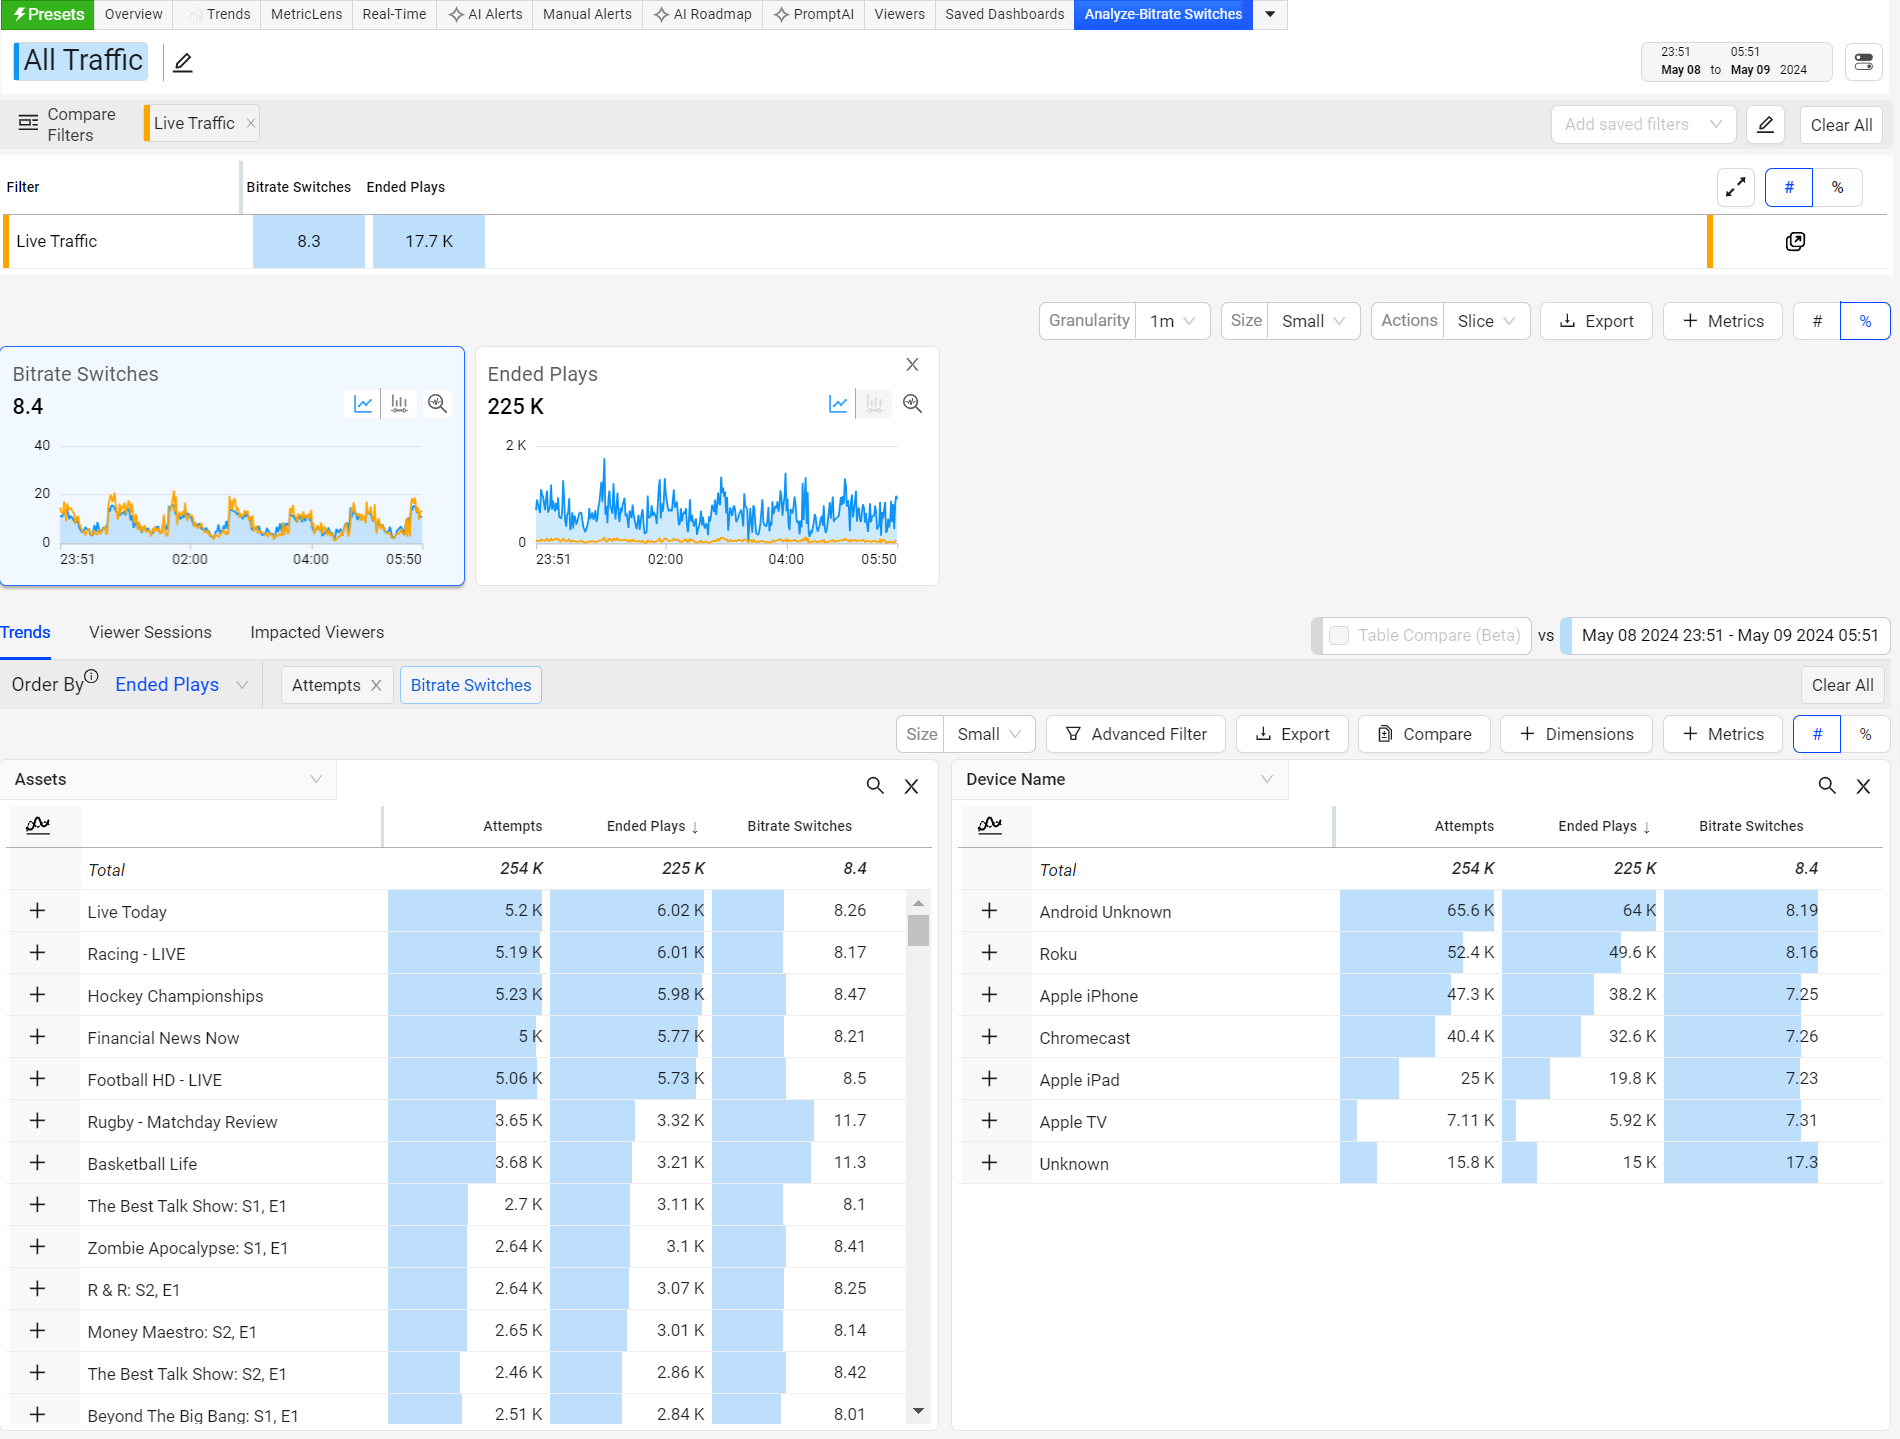
Custom dashboard enables the creation of personalized dashboards by combining widgets and display options to highlight key insights. Widgets display metrics and dimensions in summary, table, or distribution formats. The dashboard supports editing, deletion, and sharing, while recipients of shared dashboards can view or clone them.
Additionally, filter settings for each dashboard target specific types of video streams, such as Live video on Roku devices viewed in the United States within the last 30 days.
These use cases allow you to easily create Custom Dashboards with Video metrics and metadata. Custom metrics analyze application performance and user experience in various use cases.
For information on accessing custom dashboards, see Custom Dashboards.
Map
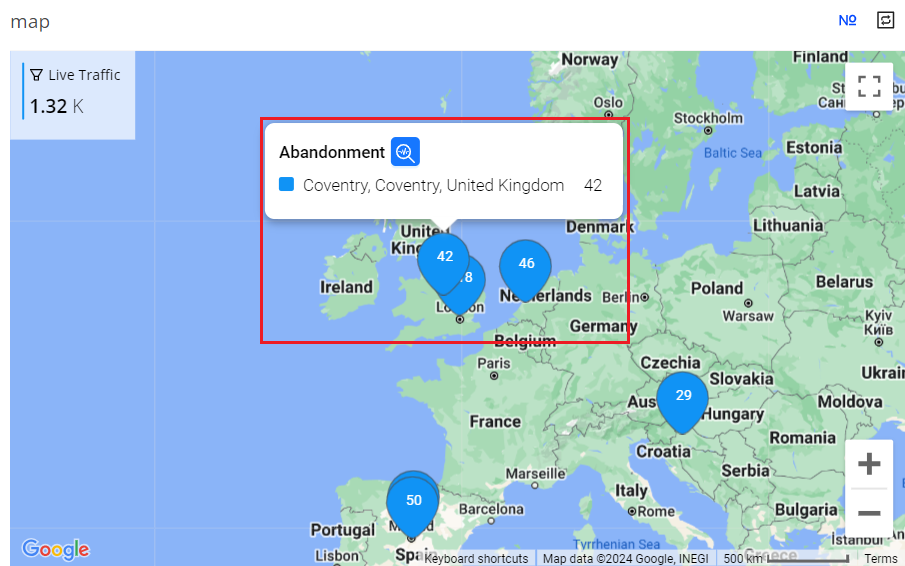
The Map in the custom dashboard lets you effortlessly display metrics and dimensions in widgets. This chart provides an intuitive method to visualize metrics across different geographies, including country, state, and city.
Creating a Map Widget
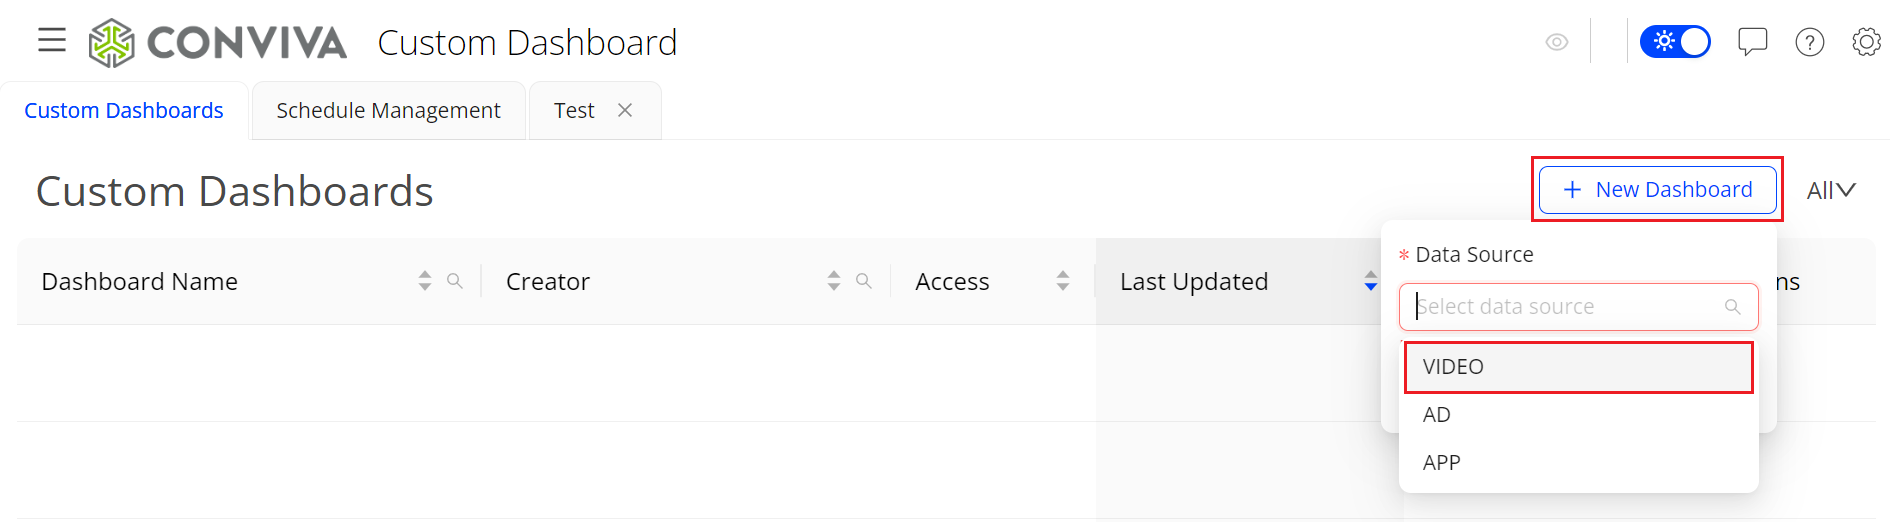
On the Custom Dashboard main page, click Add New Dashboard in the top right corner, select SEI from the Data Source list, and click Create.
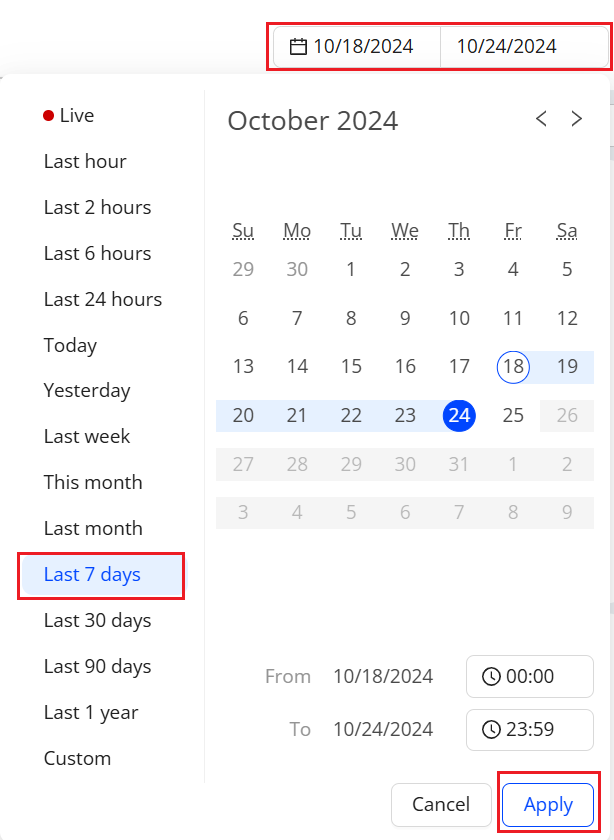
From the date picker, select the time range, and click Apply. The default time range is Last 6 hours. In this example, we depict Last 7 days.
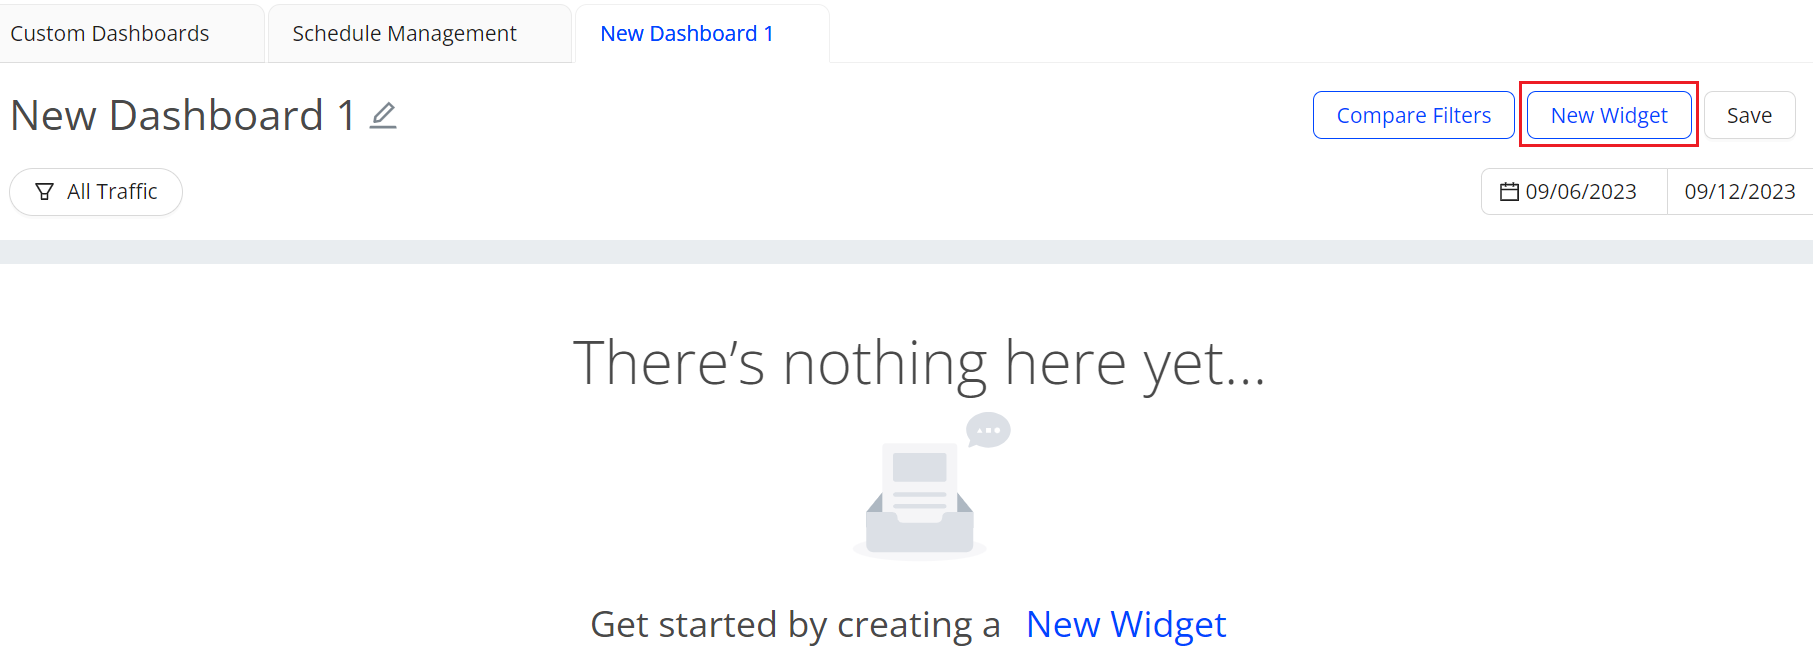
Click New Widget to see the Add New Widget page.
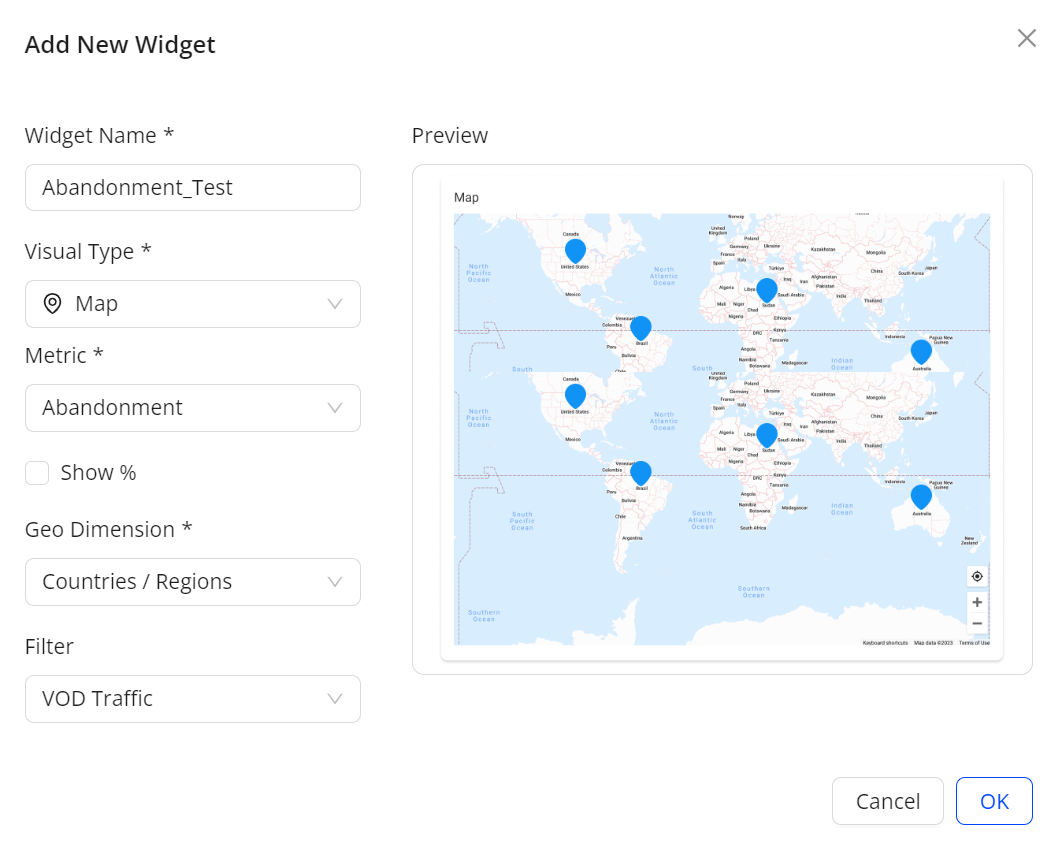
Provide the necessary information, and click OK to see the dashboard with the Map widget. In this example:
- Widget Name: Abandonment_Test
- Visual Map: Map
- Metric: Abandonment
- Geo Dimension: Countries/Regions
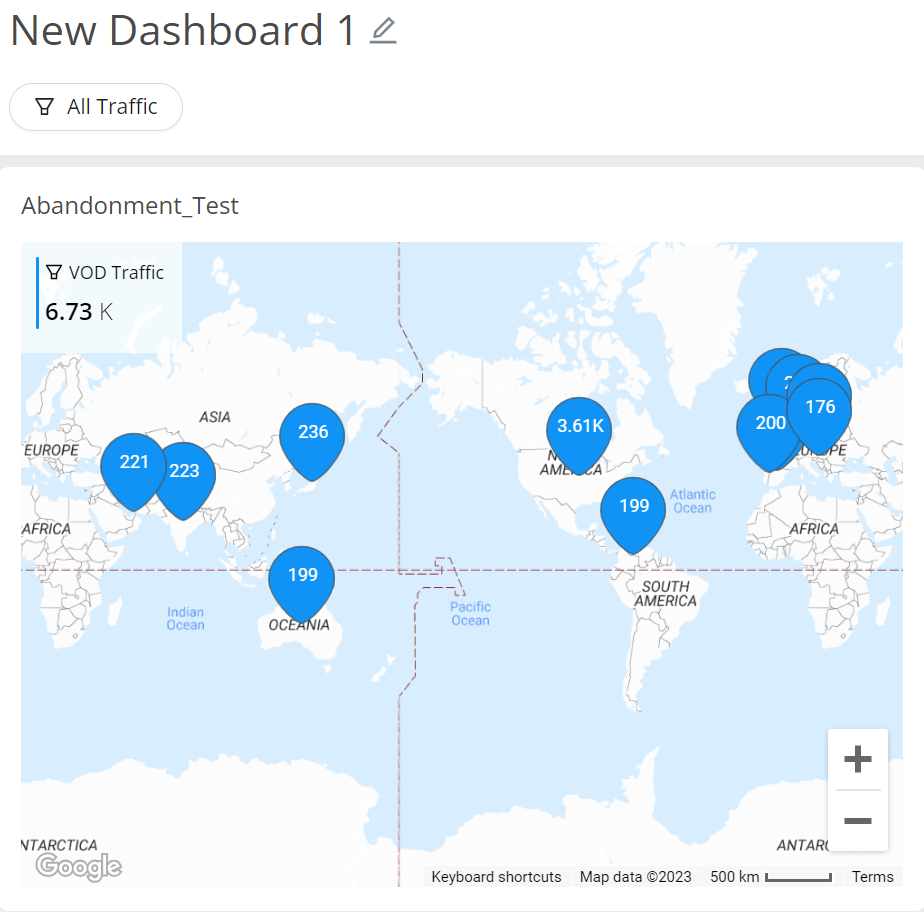
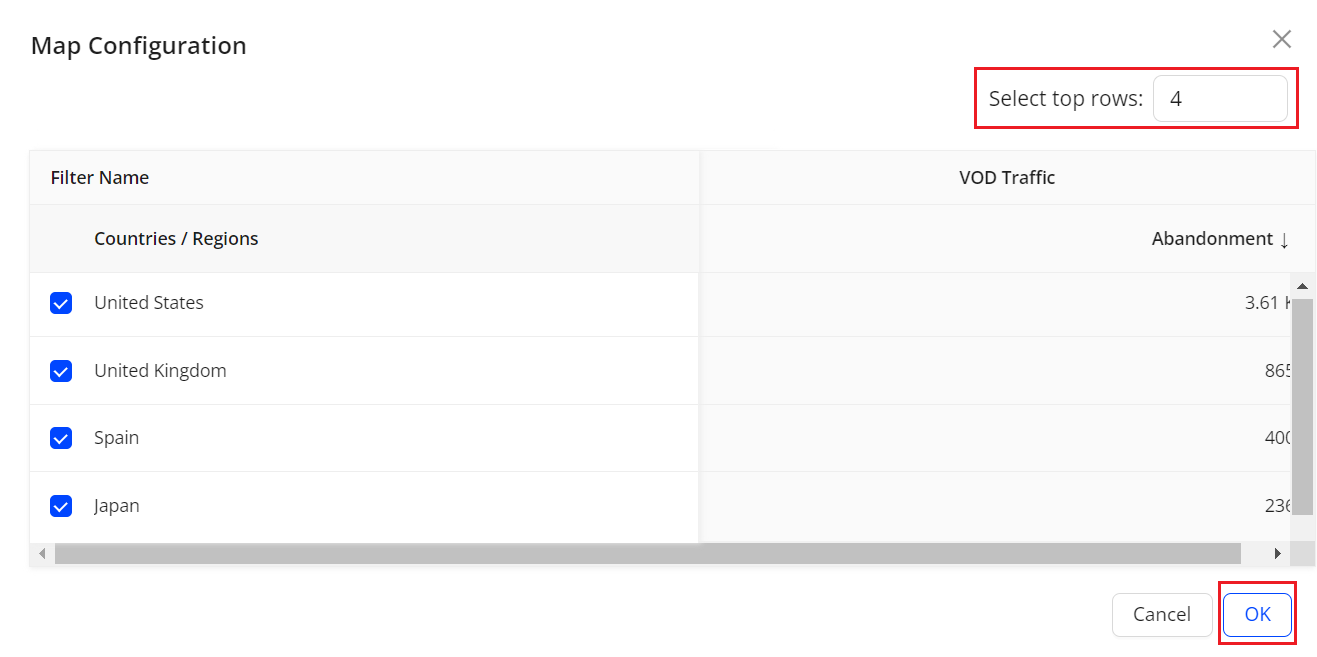
You can see only the top results by clicking the Map Configuration icon, fill the Select top rows field, and click OK.

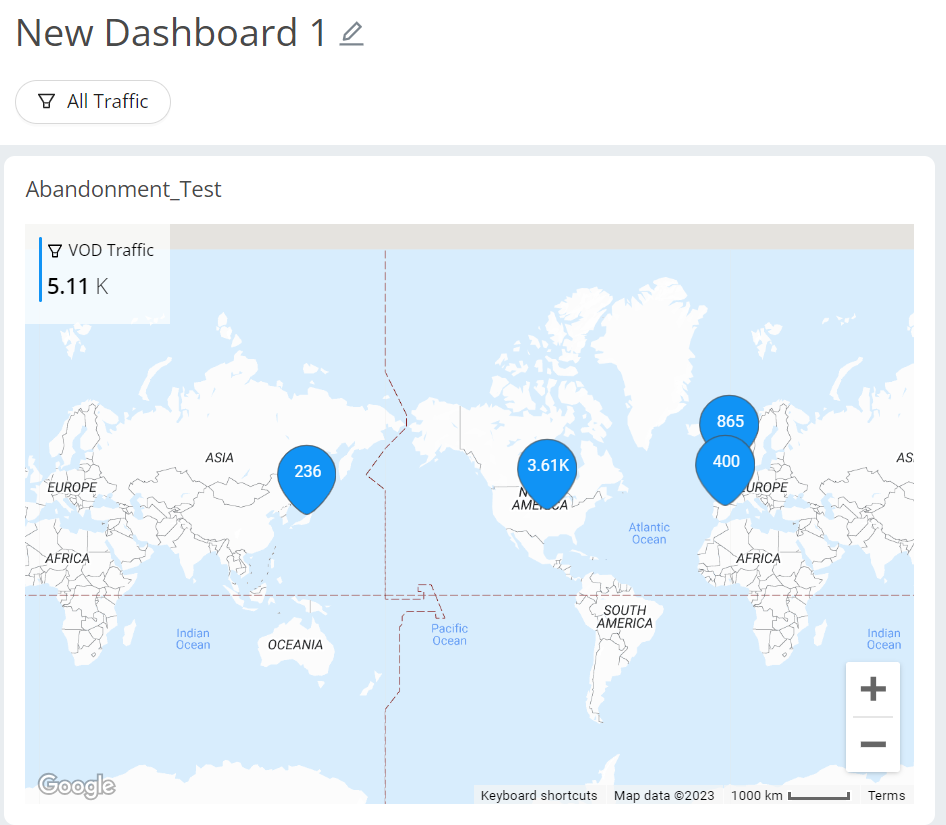
Hover the pin to see the Focus button.
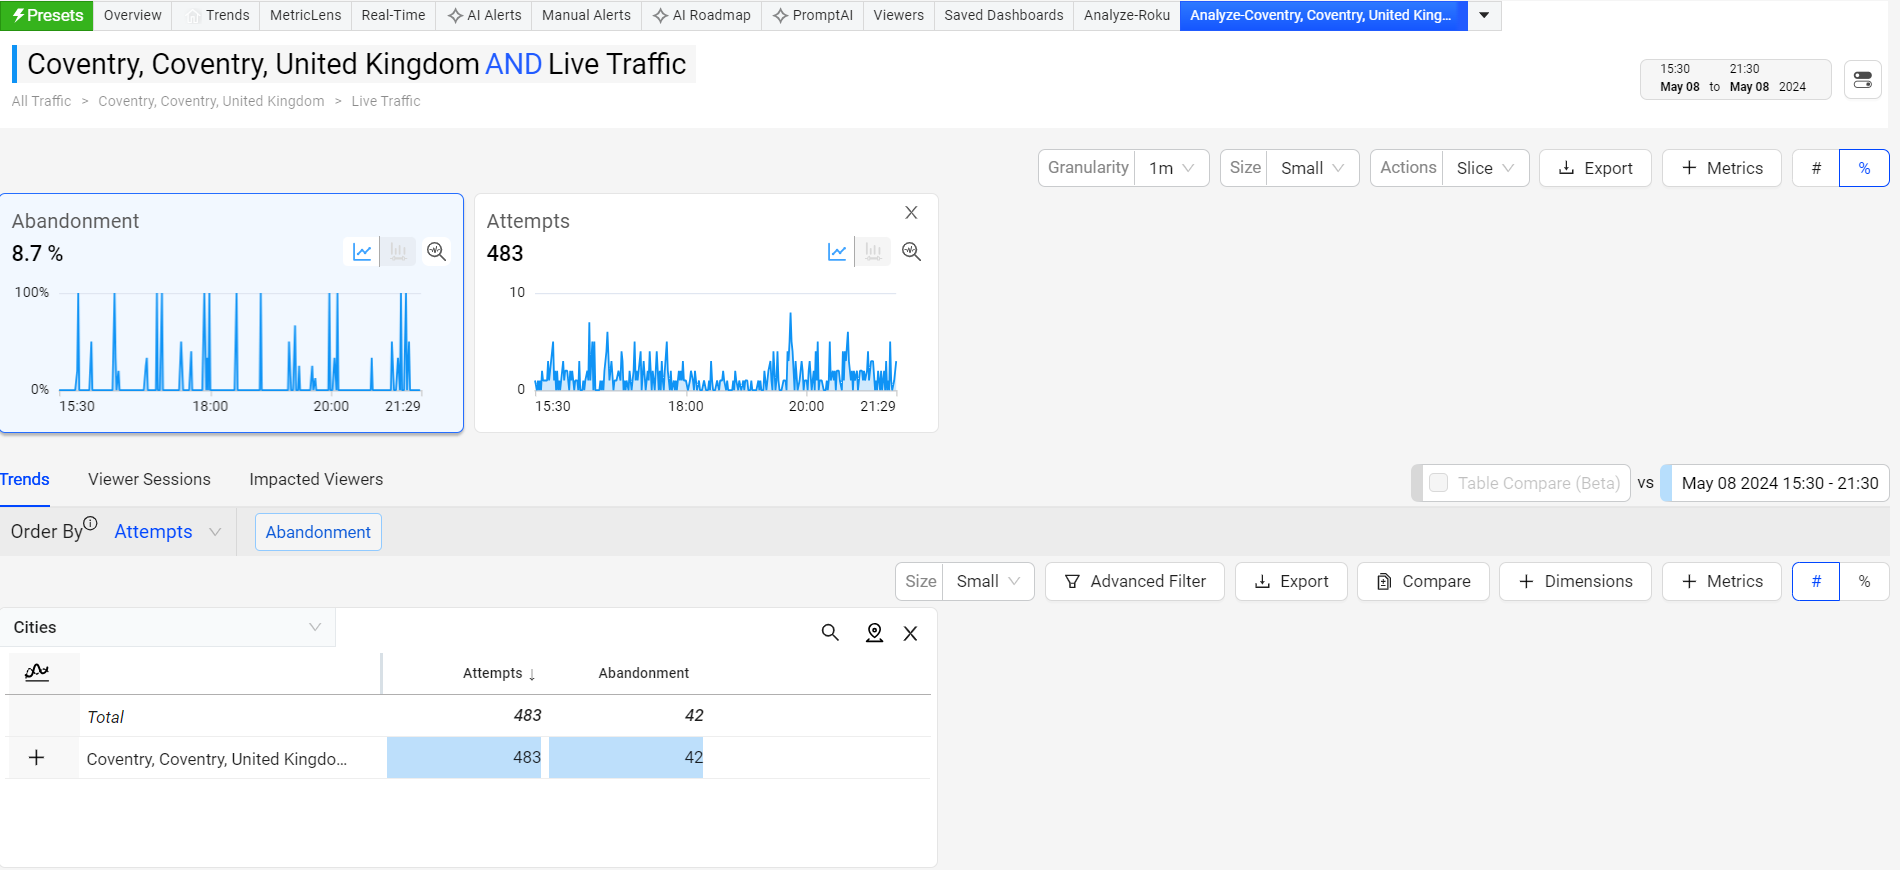
Click the Focus button to drill down on the entity, to see the filter created for the selected city and the traffic in Trends view for further data analysis.
Error Code Table
This dashboard enhances the data analysis by presenting a comprehensive view of error codes associated with the selected metric.
Creating a Widget with Error Code Table
On the Custom Dashboard main page, click Add New Dashboard in the top right corner, select SEI from the Data Source list, and click Create.
From the date picker, select the time range, and click Apply. The default time range is Last 6 hours. In this example, we depict Last 7 days.
Click New Widget to see the Add New Widget screen.
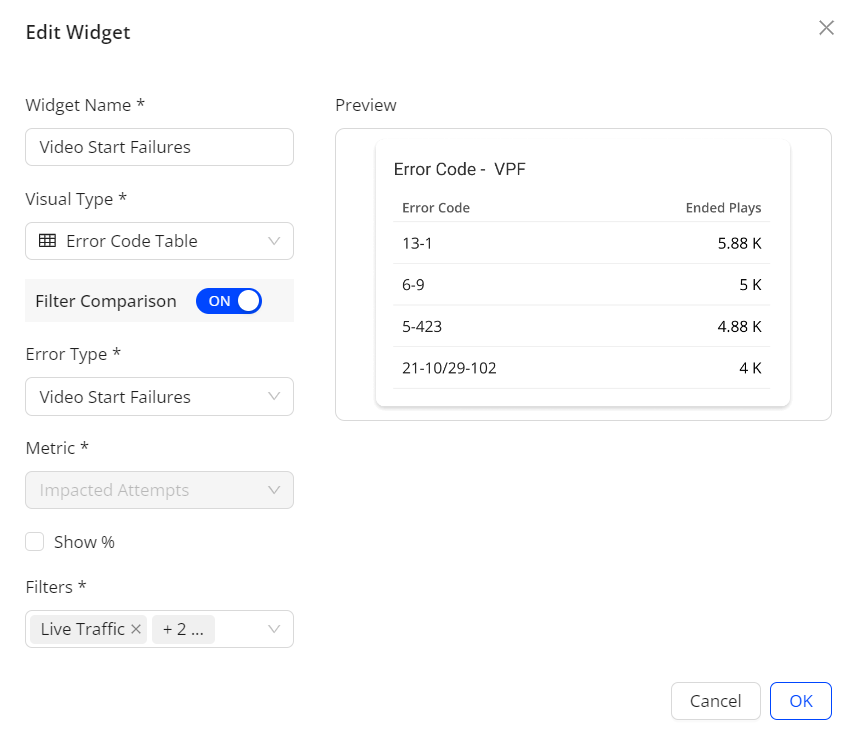
Provide the necessary information, and click OK to see the dashboard with the Error Code Table widget. In this example:
- Widget Name: Video Start Failures
- Visual Type: Error Code Table
- Error Type: Video Start Failures
- Filters: Live Traffic, All Traffic, and VOD Traffic
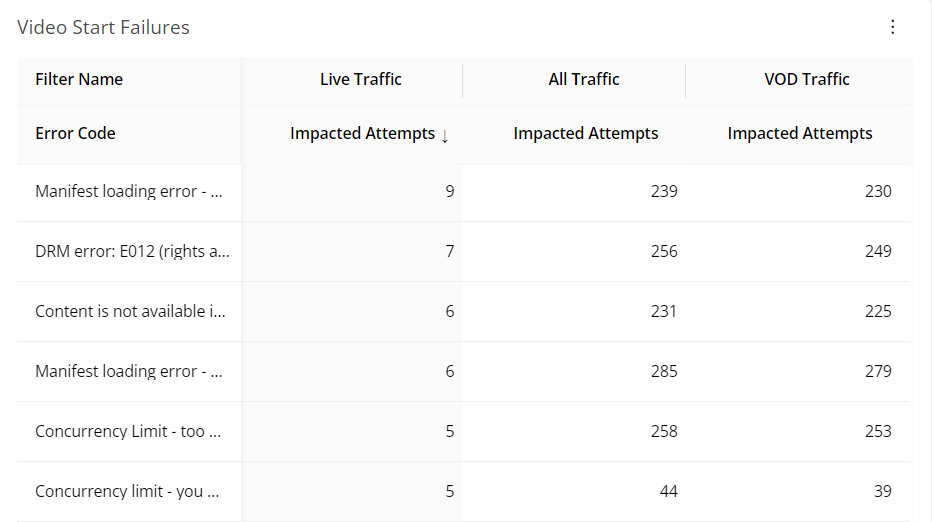
Hover the Error Code to see the Focus button.
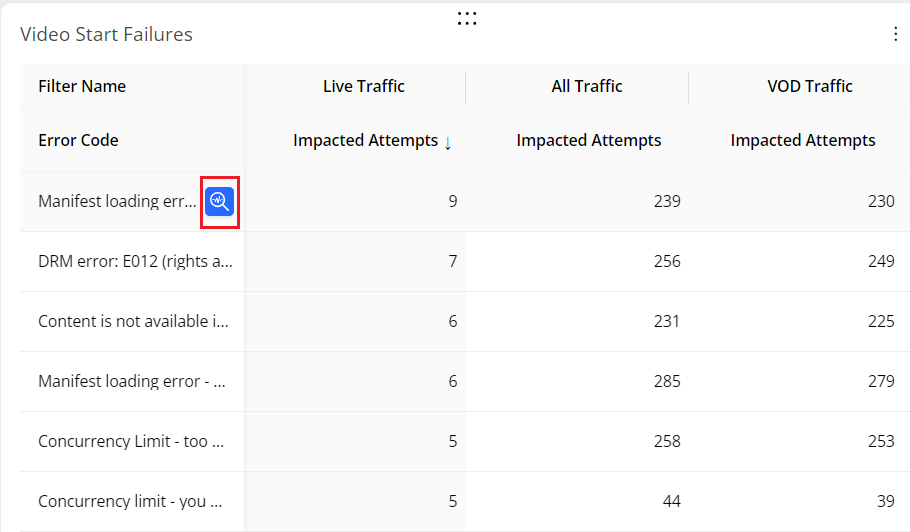
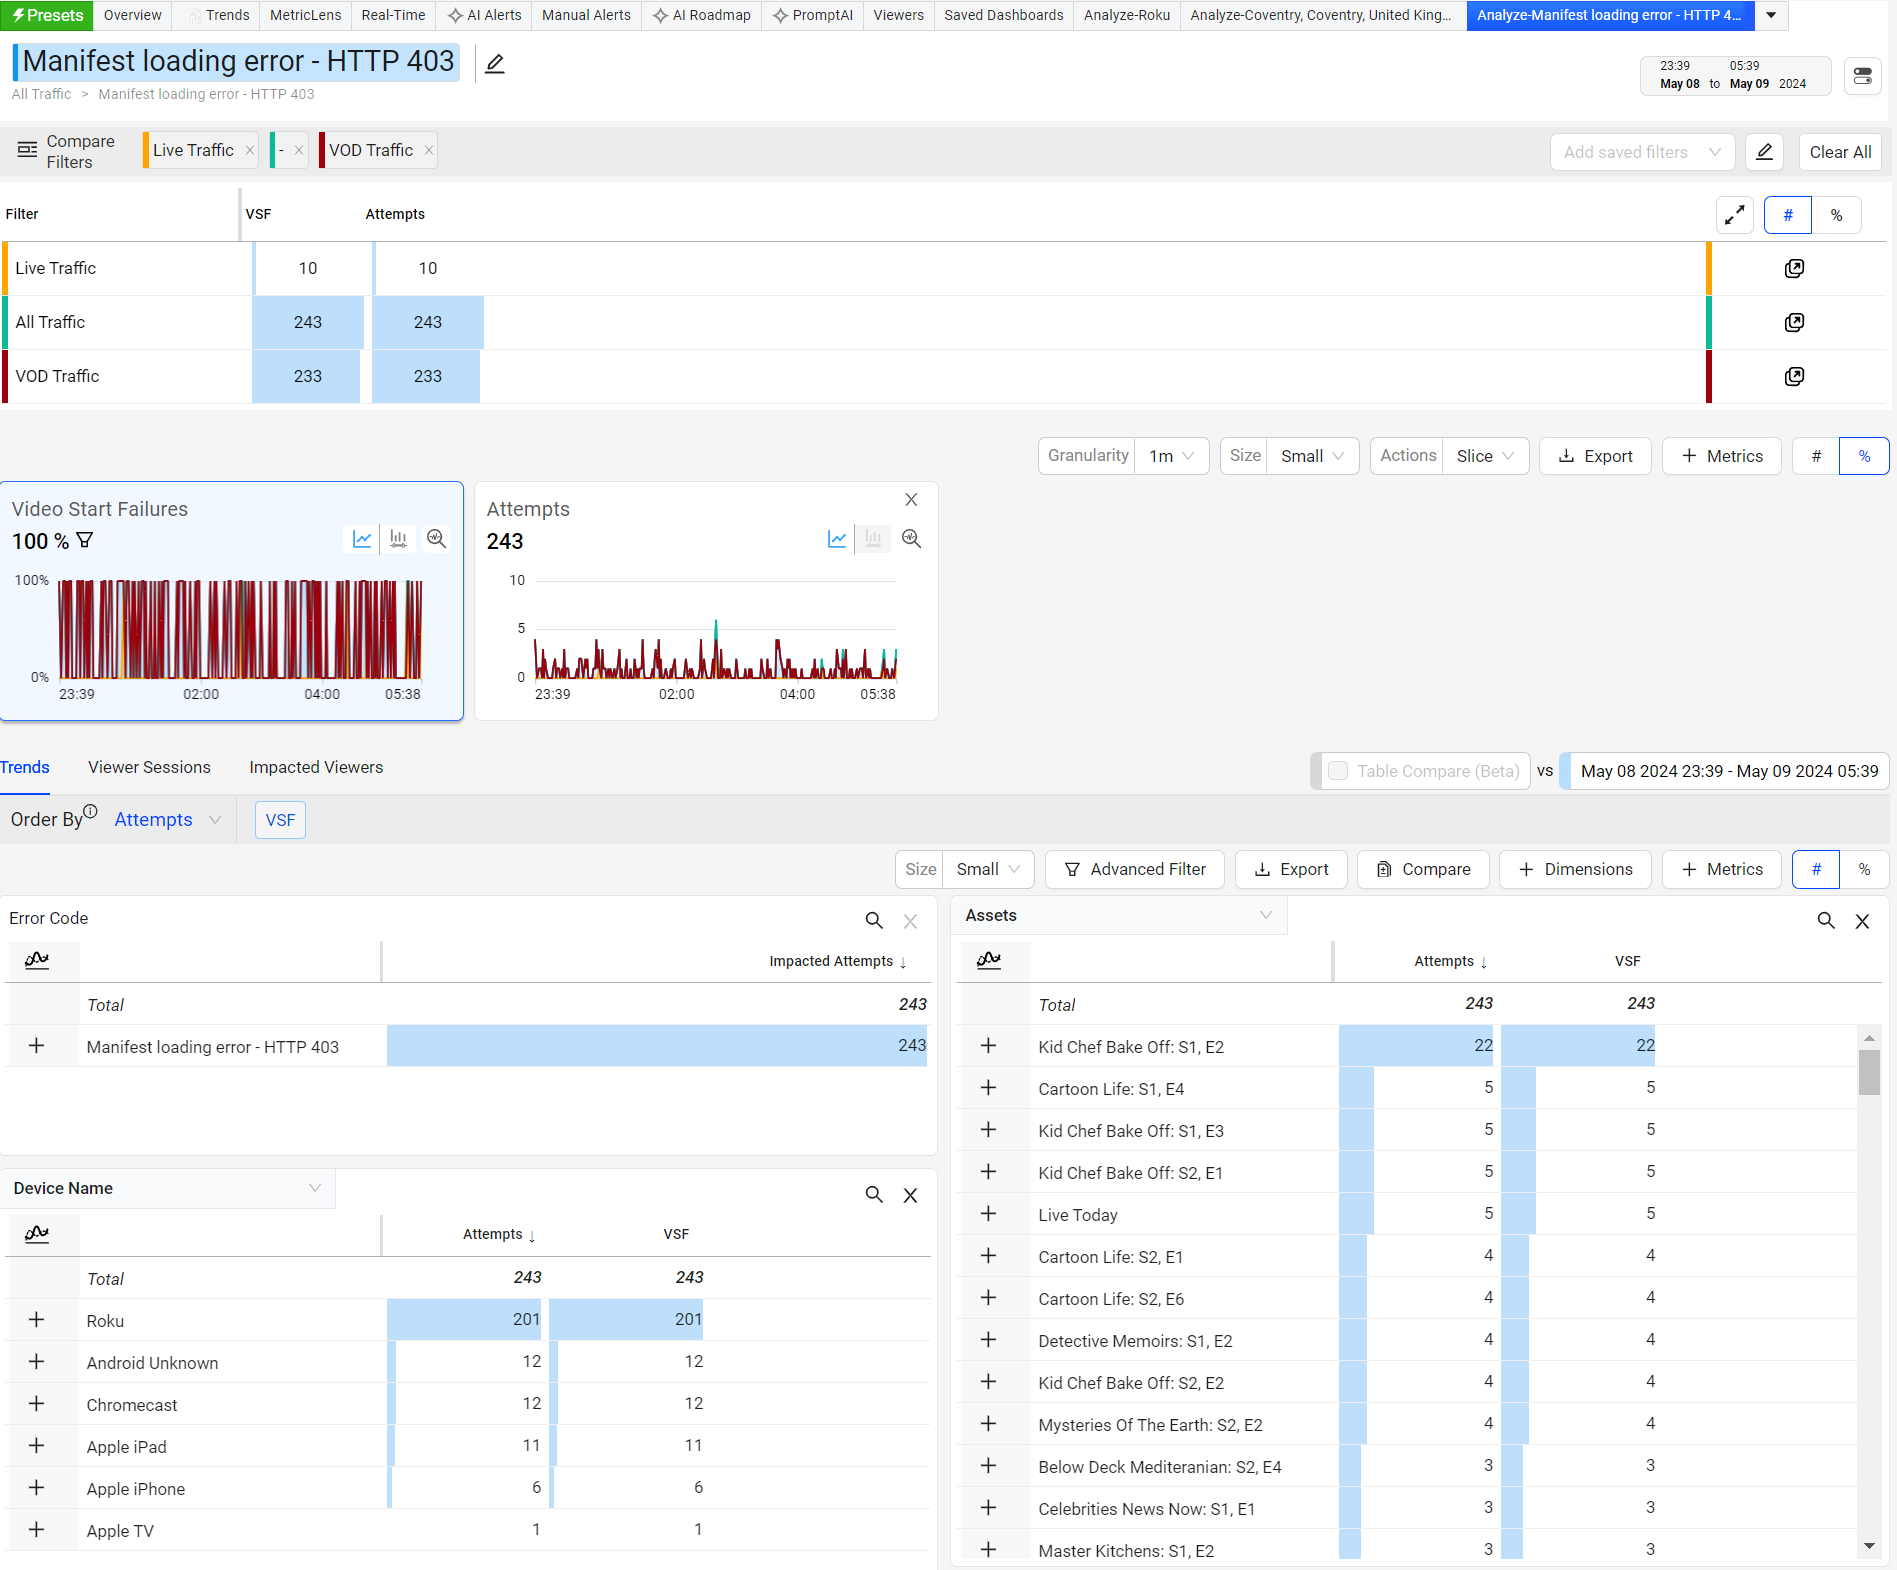
Click the Focus button to drill down on the error code, to see the error code filter created with the comparison of traffic in Trends view for further data analysis.
Distribution
This dashboard allows you to quickly grasp the per-session breakdown of the selected metric.
Creating a Widget with a Distribution
On the Custom Dashboard main page, click Add New Dashboard in the top right corner, select SEI from the Data Source list, and click Create.
From the date picker, select the time range, and click Apply. The default time range is Last 6 hours. In this example, we depict Last 7 days.
Click New Widget to see the Add New Widget screen.
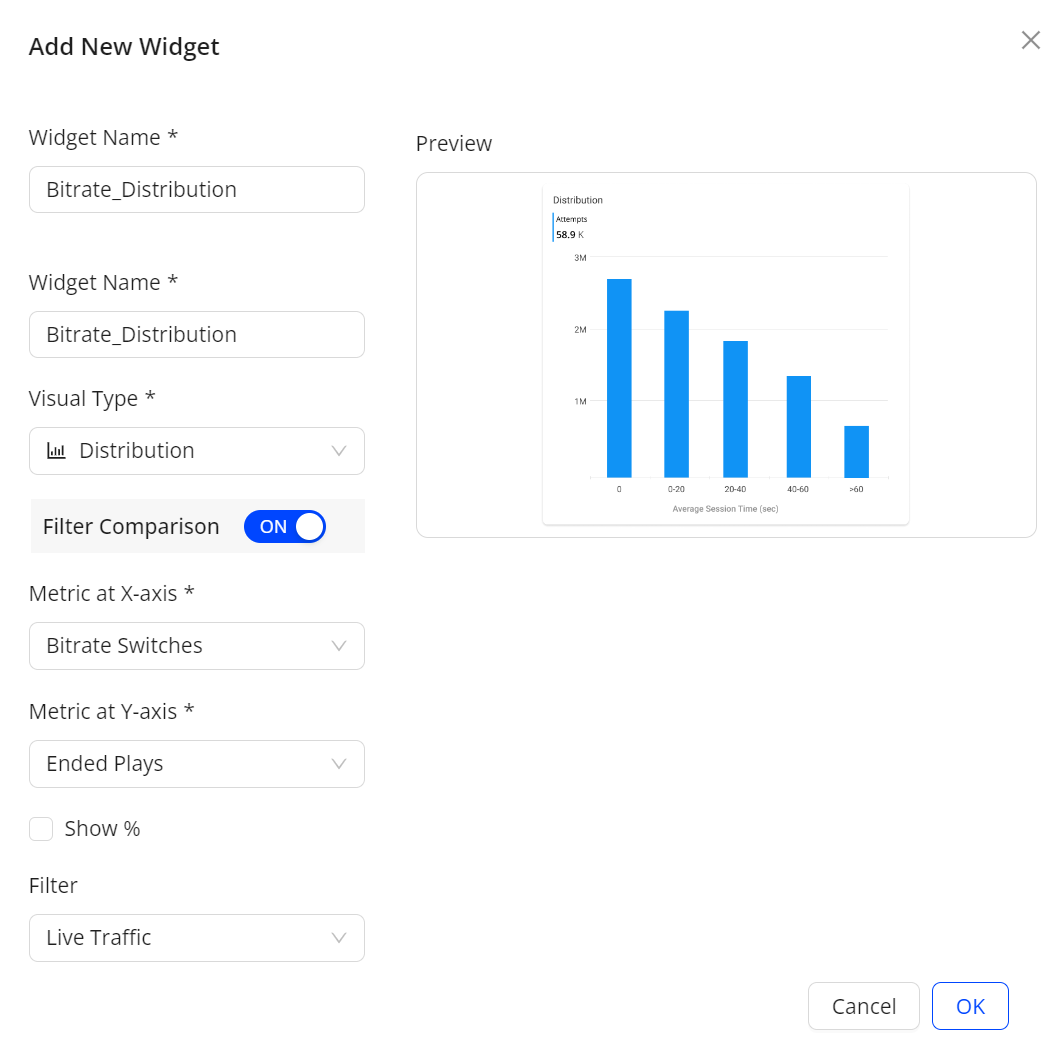
Provide the necessary information, and click OK to see the distribution chart. In this example:
- Widget Name: Bitrate_Distribution
- Visual Type: Distribution
- Metric at X-axis: Bitrate Switches
- Metric at Y-axis: Ended Plays
- Filters: Live Traffic
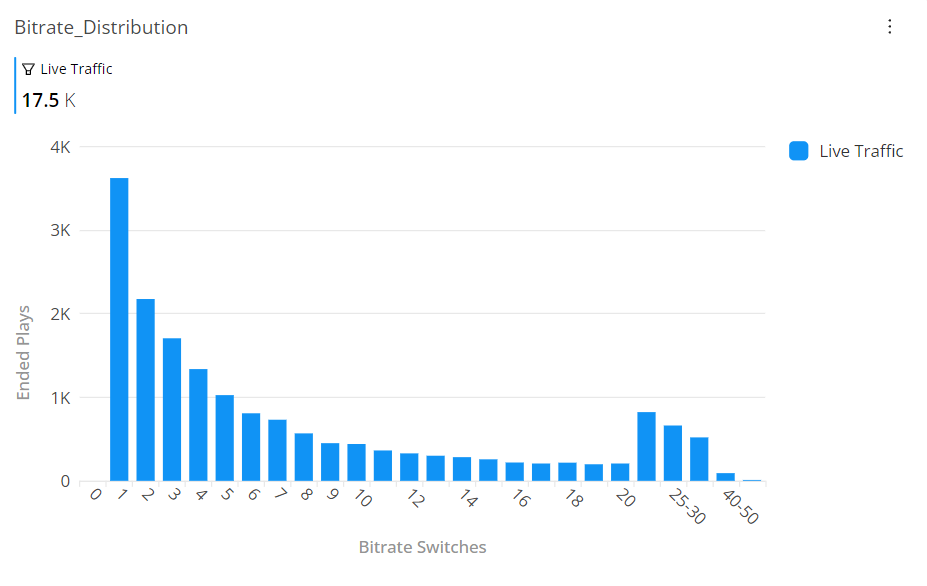
Hover the bar to see the Focus button.
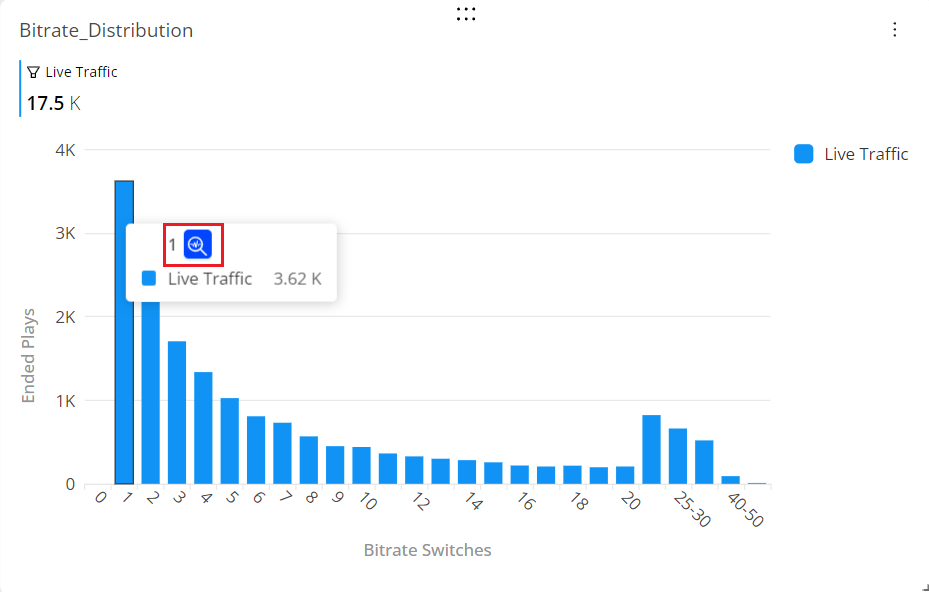
Click the Focus button to drill down on the selected bar and view traffic comparisons in the Trends view with the metrics and dimension data updated based on the filter created for further data analysis.