
The Overview dashboard provides a highlight of your streaming activity and performance so you can quickly view your level of streaming activity, compare your streaming performance with the Conviva Streaming Performance Index, and analyze opportunities for improvement with dimensional analysis across key performance areas. This comparative analysis includes analyzing performance across sessions with and without ads, and your performance versus benchmarks of Conviva cohorts.
In addition, you can set custom values for the KPIs used to determine the thresholds for improvement opportunities and performance analysis, such as zero CIRR, low rebuffering, and high average bitrate levels, for customized streaming activity and performance analysis.
When interpreting your audience data, keep in mind:
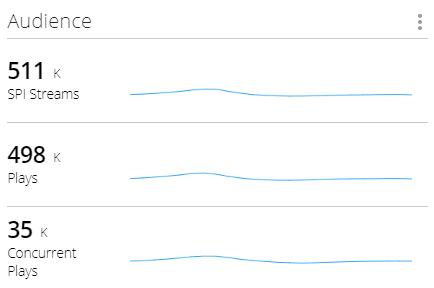
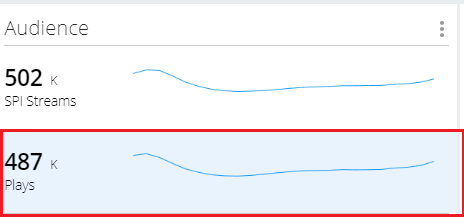
- SPI Streams show the Conviva monitored streaming sessions which contributed to the SPI calculation based on your SPI threshold settings. Sessions that exited before the video started when the viewer did not wait a significant time and sessions impacted by business logic errors are not included in the SPI streams.
Abandonment and Startup Error are calculated as a percentage of all attempts, including attempts during which viewers had early abandonment.
Plays show the video sessions during which the viewer saw at least the first frame of the video.
Concurrent Plays show the maximum number of simultaneously active sessions during a given interval. Active sessions have at least one played video frame, and do not include unsuccessful play attempts or sessions that had ended.
Benchmarks are based on Conviva’s OTT streaming intelligence and industry-leading video streaming coverage across publishers. The benchmark is defined as the 95th percentile (for example, 5th best publisher out of 100) and determined for each country.
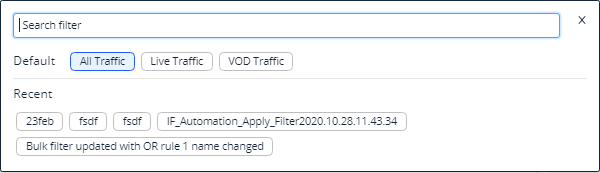
You can also apply filters to focus your overview on specific streaming segments from any saved Conviva filter setting. Click All Traffic to access filter selection.
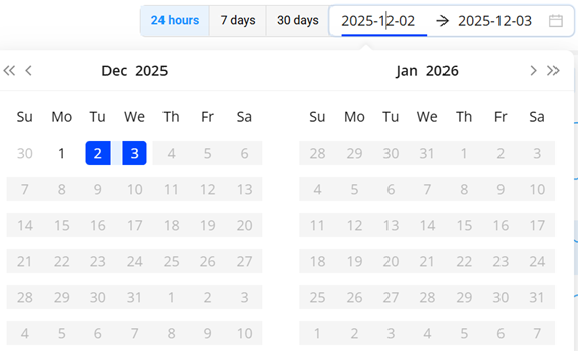
Use the Time picker to select the desired time range.
Use the Kebab icon to Save and Share the page. After clicking Share, Video saves a snapshot of the item for 30 days and produces a link that you can share by email, by Slack message, or by pasting it into another document.
When a user opens the link and logs in to SEI, they see an exact copy of the item you sent. They can change how Video presents the data in the snapshot, but cannot change which data are part of the snapshot. For example, the user can deselect metrics to hide them, but they can't change the dimensions or time interval.
You can also set this page as your default page.
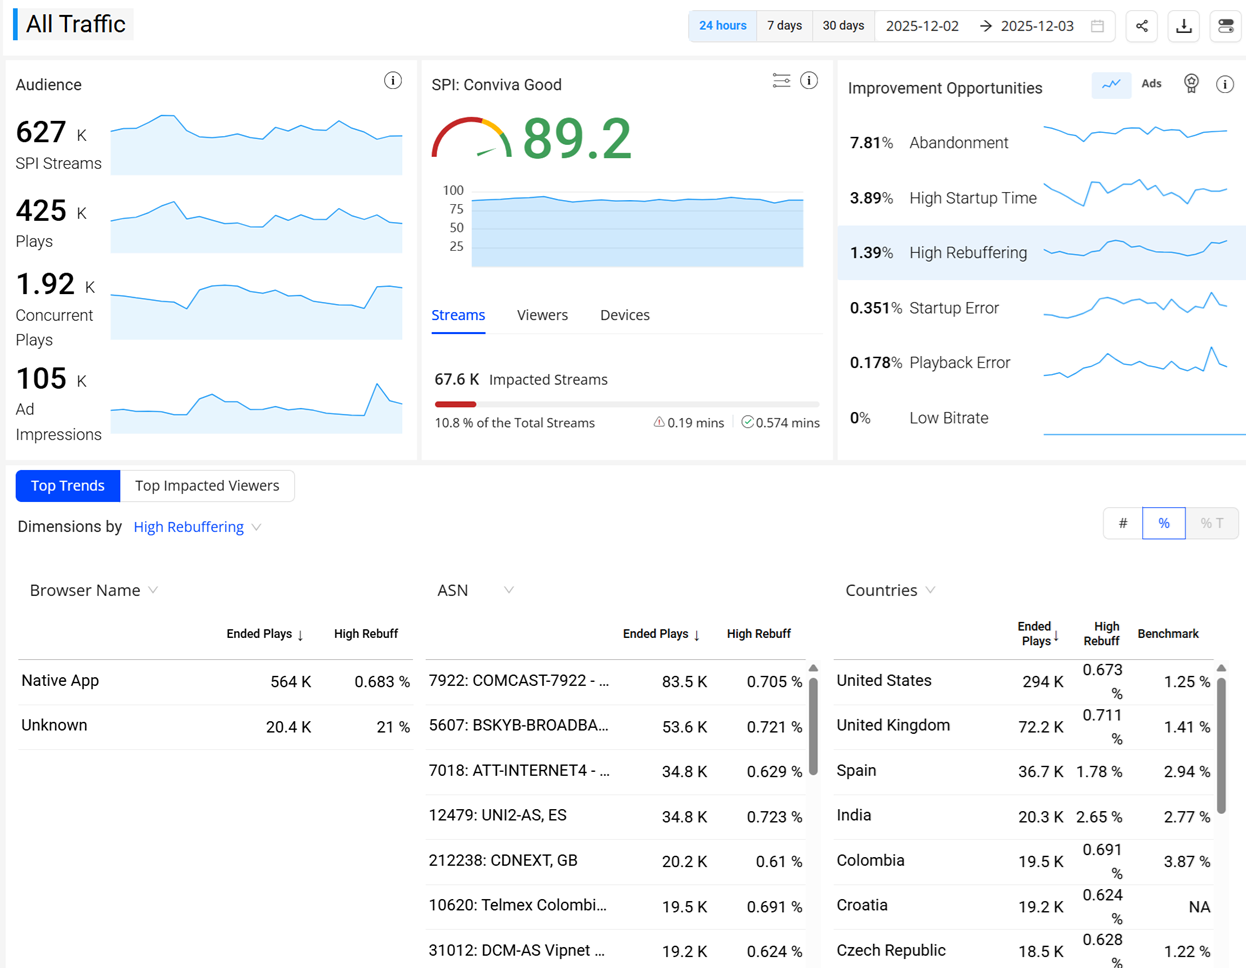
The Overview widgets provide summaries of streaming activity, your SPI, improvement opportunities, and dimensional analysis.
Export
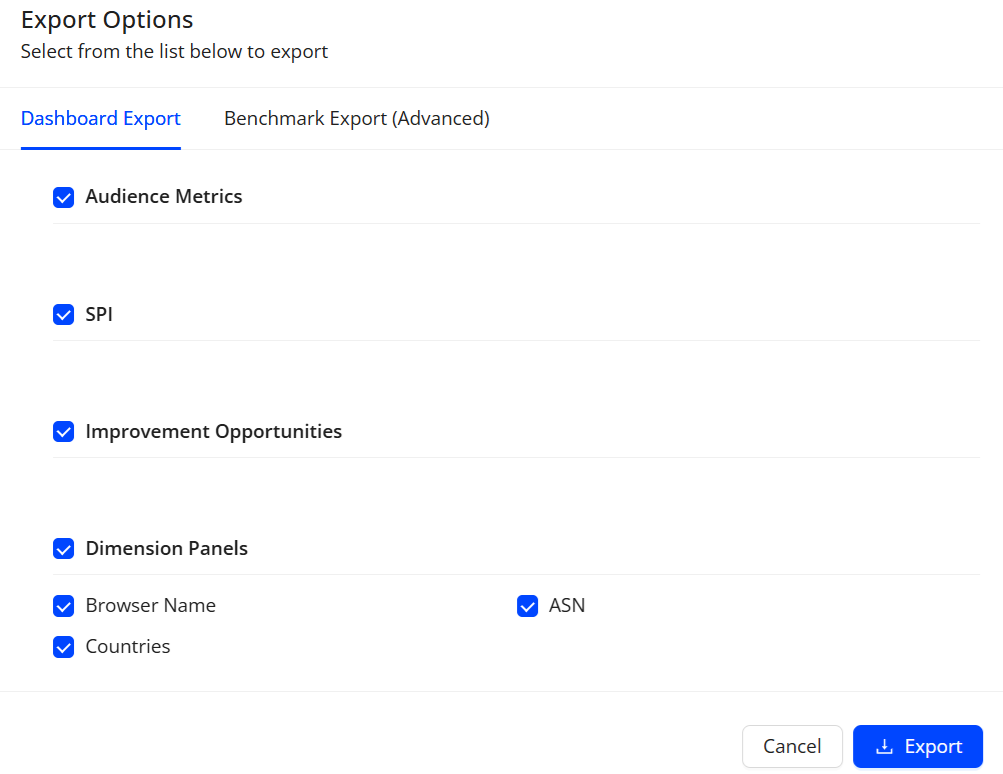
The Overview dashboard provides a option to export the dashboard and benchmark details.
Dashboard Export
Select the checkbox next to the components you wish to export.
Benchmark Export (Advanced)
To export the benchmark details, select from the list below.
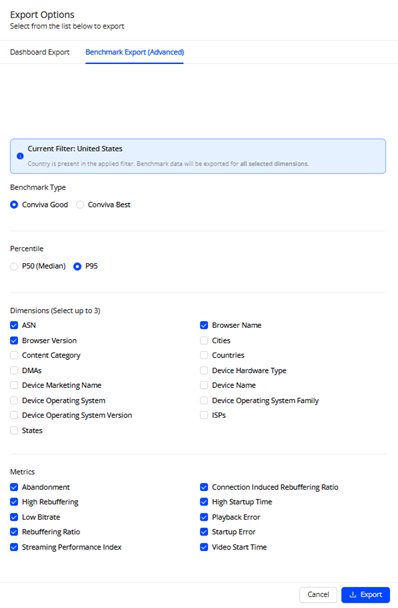
After selecting the details click Export to download the benchmark details in a .csv format.
Audience
The Audience widget allows you to quickly view the level of streaming activity in the selected period.
Streaming Performance Index
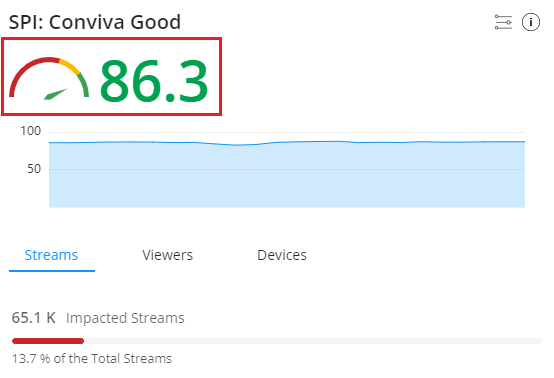
Use the SPI to view a visual indicator of your KPIs and metric performance over the selected period. Also, quickly determine the number and percent of impacted streams. A stream is impacted when it fails to meet one or more of the KPI settings. The specific KPI performance of streams is shown in Improvement Opportunities.
SPI Streams refers to all Conviva monitored streaming sessions which contributed to the SPI calculation. Exits before the video started when the viewer did not wait a significant time and sessions impacted by business logic errors are not accounted for the SPI calculation. The Streaming Performance Index and SPI Streams appear as metrics in Trends and other dashboards.
Conviva formulates a unified streaming performance KPI based on the percentage of streaming sessions with good or best viewing experience. This KPI represents the Conviva Streaming Performance Index, and is based on the percentage of streams with:
No errors (VSF-T or VPF-T)
No or very low Rebuffering (using CIRR)
Acceptable picture quality based on average bitrate for different screen sizes
Acceptable Video Start Time
No EBVS if the viewer was waiting a long time before exiting.
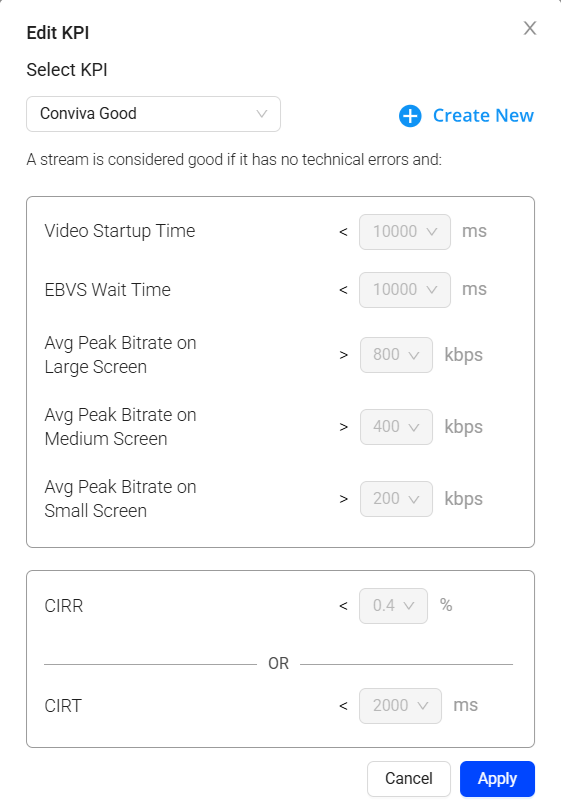
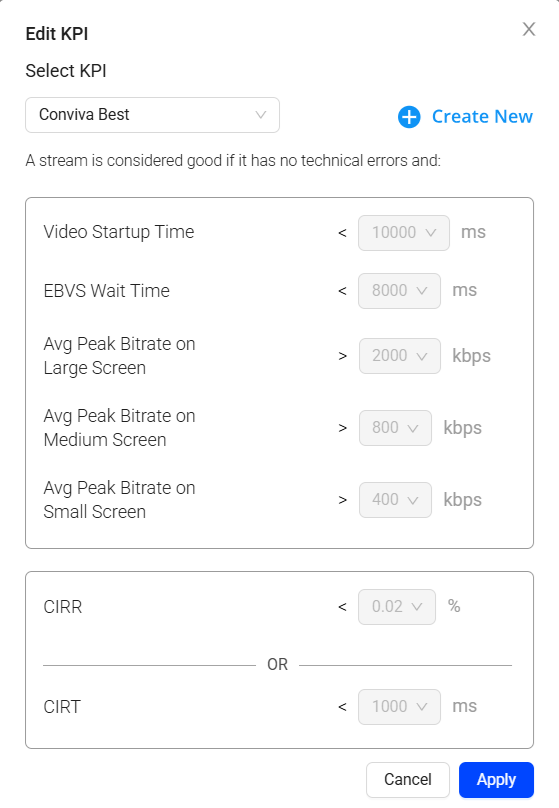
Conviva provides KPI settings based on Good and Best performance. You can also set custom KPI settings to match your specific performance goals.
Good Performance KPI Settings
No Errors (VSF-T or VPF-T)
VST-T < 10sec
EBVS wait time < 10sec
Avg. Peak Bitrate > 800Kbps for TV screens
Avg. Peak Bitrate > 400Kbps for desktop or tablets
Avg. Peak Bitrate > 200Kbps for mobile devices screens
CIRR < 0.4%
CIRT < 2sec
Best Performance KPI Settings
No Errors (VSF-T or VPF-T)
VST-T < 10sec
EBVS wait time < 8sec
Avg. Peak Bitrate > 2Mbps for TV screens **Note: Encoding compression are not considered in the bit rates.
Avg. Peak Bitrate > 800Kbps for desktop or tablets
Avg. Peak Bitrate > 400Kbps for mobile devices screens
CIRR < 0.02%
CIRT < 1sec
Click Streams, Viewers and Devices to toggle the display for analysis of impacts across video streams, viewers, and devices.
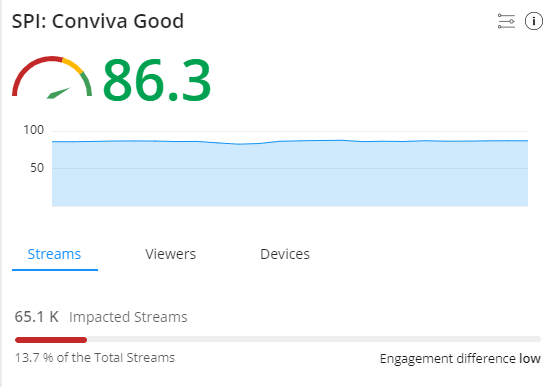
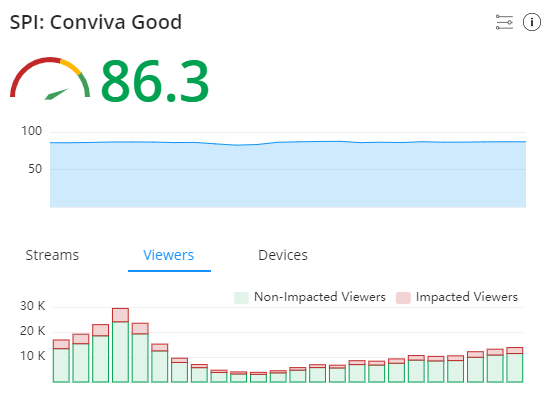
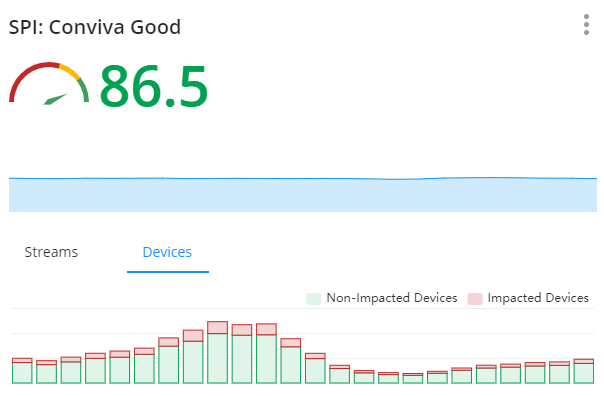
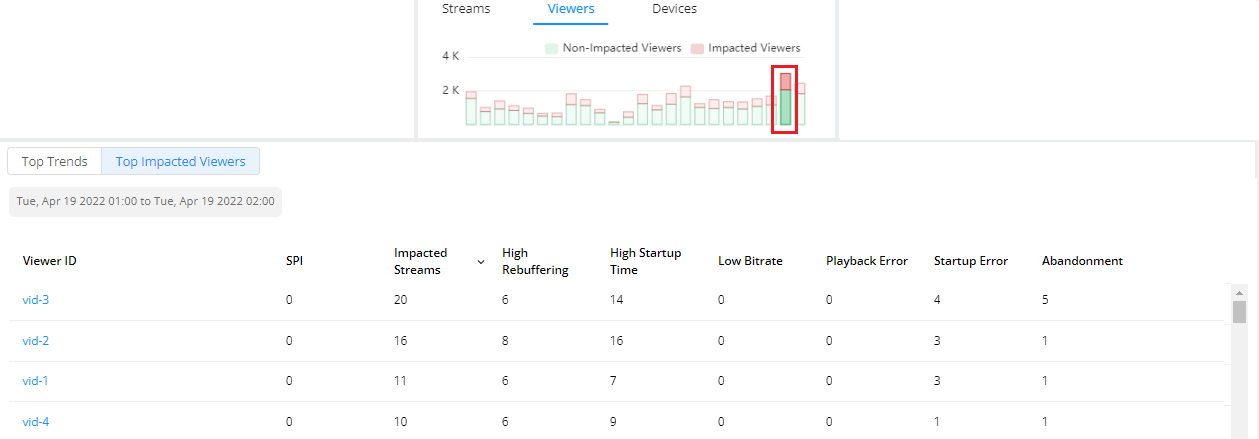
This data shows an hourly breakdown of the streams, viewers, and devices with at least 1 impacted session (SPI Stream) within the hour interval. Hover over an hourly interval to displayed the data details. Click an interval of Viewers to display the list of impacted viewers during that interval.
For streams, the engagement difference indicates a weighted comparison between the impacted stream playing times of good and bad sessions, with high engagement for a majority of good playing time and low engagement for a majority of bad playing time.
This is based on the following condition:
GoodSessionAverageLifePlayingTimeMins > BadSessionAverageLifePlayingTimeMins * 1.1
For example,
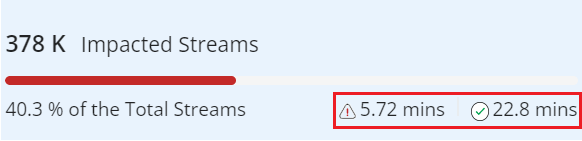
The GoodSessionAverageLifePlayingTimeMins is 22.8 and BadSessionAverageLifePlayingTimeMins is 5.72, the above condition is true, and the Impacted stream average playing time value is displayed.
The Impacted stream widget shows the value only when the number of good sessions exceeds bad sessions by 10 percent; else, it displays the message "Engagement difference low."
Impacted and non-impacted streaming times show the average playing times of the related sessions in minutes. For example, impacted streaming time is calculated as the sum of impacted session minutes in the current interval divided by the number of impacted sessions.
The benchmark value from the previous month displays when the filter is set to a supported cohort, such as country and device. This benchmark value enables the comparison of the percentage of your streams that met the SPI KPI settings with those of the 95th percentile of the cohort. A significant difference, for example 6.7% ( 94.4 - 87.7) indicates the percentage of your streams to target for performance improvements.
When significant engagement differences occur in stream playing time due to performance impacts, the streams tab also displays the average playing time of impacted and non-impacted streams.
Use the default threshold settings or adjust the settings for customized streaming activity and performance analysis, such as zero CIRR, low rebuffering, and high average bitrate levels. Click Edit in the kebab icon to update the KPI settings.

Screen Size
| Large Screen | Medium Screen |
|---|---|
|
|
Use a Conviva default set of criteria for comparison with other OTT streams based on satisfactory stream performance.
For metric definitions, see the Metric Dictionary.
|
Impacted Streams 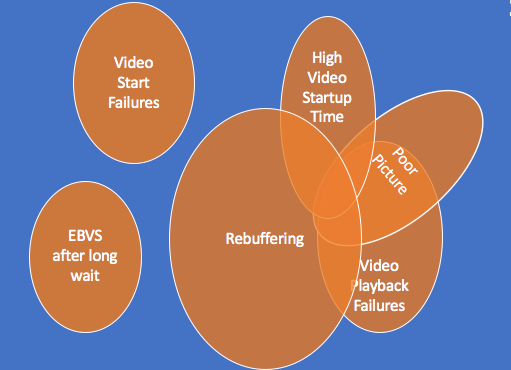
|
Improvement Opportunities
These performance measurements highlight the most common issues that impacted viewer experience in the selected period based on the SPI settings. For example, a high rebuffering ratio may indicate that better alignment of bitrate and buffer control settings could improve viewer experience.
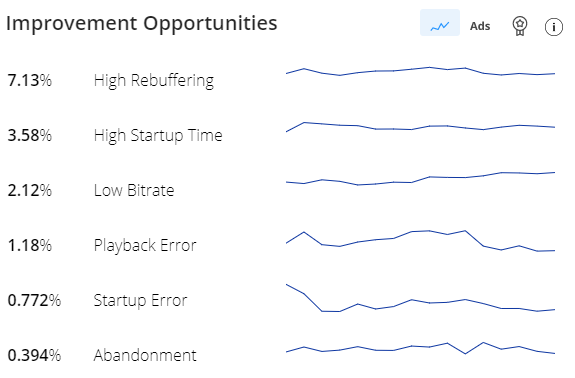
Improvement Opportunities Metrics:
High Rebuffering shows the percent of Ended Plays with a high Connection Induced Rebuffing Ratio (CIRR) or Connection Induced Rebuffering Time (CIRT).
High Startup Time shows the percent of Plays (at least 1 frame of video displayed) that took too long for the video to start.
Playback Error shows the percent of Ended Plays that ended due to a technical error (VPF-T).
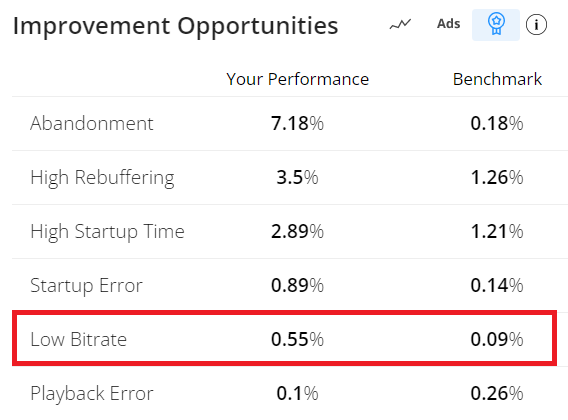
Low Bitrate shows the percent of Ended Plays that had a low bitrate, as measured against different bitrate thresholds per screen size.
Startup Error shows the percent of all play attempts that failed to start due to a technical error (VSF-T).
Abandonment shows the percent of all play attempts that did not play after the user waited a long time for the video to start, by default set as EBVS wait time < 10sec for Conviva Good and EBVS wait time < 8sec for Conviva Best.

Ads
Selecting Ads allows you to compare your overall startup and playback metrics across sessions with and without ads. Ads are broken out using sessions with and without pre-roll ads for the startup metrics, and sessions with and with mid-roll and post-roll ads for playback metrics.
Comparing sessions with and without ads requires Conviva Stream Sensor 4.x (Roku 3.x) with ad integrations.
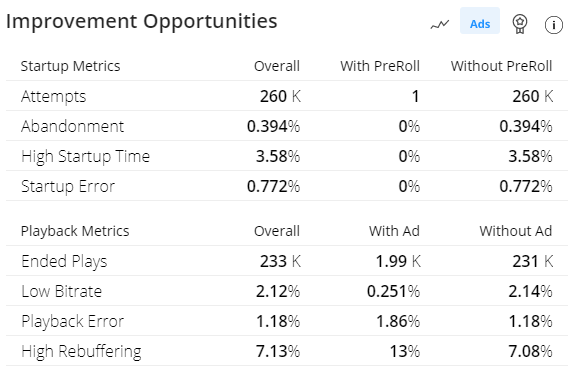
Use the Attempts and Ended Plays metrics to determine whether the level of traffic is sufficient.
Benchmark
Selecting the Benchmark icon displays your performance data and the 95th percentile performance across the selected cohort .
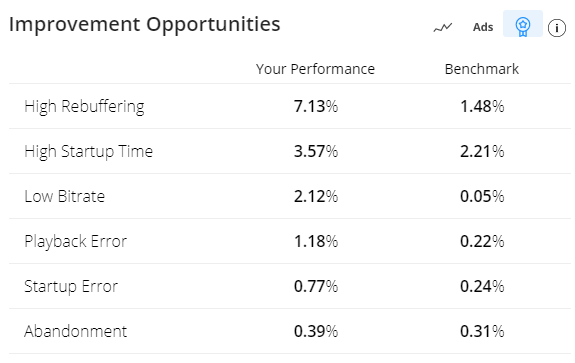
Basic Benchmark
The basic benchmark supports 3 dimensions:
Country
Device Name
Content Category
Benchmark Calculation
Conviva reports Benchmark values as the 95th percentile of the performance within the selected cohort. The 95th percentile indicates the performance which exceeded 95% of the other cohort values. For example, if there are 100 values in a cohort, Conviva ranks the values across the distribution and then selects the 95th top value as the 95th percentile. If there are 60 values in a cohort, Conviva selects the 57th top-ranked value as the 95th percentile. It's common that different publishers within the cohort excel at different performance levels.
Benchmarks show the performance levels from the previous month and are updated on the 5th of each month.
Advance Benchmark
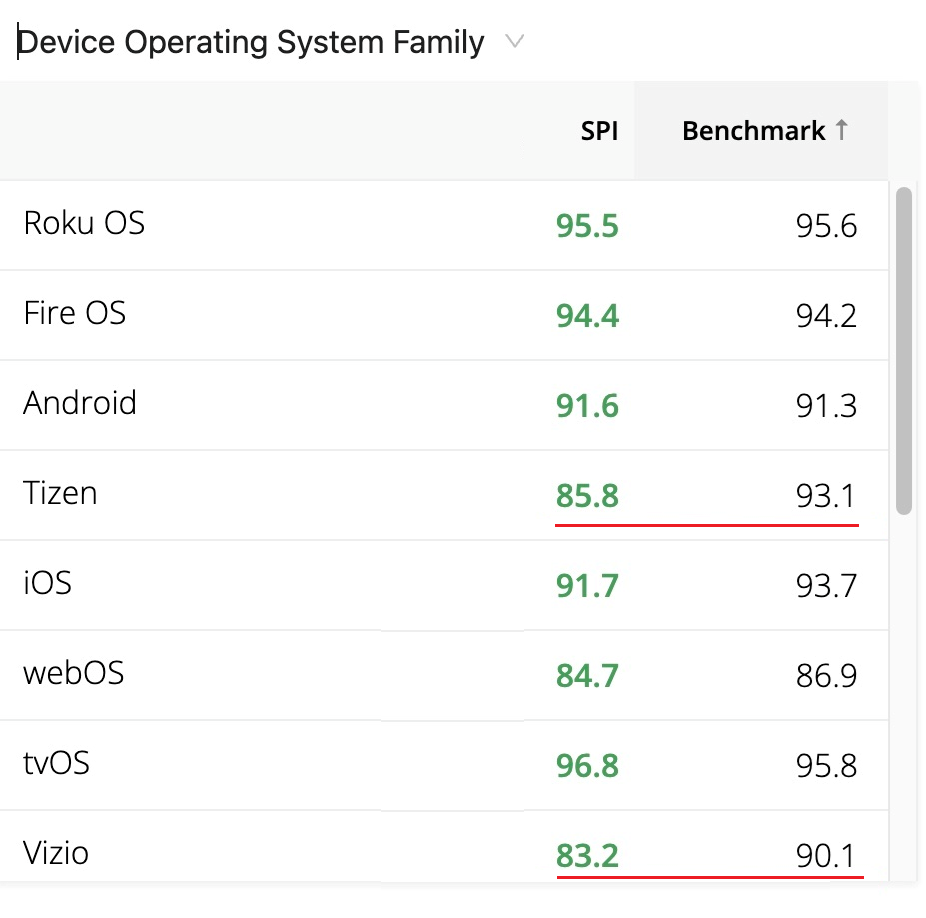
Enhances the benchmark from three dimensions to 16 dimensions (marked with benchmark icon (*) starting with Country level and followed by the combination of the other dimensions (provided they meet the minimum traffic thresholds and sanitization rule). If a Benchmark combination does not satisfy the criteria, the dimension reading displays NA. The supported dimensions include:
Geo Related: Country (Required first benchmark), State, DMA (US), City
Device Related: Device Name, Device Hardware Type, Device Marketing Name, Device Operating System, Device Operating System Family, Device Operating System Version, Browser Name, Browser Version
Content: Content Category
Connectivity: ASN, ISP, Connection Type
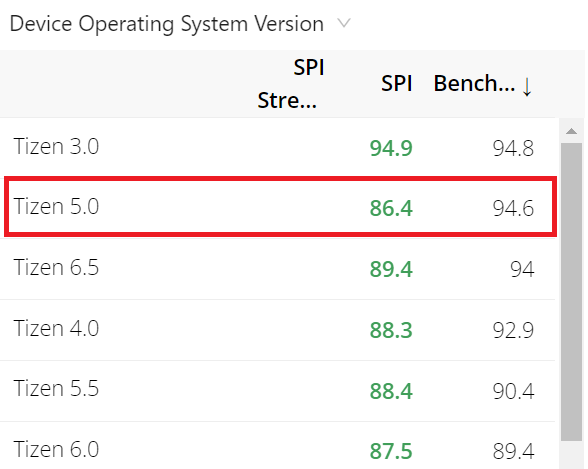
For example, the iPadOS and windows of Device Operating System Family are under performing the Industry Benchmark. Further drill down to Tizen 5.0 Device Operating System Version to see the Top Improvement Opportunity is Low Bitrate.
Dimensional Analysis
Select dimensions to analyze your streaming performance across your most critical dimensions, such browsers, devices, and traffic categories. By default, dimensions are sorted by the number of streams and your SPI. You can also sort the dimension entries by clicking an Improvement Opportunities, such as High Rebuffering, as well as Plays and Concurrent Plays.
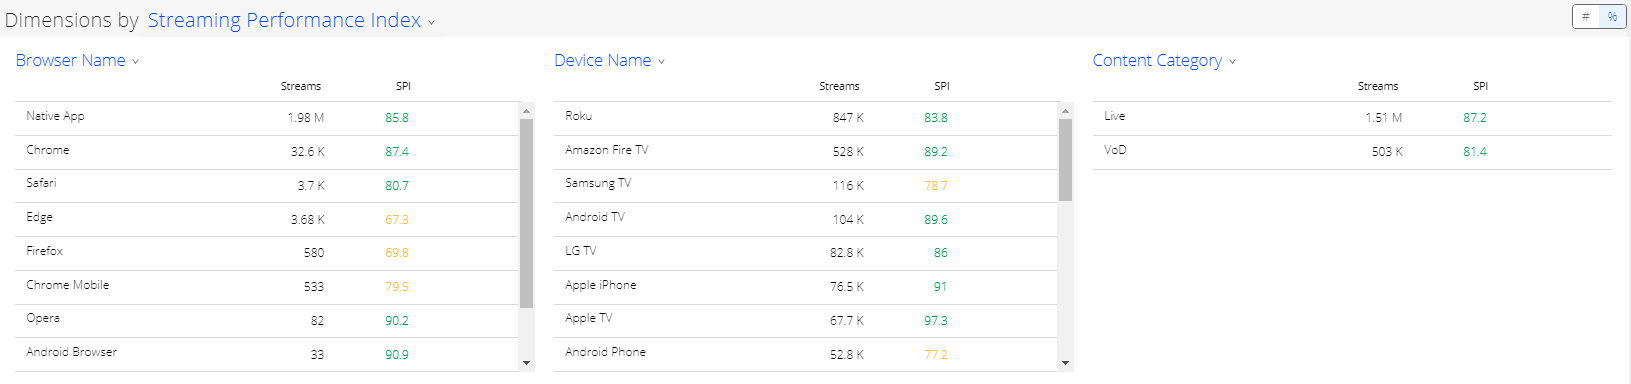
Click dimensional entries to create logical AND filters, such as Live in Content Category and Chrome in Browser Name to analyze Chrome Live traffic across the Cities dimension.

The Filter box displays the current filter settings.

Click a measure in the Improvement Opportunities widget to toggle the sort order by that measurement. In this example, the SPI performance highlights the Roku player and viewers in Arizona as under-performing due to high rebuffering during the selected period.
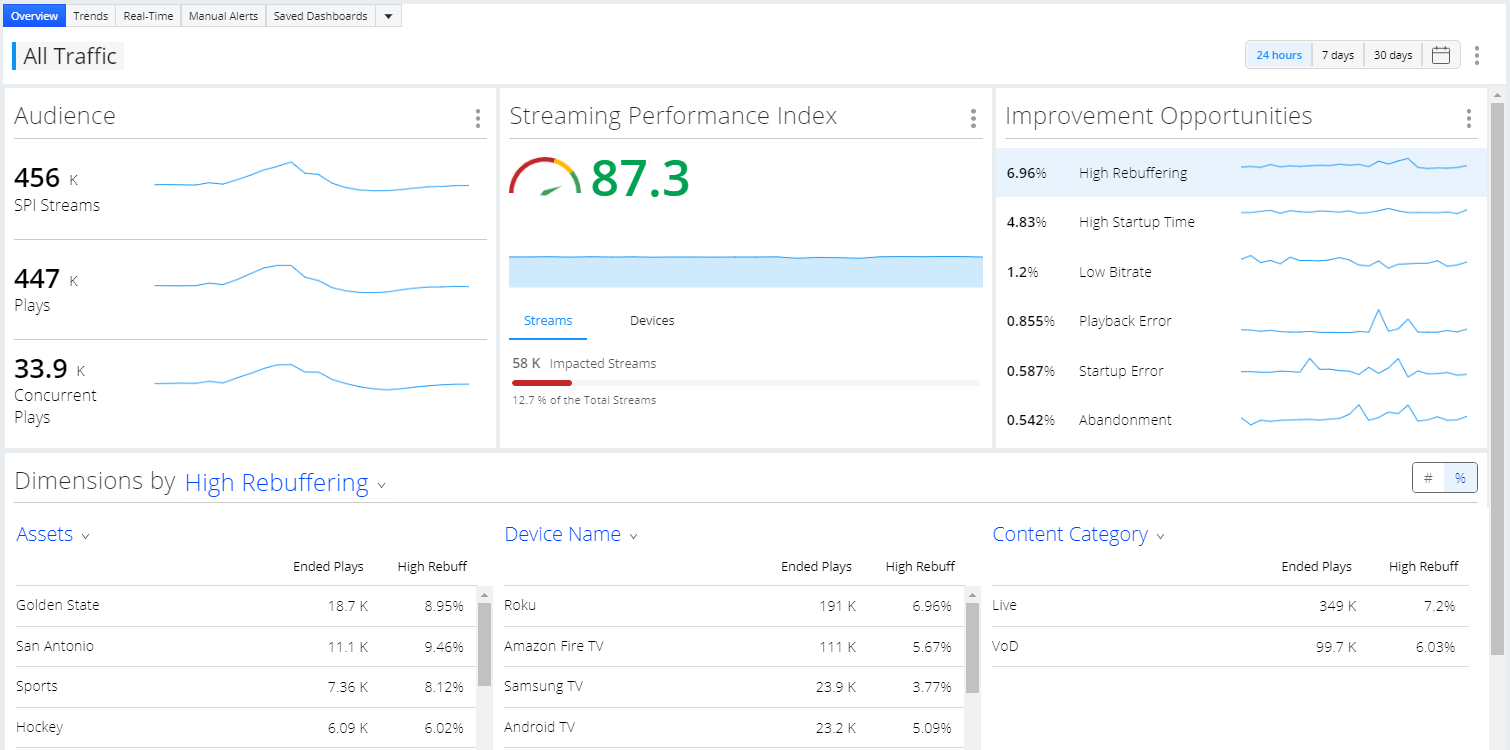
Based the Experience Overview highlights, use the Trends page for more detailed drill-downs or the Real-Time dashboard to set and monitor real-time session performance by key KPI thresholds.
SPI Diagnostics
The Improvement Opportunities in the Summary Panel enable you to quickly create single-click filters, instantly refreshing the diagnostic metric widget and dimension data, and setting up dimensions for more detailed anomaly discovery. For more information on diagnostics of the AI alerts, see SPI and Drill Down Diagnostics.