
Avg. Average bitrate is an interval metric derived from the average bandwidth field of the manifest and represents the time-weighted average bitrates played by the players. The bits played do not include bits in buffering or passed during the paused video. Typically, the higher the bitrate, the better the image quality and viewer experience.
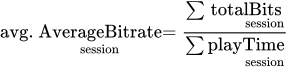
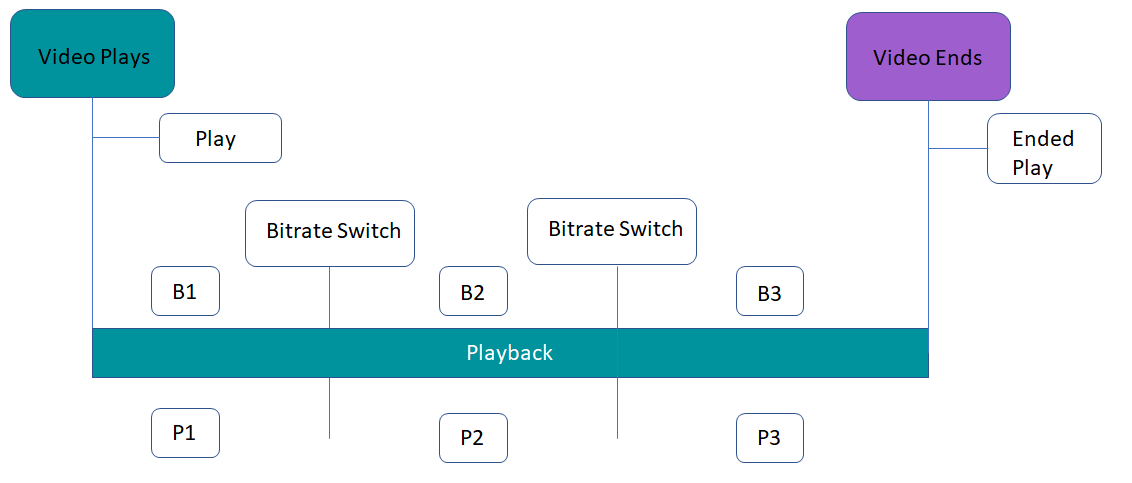
Throughout a video session, this metric tracks the bitRate (B) and playTime (P) for each bitrate switch partition within the session. A bitrate switch occurs whenever a change in the bitrate is detected. In this example, two bitrate switches divide a video session into three bitrate partitions with bitrates (B1, B2, B3) and play times (P1, P2, P3). The average bitrate for the session is the total bits per session divided by the playTime of the session.

The video player passes the encoded average bitrates used in the video session to Conviva from the player manifest file. The passed bitrates should combine playing audio and video bitrates.
Variations in player integration and bitrate availability may impact the calculation of the Average Bitrate for a session.
For aggregation, this metric shows the total bits played by all sessions in a time period divided by the total playing time of these sessions.

Avg. Average Bitrate is available in the following formats:
- Avg. Average Bitrate Summary: the average bitrate during the selected time period.
- Avg. Average Bitrate Time Series: a time series for the selected time period, where each point is the average bitrate during that specific interval.
Avg. Average Bitrate also appears as a metric in Trends. For more details, see Trends.
Note: If the manifest does not define the average bitrate or the player does not collect and send the average bitrate in the Conviva heartbeat, Avg. Average Bitrate is reported as zero (0). Conviva is working on sensor capabilities to enable customers to collect this metric from environments where it is not supported today.
Distributions
- Ended Plays vs Avg. Average Bitrate Distribution (only available in Engagement and Custom dashboards): a distribution by preset buckets, where each bucket is the Avg. Average Bitrate (Mbps) that occurred for the respective number of ended plays. This distribution can help you understand your audience's tolerance for lower bitrates and illustrates the actual impact of any bitrate outliers on the number of ended plays.
- Play Duration vs Avg. Average Bitrate Distribution (only available in Engagement and Custom dashboards): a distribution by preset buckets, where each bucket is the average bitrate that occurred for the respective play durations. This distribution can help you understand your audience's tolerance for bitrate performance and illustrates the actual impact of any bitrate outliers on play durations.
You can use metric filtering to diagnose only the sessions that had high percentage of dropped frames. For more details on metric filters, see Metric filtering.
Related Support
|
Metric Details |
Description |
|---|---|
| Dashboards and Metric Presentation |
|
| Dimensions | Use MetricLens dimensions to filter this metric by metadata segments for enhanced root cause analysis. For example, limiting data to specific ISP and player dimensions can narrow the root cause of lower bitrates to a known provider and player type. |
| Diagnostics |
The Diagnostics page presents detailed information about the Avg. Average Bitrate in the Analysis window. For more information about diagnosis with this metric, see Diagnostics. |
| Manual Alert Support |
No. |
| AI Alert Support | No. |
| Metric Adjustment |
None. |
For more metric definitions, see the Metric Dictionary.