
Note: This metric applies to only VOD streams.
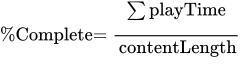
For metric aggregation, this metric shows the Average % Complete aggregated across the intervals of the selected time period.
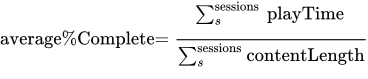
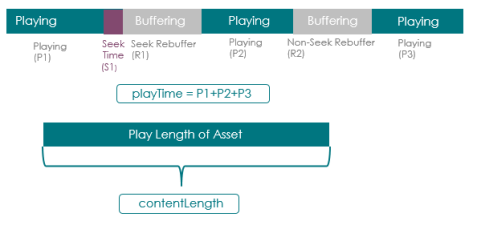
The Average % Complete metric is the total playTime for all sessions divided by expected play length of the content assets (contentLength) for the selected period. Average % Complete is not available for real-time sessions and returns a value of -1.0% in Session Details and Viewer Module when content length is not available. In order for this metric to be computed, player metadata must be configured to report contentLength to Conviva.
Average % Complete is an 'ended' type metric that is calculated only on sessions that have successful playback. Therefore, sessions with EBVS or VSF (playtime = 0) are not factored into the calculation of this metric. This metric is available in the following formats:
- Average % Complete: the average % Complete during the selected time period.
- Average % Complete Summary: the average % Complete during the selected time period for the selected dimension.
- Average % Complete Time Series: a time series for the selected time period, where each point is the % Complete during that specific interval.
Average % Complete Distribution
Available in Trends dashboard, this distribution displays buckets with the number of plays that had % Complete within the defined range. This distribution can help you to understand the impact of % Completes and illustrates the number of plays with the highest and lowest % Complete.
You can use metric filtering to diagnose only the sessions that had high percentage of dropped frames. For more details on metric filters, see Metric filtering.
Related Support
|
Metric |
Description |
|---|---|
| Dashboards and Presentation |
|
| Dimensions | Use MetricLens dimensions to filter this metric by metadata segments for enhanced audience engagement analysis. For example, limiting data to specific asset and player dimensions can focus audience engagement analysis to a known provider and player type. |
| Diagnostics |
No. |
| Manual Alert Support |
No. |
| AI Alert Support | No. |
| Metric Adjustments |
None. |
For more metric definitions, see the Metric Dictionary.