
There are three cases for which a session ends: gracefully ended with/without content completion, ended due to failure (VPF), and ended to due timeout since the last received heartbeat. Session timeout is determined by Conviva heuristics.

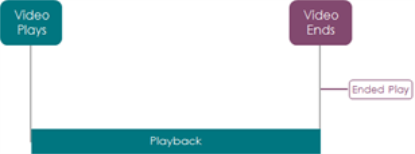
This metric shows the number of Ended Plays aggregated across the intervals of the selected time period. Ended Plays is an 'Ended' type metric is counted in the interval in which the play ends.
Ended Plays is available in the following formats:
- Ended Plays: the total number of plays that ended during the selected time period.
- Ended Plays content summary: the total number of plays that ended during the selected time period for the top content assets.
- Ended Plays time series: a time series for the selected time period, where each point is the number of ended plays during that specific interval.
Distributions
- Ended Plays vs Rebuffering Ratio Distribution (only available in Engagement and Custom dashboards): a distribution by preset buckets, where each bucket is the number of Ended Plays for a given bucket of Rebuffering Ratio. Rebuffering is on x-axis. This distribution can help you to understand your audience tolerance for rebuffering and illustrates the actual impact of any rebuffering outliers on the number of Ended Plays.
- Ended Plays vs Average Peak Bitrate Distribution (only available in Engagement and Custom dashboards): a distribution of Ended Plays across a series of predefined bitrate (in Kbps) buckets (i.e. 0-500, 500-1000,). The buckets represent different ranges of bitrate, and each bucket displays the number of Ended Plays that fall into that range. In real-time, this metric calculates plays of a specific bitrate range that ended (Ended Plays) in the last 60 seconds, ignoring sessions that are still active. For a selected period, each bucket displays the count of plays in that bitrate range that ended in that time period. This distribution can help you to understand your audience tolerance for bitrate performance and illustrates the actual impact of any bitrate outliers on the number of Ended Plays. Use this metric to understand:
- The sweet spot of bitrate values that drives engagement.
- The capability of delivery infrastructure (device, ISP, CDN) to sustain a particular bitrate configuration for the length of a viewer’s session.
- A/B test different encoding profiles for maximizing engagement across different attributes.
-
Ended Plays vs Connection Induced Rebuffering Ratio Distribution (only available in Engagement and Custom dashboards): a distribution by preset buckets, where each bucket is the Connection Induced Rebuffering Ratio (CIRR) that occurred for the respective amount of Ended Plays. This distribution can help you to understand your audience tolerance for connection induced rebuffering and illustrates the actual impact of any rebuffering outliers on the number of Ended Plays.
- The sweet spot of frame rate values that drives engagement.
- The capability of delivery infrastructure (device, ISP, CDN) to sustain a particular bitrate configuration for the length of a viewer’s session.
- A/B test different encoding profiles for maximizing engagement across different attributes.
-
Ended Plays vs Average Frame Rate Distribution (only available in Engagement and Custom dashboards): a distribution by preset buckets, where each bucket is the Average Frame Rate that occurred for the respective amount of Ended Plays. The buckets represent different ranges of the Average Frame Rate, and each bucket displays the number of Ended Plays that fall into that range. In real-time, this metric calculates plays of a specific frame rate range that ended (Ended Plays) in the last 60 seconds, ignoring sessions that are still active. For intervals, each bucket displays the count of plays in that frame rate range that ended in the selected time period. This distribution can help you to understand your audience tolerance for frame rate performance and illustrates the actual impact of any frame rate outliers on the number of Ended Plays.
You can use metric filtering to diagnose only the sessions that had high percentage of dropped frames. For more details on metric filters, see Metric filtering.
Other metrics for audience engagement of Ended Plays include Ended Plays/Unique Device and Minutes Ended Play.
Related Details
|
Metric Details |
Definition |
|---|---|
|
Dashboards and Metric Presentation |
|
|
Dimensions |
Use MetricLens dimensions to filter this metric by metadata segments for enhanced root cause analysis. For example, limiting data to specific ISP and player dimensions can narrow the root cause of higher Ended Plays to a known provider and player type. |
|
Diagnostics |
The Diagnostic page presents detailed information about the Ended Plays in the Analysis window. For more information about analysis with this metric, see . |
|
Manual Alert Support |
No. |
|
AI Alert Support |
No. |
|
Metric Adjustments |
None. |
Note: Revived sessions that play successfully also contribute to Attempts, Plays, and Ended Plays. Revived sessions do not contribute to VST, EBVS, and VSF. For more details about revived sessions, see Session Timeout/Expiration.
For more metric definitions, see the Metric Dictionary.