
Conviva's VPF metric can be displayed as a sum or a percentage of the cumulative Ended Plays that terminated with a VPF error in the selected interval.

As a percentage, VPF is the sum of the Ended Plays with VPF divided by the sum of Ended Plays in the selected time period.

You can use the VPF metric to monitor the proportion of ended plays that terminate with VPF errors. A high VPF count or percentage, or a significant increase in this metric, can be an early indication of declining overall player performance or the likelihood of increased fatal playback errors.
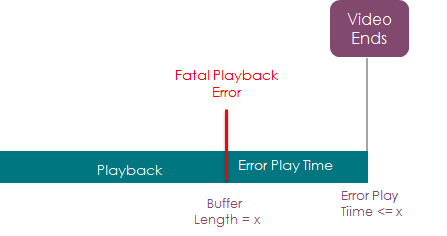
Two conditions must be met for the VPF calculation to count a session towards the VPF metric:
- A fatal error is received from the Conviva device library after playback started (after the first i-frame is rendered).
- The session ends and the total playing time from the playback error to the session end is not more than the last reported buffer length. Buffer Length is reported by device libraries. When not available, a default buffer length of 150 seconds (2.5 minutes) is used.
VPF is available in the following formats:
- Video Playback Failures summary — the number of ended plays with VPF during the selected time period.
- Video Playback Failures % time series — a time series for the selected time period, where each point is the VPF ratio for all Ended Plays during that specific interval.
Distribution
Video Playback Failures Distribution (only available in the Custom dashboard): each bucket shows the number of Plays that ended with VPF within the defined range. This distribution can help you understand the impact of VPF and illustrates the play durations when VPF occurred the most.
You can use metric filtering to diagnose only the sessions that had a high percentage of dropped frames. For more details on metric filters, see Metric filtering.
Diagnostics Widgets
The Video Playback Failures Diagnostic presents detailed information about all instances of specific error codes for the selected data point. If you choose real-time data, you see the error codes as the VPFs occur.
The drill-down widgets on the VPF Diagnostic let you see where failures are occurring by CDN/Resource and ASN, and which assets are affected most often. You can also see the extent of the impact by looking at the number of impacted requests and how that number translates to a percent of attempts.
The widgets on this page are connected. The top of the page shows Video Playback Failures on a timeline. When you select a data point, the Video Playback Failures by Error Name widget shows the error codes associated with the selected data point.
- Video Playback Failure — for a detailed definition, see the Metric Dictionary.
- Video Playback Failures by Error Name.
- Failures by CDN — for the selected error, this table shows each affected CDN, along with the total number of impacted clients and percentage of client attempts to experience an error for each.
- Failures by CDN, Asset Name — for the selected error, this table shows each affected CDN, along with the requested object and the total number of impacted clients and percentage of client attempts to experience an error for each.
- Failures by CDN, Asset Number — for the selected error, this table shows each affected CDN and its affected ASNs, along with the total number of impacted clients and percentage of client attempts to experience an error for each.
- Failures by CDN, Asset Name, Asset Number — for the selected error, this table shows each affected CDN and its top five affected ASNs, along with the asset that was requested, the total number of impacted clients and percentage of client attempts to experience an error for each.
Related Details
| Metric Details | Description |
|---|---|
| Dashboards and Metric Presentation | Trends, MetricLens, Error Analysis, Viewer Sessions, Diagnostics |
| Dimensions | Analyze this metric by specific dimensions to understand the impact and narrow the root cause analysis. For example, filtering for specific ISP and player dimensions can narrow the root cause of the VPF to a known provider and player type. |
| Diagnostics | See Diagnostics Widgets above for the VPF Diagnostic view. Also see the Diagnostics quick guide. |
| Manual Alerts | Receive alerts when VPF errors occur. For more information, see Alerts. |
| AI Alerts | No. |
| Metric Adjustments | None. Also available as Business and Technical playback failures. |
For more metric definitions, see the Metric Dictionary.