
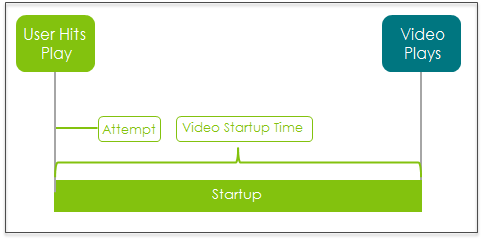
This diagram shows VST calculation for a specific play without pre-roll ads as the playStart timestamp minus the timestamp of the attempt.

With pre-roll ads, ad startup and ad playback times are not counted toward VST. If content is pre-fetched in the background while an ad is playing, this buffering is not counted toward VST because it is not perceived by the user.
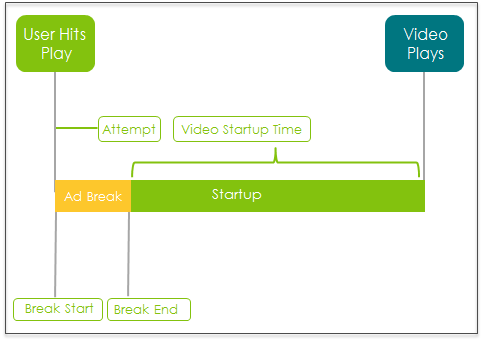

Note: The timestamps of Attempt, preRollAdStart and preRollAdEnd may depend on the specific player integration. Conviva recommends creating video sessions as close as possible to the moment the user clicks play or the video autostarts. For PreRollAdStart, Conviva recommends a call to the AdStart API as soon as the pre-roll ad break workflow starts and a call to the AdEnd API as soon as the pre-roll ad break workflow ends. Mispositioning these API calls can impact the reported startup time.
Note: If you use an Audio stream or a combination of Video and Audio streams, you can also view this metric as Stream Playback Failures (SPF). To switch the metric measurement between video and audio streams, contact your Conviva representation or Conviva Support.
As a metric, VST is aggregated and averaged across the selected interval.

This metric is presented as a summary, time series, and distribution.
- VST summary: the average VST of all the plays starting in the selected time period.
- VST time series: a time series for the selected time period, where each point is the average VST for all plays starting in that specific interval.
- VST distribution: a distribution by preset buckets from the Distribution icon, where each bucket is the number of Plays with VST in the respective VST ranges. This distribution can help you to understand your audiences' tolerance for VST and the actual impact of any VST outliers on the average VST, along with dimensional analysis .of sessions within the selected period.
Viewer Sessions VST Distribution: For up to a 3-hour data period in the time series, click the Viewer Sessions tab to display data buckets of plays distributed across startup times within the period. Clicking a data bucket, you can quickly access the Viewer Timeline and Viewers dashboards of the related sessions.
High Startup Time
High Startup Time shows the percent of Plays (at least one frame of video displayed) that took too long for the video to start.
High Startup Time is available as a Streaming Performance Index (SPI) threshold setting and displayed as an Improvement Opportunity in the Overview dashboard. Clicking this Improvement Opportunity in the Overview dashboard sorts the dimensional analysis by startup performance. High Startup Time (HST) also appears as a metric in Trends and other dashboards.
For more details, see Overview Dashboard.
For the full SPI framework, threshold settings (Good, Best, Custom), and how High Startup Time fits alongside the other Improvement Opportunities, see the SPI Introduction.
High Startup Time can also be configured as an AI Alert through KPI-based Metrics (Beta).
Note: If you use an Audio stream or a combination of Video and Audio streams, you can also view this metric as Stream Start Time (SST). To switch the metric measurement between video and audio streams, contact your Conviva representation or Conviva Support.
Common improvements for high VST include optimizing network calls, caching, storage and video bitrates for different device screens
Detailed VST Analysis with Ads
For detailed video startup analysis with Client-Side Ad Insertion (CSAI) preroll ads, the ad sessions are created after the content session is created. VST is the time taken to load and play the first frame of video minus any pre-roll ad time. As a result, VST does not includes the AST or ad duration for CSAI ads.
Note: EBVS does include viewer exits during CSAI ad prerolls.
For detailed video startup analysis with Server-Side Ad Insertion (SSAI), the ads and content are stitched into a single stream and pre-roll ads start after startup completes and as a result does not include AST or SSAI ad duration. With SSAI ads, AST is typically very short and does not impact viewer experience.
Related Details
|
Metric |
Description |
|---|---|
|
Dashboards and Metric Presentation |
Note: Drill downs on the VST metric in the distribution view show only sessions that started during the selected timeframe. This restriction focuses on video startup performance for only sessions that began within this interval. |
| Dimensions | Use MetricLens dimensions to group this metric by metadata segments for enhanced root cause analysis. For example, grouping data for specific ISP and player dimensions can create month-over-month comparisons of VST between provider and player types. |
| Diagnostics | Analyze this metric by specific dimensions to understand the impact across multiple dimensions. For example, focusing the data on specific dimensions, such as operating system and city, can narrow the root cause of increased VST to a known location and operating system. For more information, see Diagnostics. |
| Manual Alert Support |
Yes. Configure alerts to receive proactive notification when VST issues occur. For more information, see Alerts. |
| AI Alert Support | Yes. AI Alerts offer proactive anomaly detection and instant alerting to help shorten time to resolution. Both Video Startup Time and High Startup Time are supported for AI Alerts — High Startup Time through KPI-based Metrics (Beta). For more details about AI Alerts support, see AI Alerts. |
| Metric Adjustments |
Conviva caps VST at 600 seconds for each video play to restrict the impact of extended startup times. To avoid artificial increases in VST when the detection of play start is delayed or unreliable, Conviva excludes from VST calculations any plays that experience a gap or loss of heartbeat during video startup. If the reading is not captured or not available on the system, the UI shows the value as -3, which indicates that the startup time value is not available. |
Note: Revived sessions that play successfully also contribute to Attempts, Plays, and Ended Plays. Revived sessions do not contribute to VST, EBVS, and VSF. For more details about revived sessions, see Session Timeout/Expiration.
For more metric definitions, see the Metric Dictionary.