
On the Diagnostics page, the metric time series provides minute-level granularity; for example the Rebuffering Ratio time series shows data points that represent the average rebuffering ratio value for each minute in the selected time period.
With distributions, Video users can also easily uncover a deeper understanding of the per session breakdown of the significance of each metric. The session breakdowns or distributions illustrate the significance of streaming session impacts on the overall metric value to help you determine if the metric value reflects consistent session behavior or session variance caused by outliers. You can also click individual data buckets in the distributions to expand the data range for more detailed analysis and granularity.
Distribution metrics are available for custom time periods, so your analysis of metric distributions can focus on an entire video streaming event, such as a live football match, or specific video stream intervals that contained metric anomalies.
Along with the session breakdowns, QoE metric distributions also provide insights into the correlation of audience tolerance for QoE metric degradation, for example which rebuffering levels lead to session abandonment. Correlating QoE metric performance with viewer engagement enables video publishers to set KPIs directly tied to business objectives.
| Metric Time Series | Supported Engagement Distribution |
|---|---|
|
Video Start Time 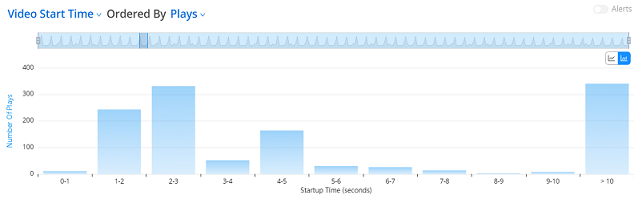
|
Plays distributed over Video Start Time Intervals (seconds) Plays include both active and ended plays in the interval. |
|
Video Restart Time 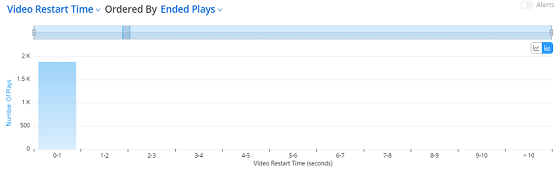
|
Plays distributed over Video Restart Time Intervals (seconds) Plays include both active and ended plays in the interval. |
|
Video Playback Failures**VPF, VPF-B, VPF-T 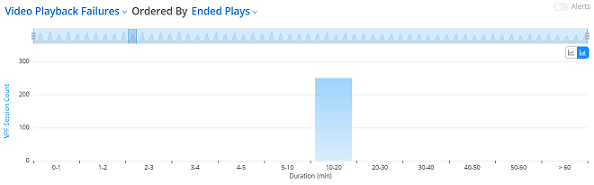
|
VPF session counts distributed over play durations (min). |
|
Rebuffering Ratio 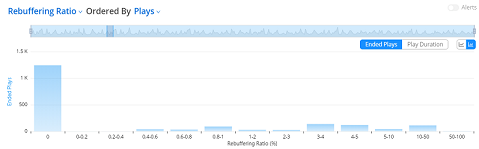
|
Ended Plays distributed over Rebuffering Ratio (%) Duration (minutes) distributed over Rebuffering Ratio (%) The duration is the average duration of all plays within the rebuffering range, including a zero rebuffering data bucket. |
|
Exits Before Video Start and Attempts 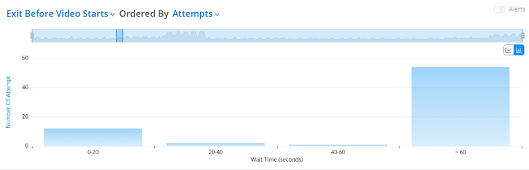
|
_Attempts_ distributed over Wait Times (seconds) |
|
Connection Induced Rebuffering Ratio 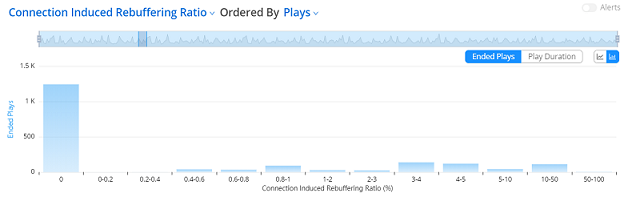
|
Ended Plays distributed over Connection Induced Rebuffering Ratio (%) Duration (minutes) distributed over Connection Induced Rebuffering Ratio (%) The duration is the average duration of all plays within the rebuffering range, including a zero rebuffering data bucket. |
|
Average Frame Rate 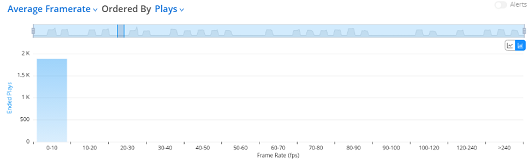
|
_Ended Plays_ distributed over *Average Frame Rate* (fps) |
|
Average Peak Bitrate 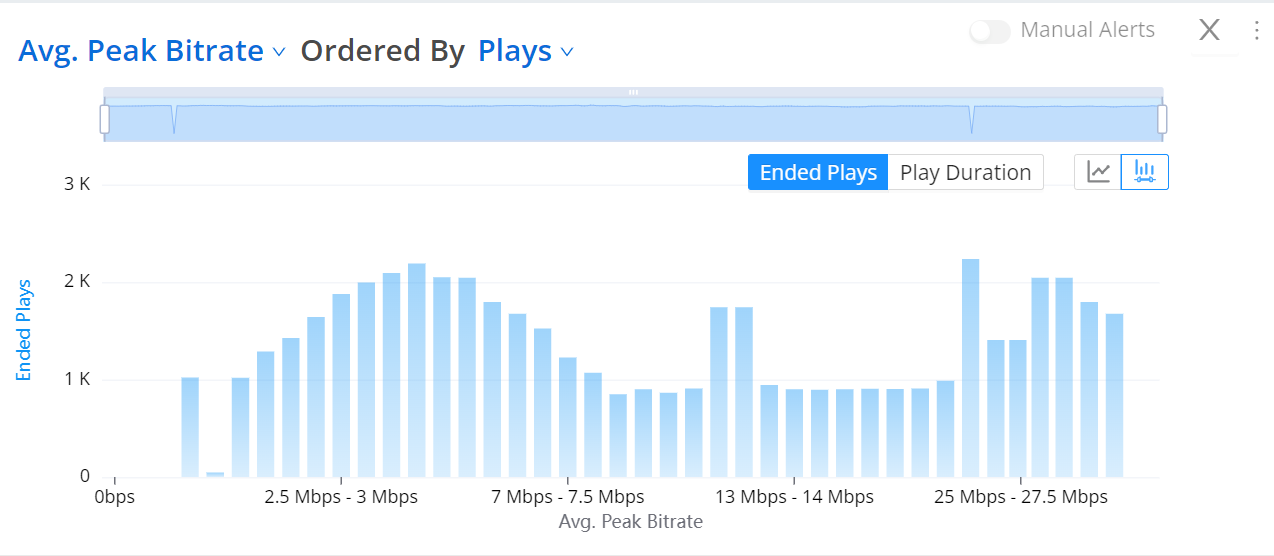
|
Ended Plays distributed over Average Peak Bitrate (kbps) Duration (minutes) distributed over Average Peak Bitrate (kbps) The duration is the average duration of all plays within the average peak bitrate. |
|
Avg. Average Bitrate 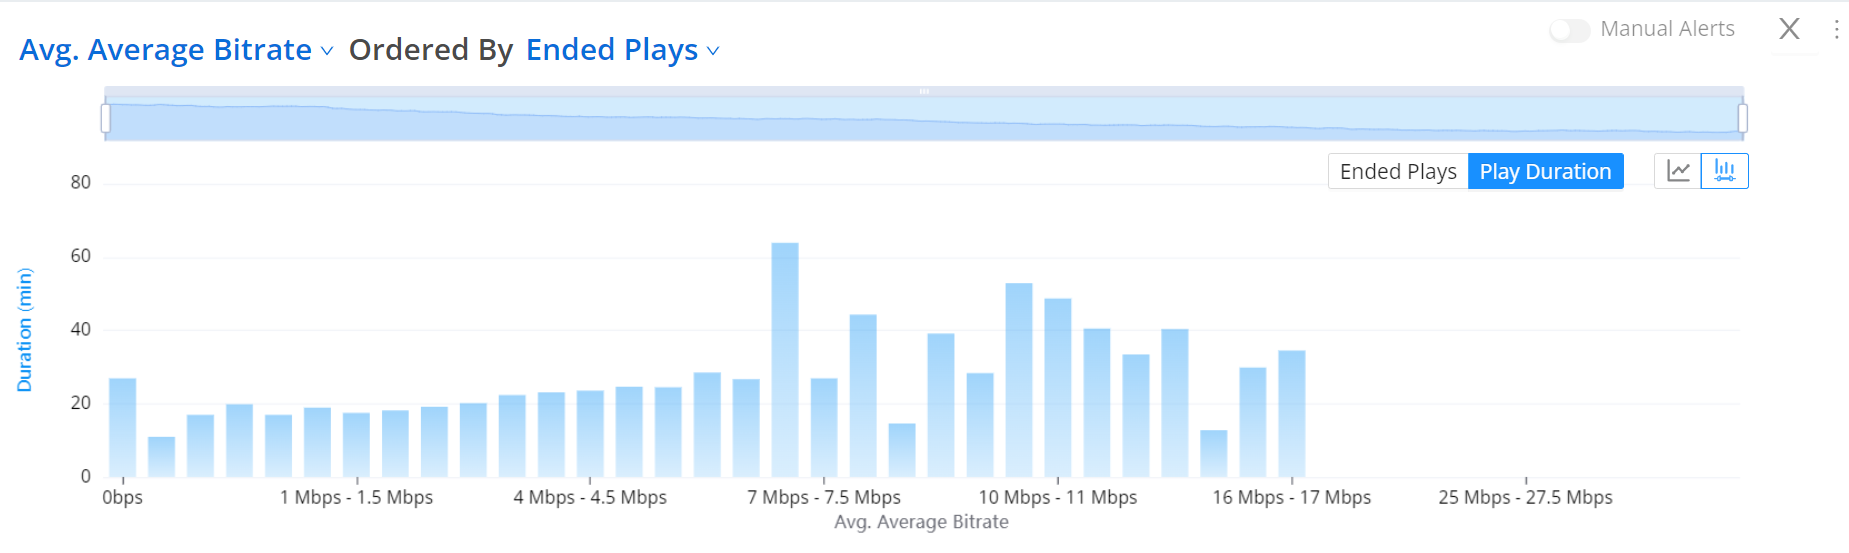
|
_Ended Plays_ distributed over *Avg. Average Bitrate* (Mbps)
Duration (minutes) distributed over Avg. Average Bitrate (Mbps) The duration is the average duration of all plays within the average bitrate. |
|
Average % Complete 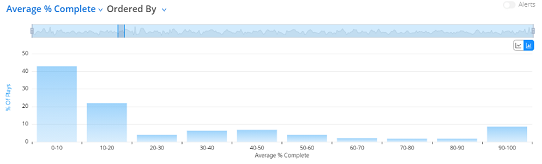
|
_% of Plays_ distributed over *Average % Complete* |
|
Paused Time 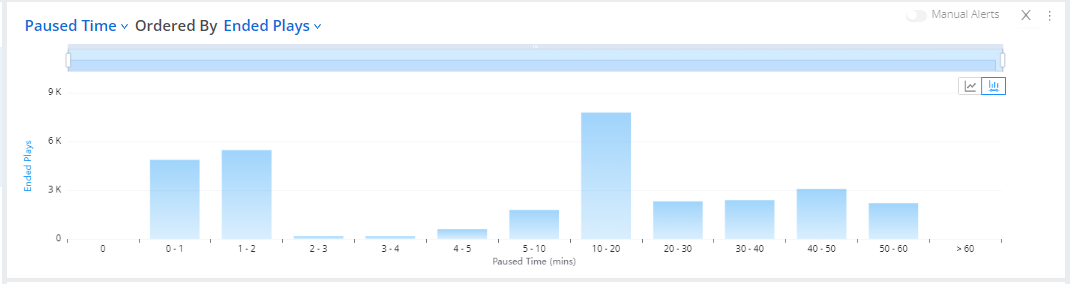
|
_Ended Plays_ distributed over *Paused Time* |
|
Starting Bitrate 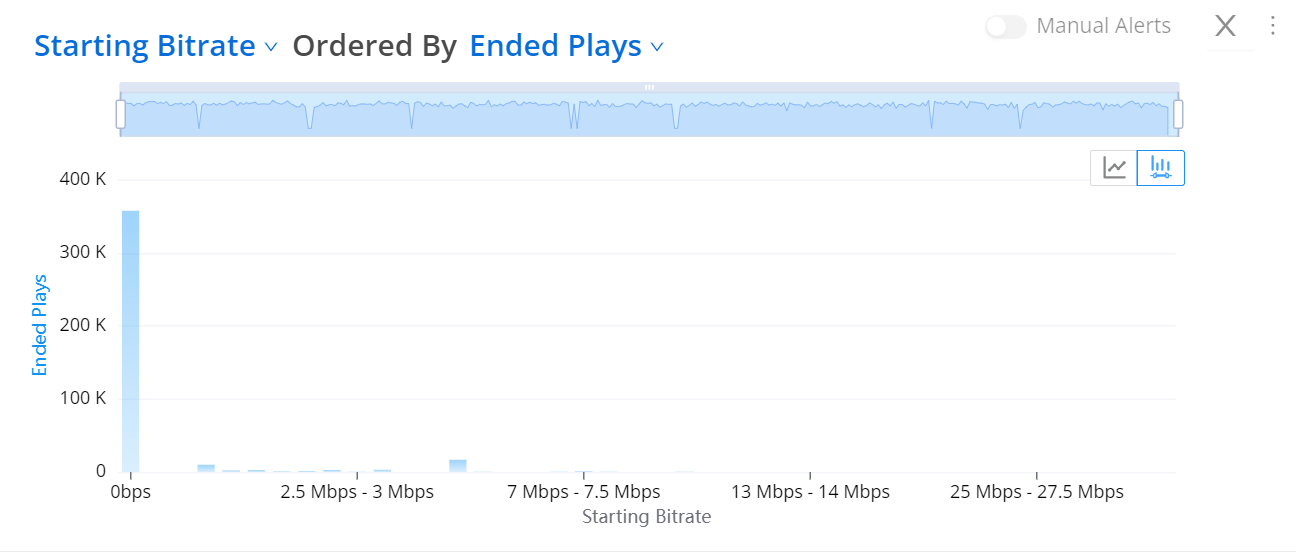
|
_Ended Plays_ distributed over *Starting Bitrate* |
|
Bitrate Switches 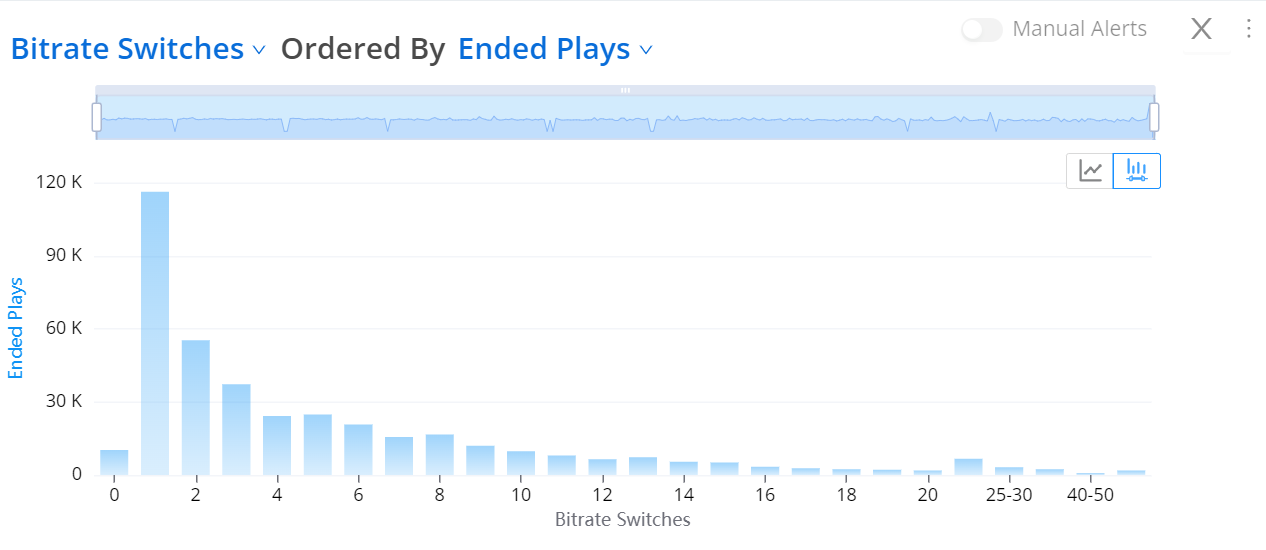
|
_Ended Plays_ distributed over *Bitrate Switches* |
|
CIR Related Exits 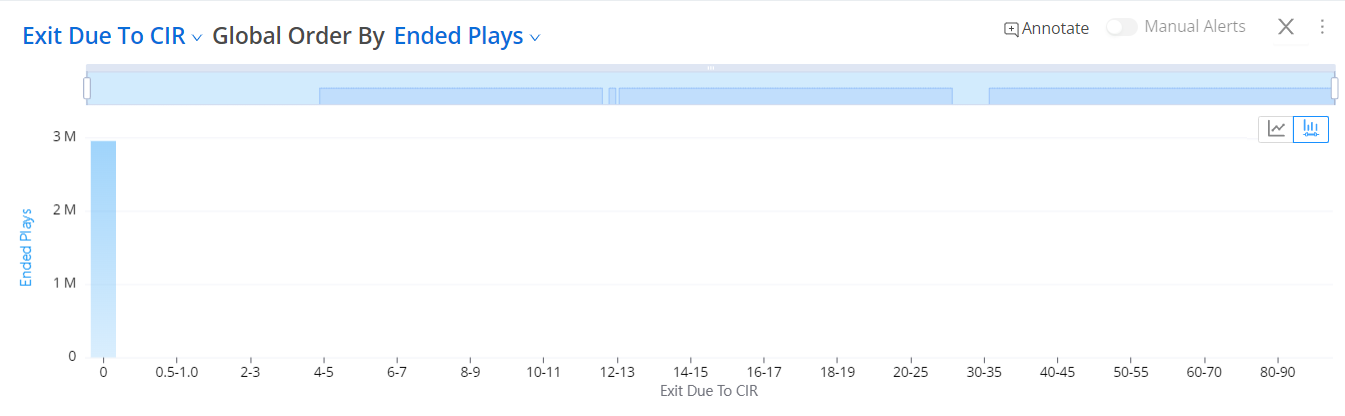
|
_Ended Plays_ distributed over *CIR Related Exits* |
For detailed explanations of the metric definitions, see the Metric Dictionary.
To access engagement time series and distributions:
In the Trend view, click the Diagnostic icon in the metric time series to access Diagnostics for that metric. In the Diagnostic time series, the time series and distribution icon ( ) appears under the birds eye time selector so you can easily toggle between the display options.
In a time series, drag the bird-eye selector above the chart or drag a specific time range to focus your analysis on specific impacts, such as metric spikes and anomalies.
Also, select specific dimensions and dimension values to further drill-down to detailed analysis and impact correlation.
To analyze the impacted viewer sessions, see Viewer Sessions.