
Conviva Digital Product Insights (DPI) sensor data ingest applies a lightweight integration to your application platforms, enabling automatic, semantic-less data collection across different data sources and formats, with heavy computation done on the server-side.
Automatically collect system level events (clicks, network requests, crashes, errors, video player events, device and OS metadata, etc.)
With semantic-less collection, send all custom events with a single integration without having to reformat events to map to a pre-defined schema
Ingest data across all application platforms (Web, mobile, tablet, TV, STB, AR/VR, smart speaker, car, etc.)
Go to Conviva GitHub repositories with basic README instructions or leverage the UI integration tool for guided data ingest.
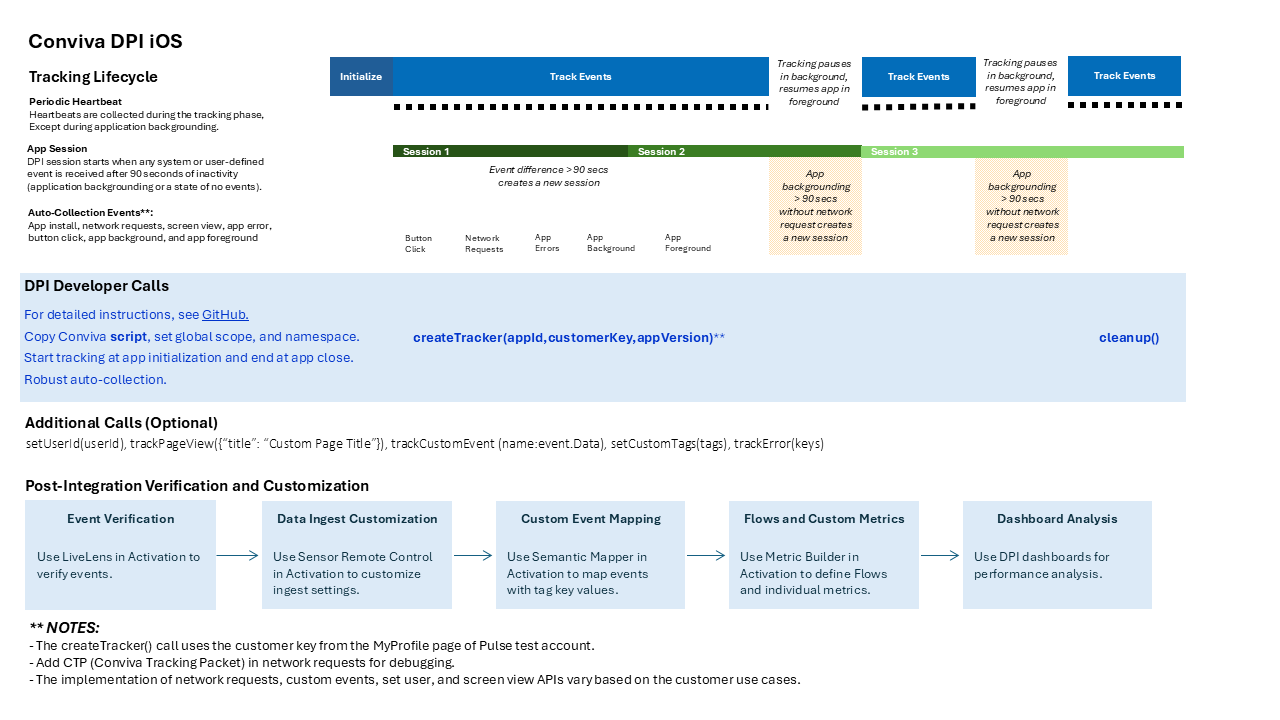
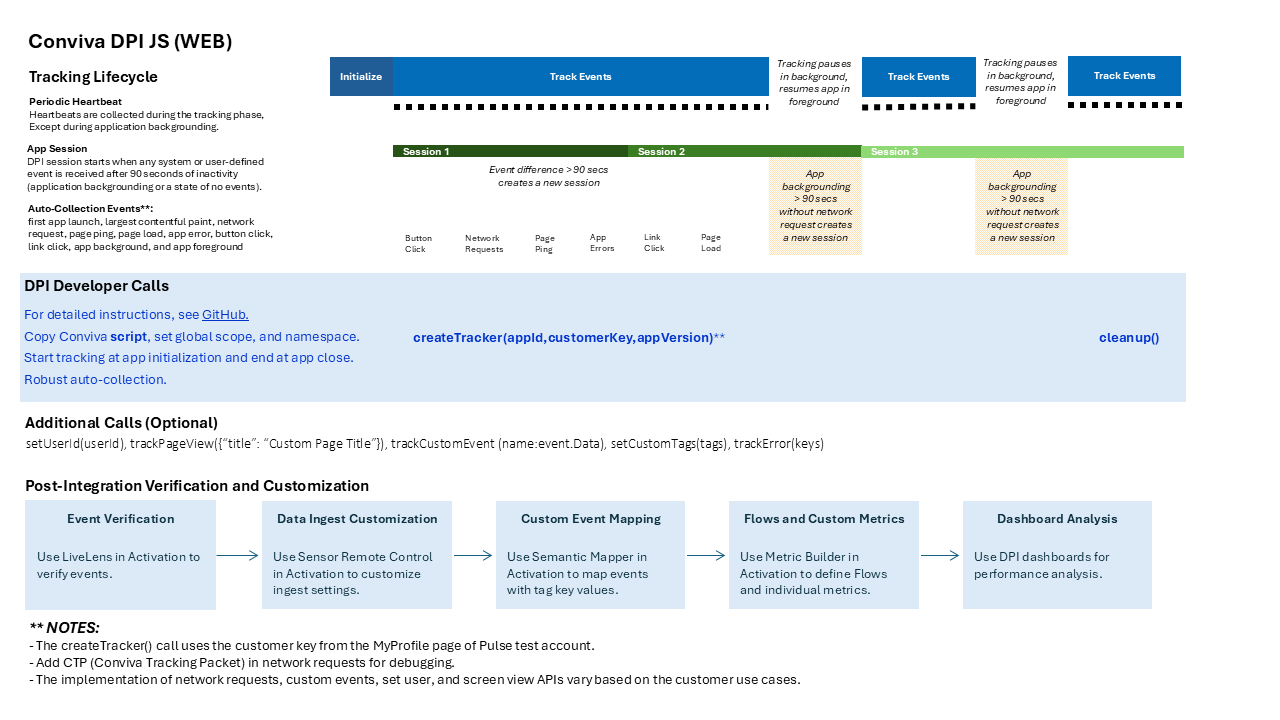
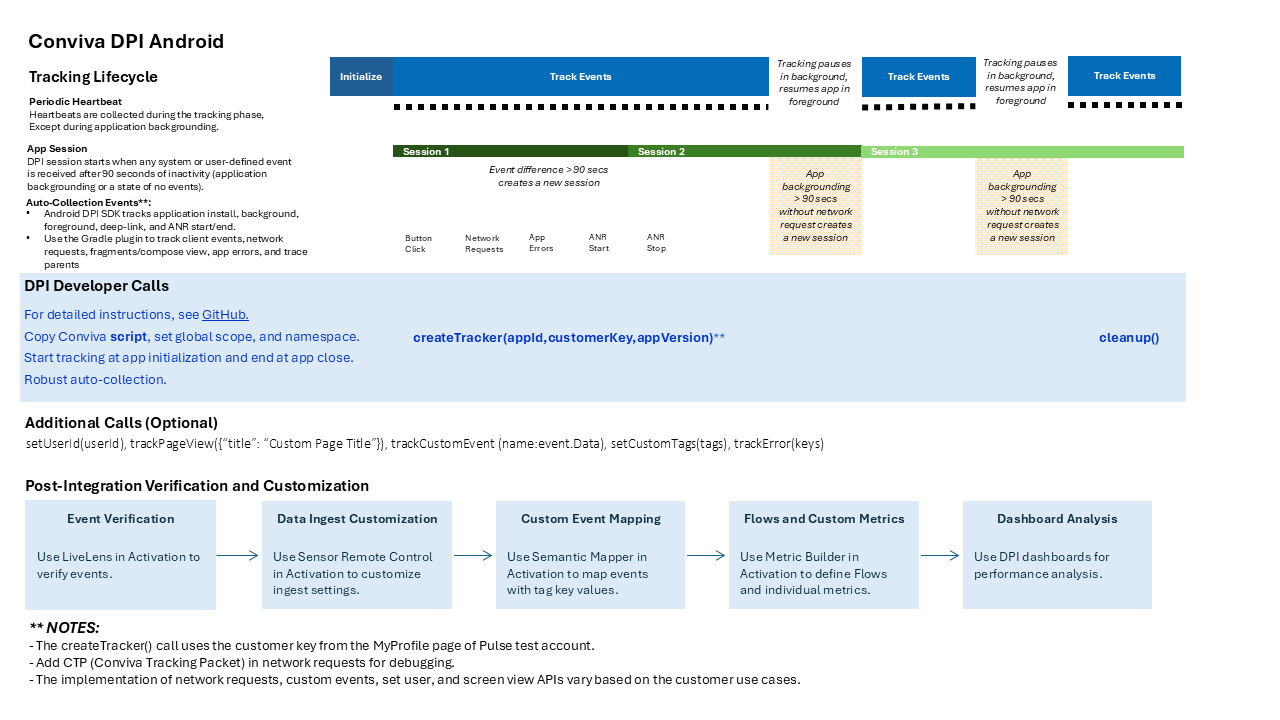
Browse the DPI Integration FAQs, view the platform summary diagrams, watch this integration video.
iOS
Web JS
Android
Latest Releases in Sensors
iOS version 1.10.2 (April 2026)
Minor improvements.
More Details:
iOS Sensor Integration Help
JavaScript version 2.0.2 (April 2026)
Fixed issue where cohort replay recording status was not set due to race condition.
More Details:
JavaScript Sensor Integration Help
Android version 1.3.2 (April 2026)
Enhances
conviva_clickevent withelementParentto include the hosting Fragment or Activity name, enabling identification of the screen associated with the clicked element.Fixes event batching on Android 9 and its earlier versions by replacing the SQLite window function used for cumulative event size calculation with a Java-side equivalent.
More Details:
Android Sensor Integration Help
For more details about these updates and other DPI platform updates, see What's New in DPI.
DPI Data Ingest Using GitHub
With GitHub downloads and access, Conviva offers script files in GitHub repositories for basic manual integration, along with an UI integration tool for guide data ingest.
DPI sensor module consists of several basic scripts accessible from the Conviva GitHub Repositories with basic README instructions and the related script files for each the supported DPI application platforms. Lightweight integration of Conviva DPI sensor enables automatic, semantic-less data collection.
Android
iOS
Browser (npm install)
Browser (script tag install)
React Native (npm install)
Roku
C
Flutter
To get started with app data ingest:
- Decide on your target DPI platforms and check the Conviva GitHub repositories for scripts and instructions.
Supported application frameworks include:
- Native Modules
-
Conviva Android Module
Conviva iOS/tvOS Module
Browser based Modules
-
Conviva JS-SDK module (for apps with source code/npm install availability )
Conviva JS-SDK (for apps with React based frameworks with source code availability)
Conviva JS-SDK (for apps with Mobile Web-only option with source code availability)
Conviva JS-SDK (Angular, for apps with source code availability)
Conviva JS-SDK (Typescript based, for apps with source code availability)
Conviva JS-SDK script tag (for apps without source code availability)
Roku SceneGraph Module
C-SDK Module
- Hybrid modules
- React Native (Mixture of React Native UI, Android (Native) and iOS (Native) frameworks.
- Test and deploy your updated application, subject to your company's release process and policies.
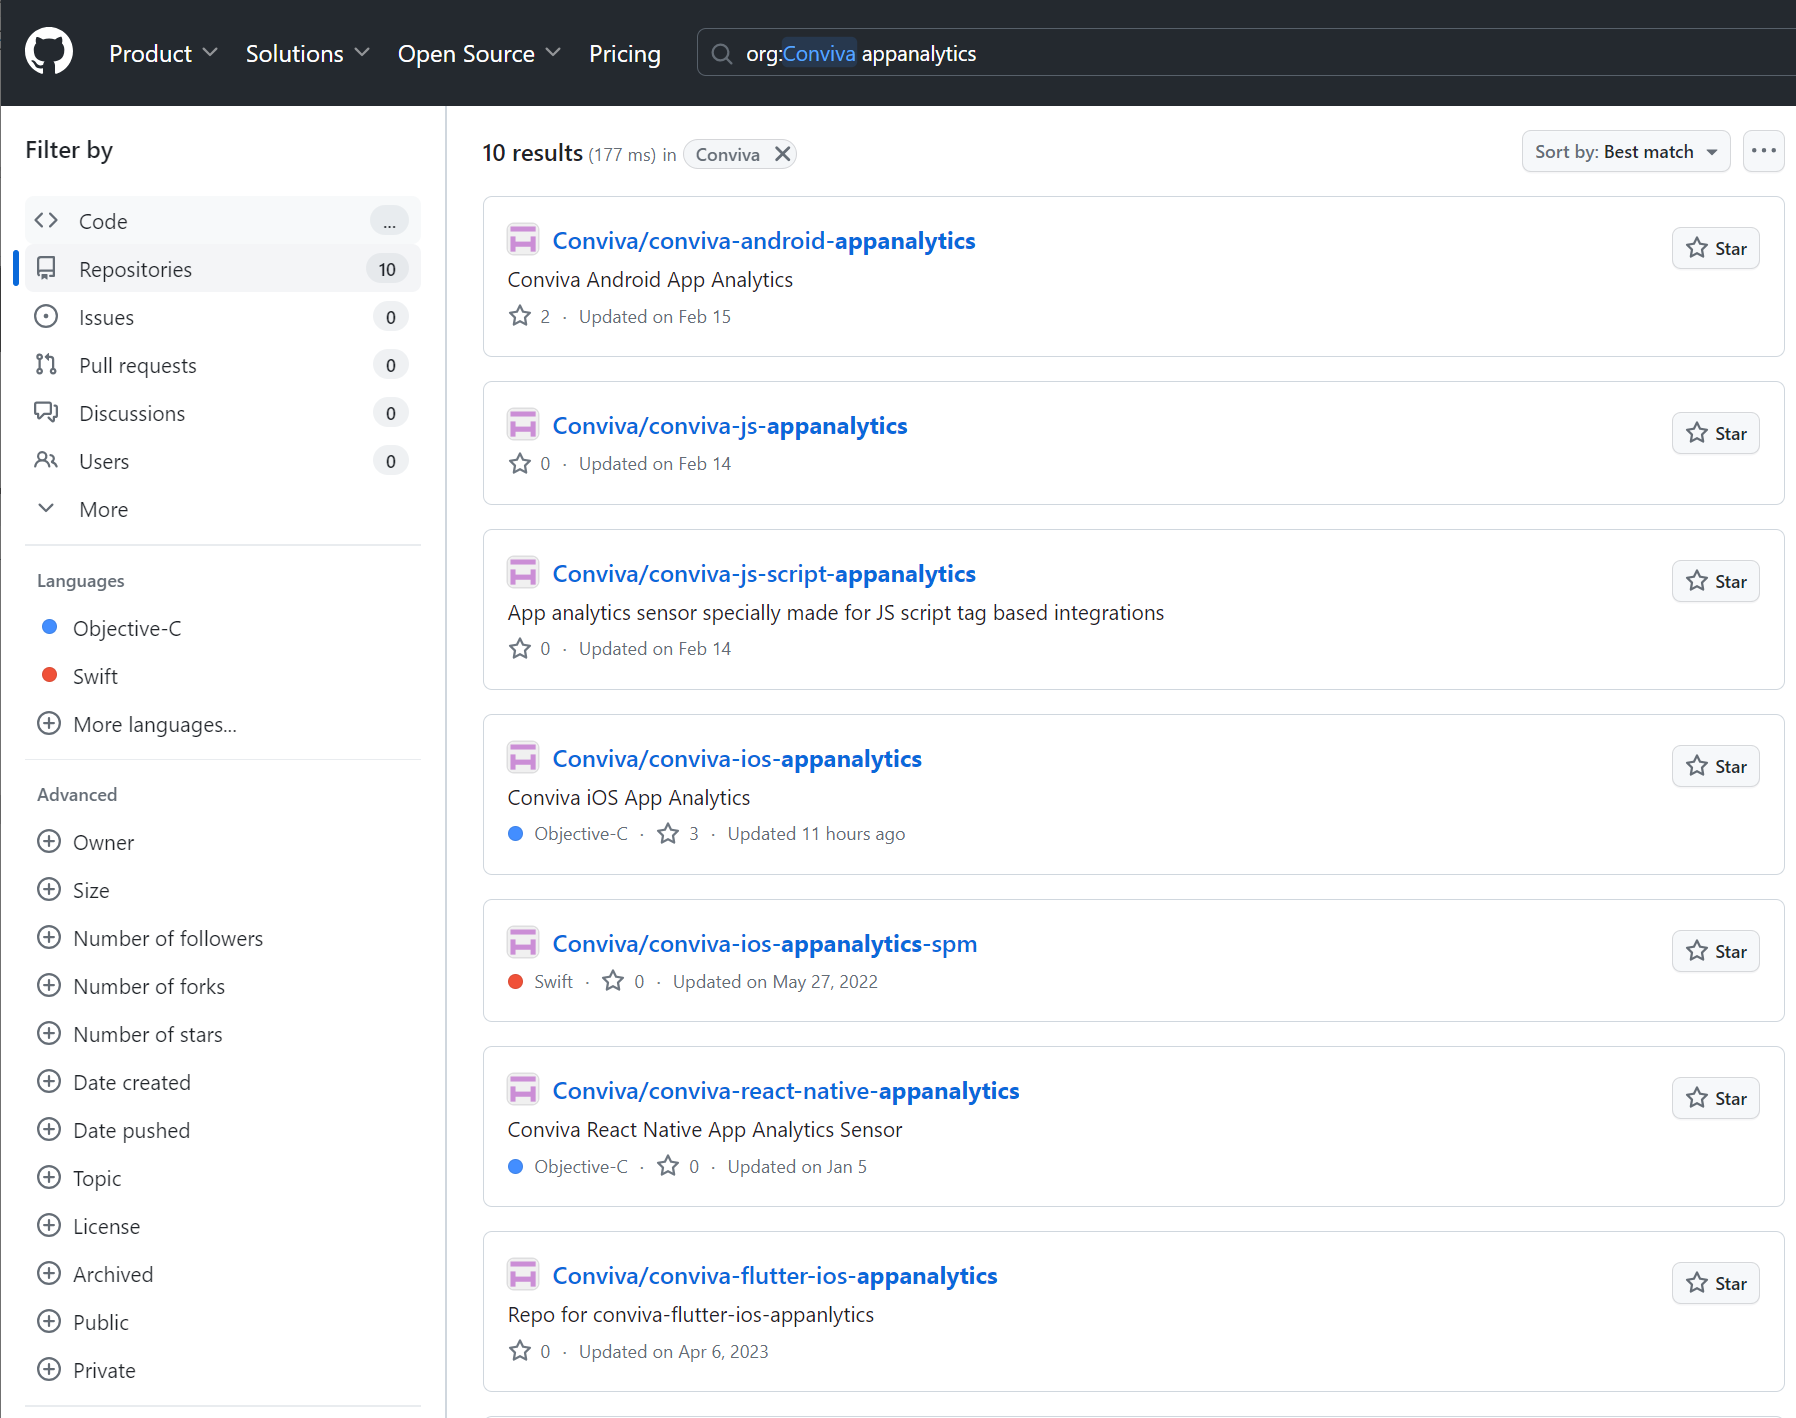
DPI Repos Example
Within each application repo, developers follow the basic README instructions and deploy the scripts.
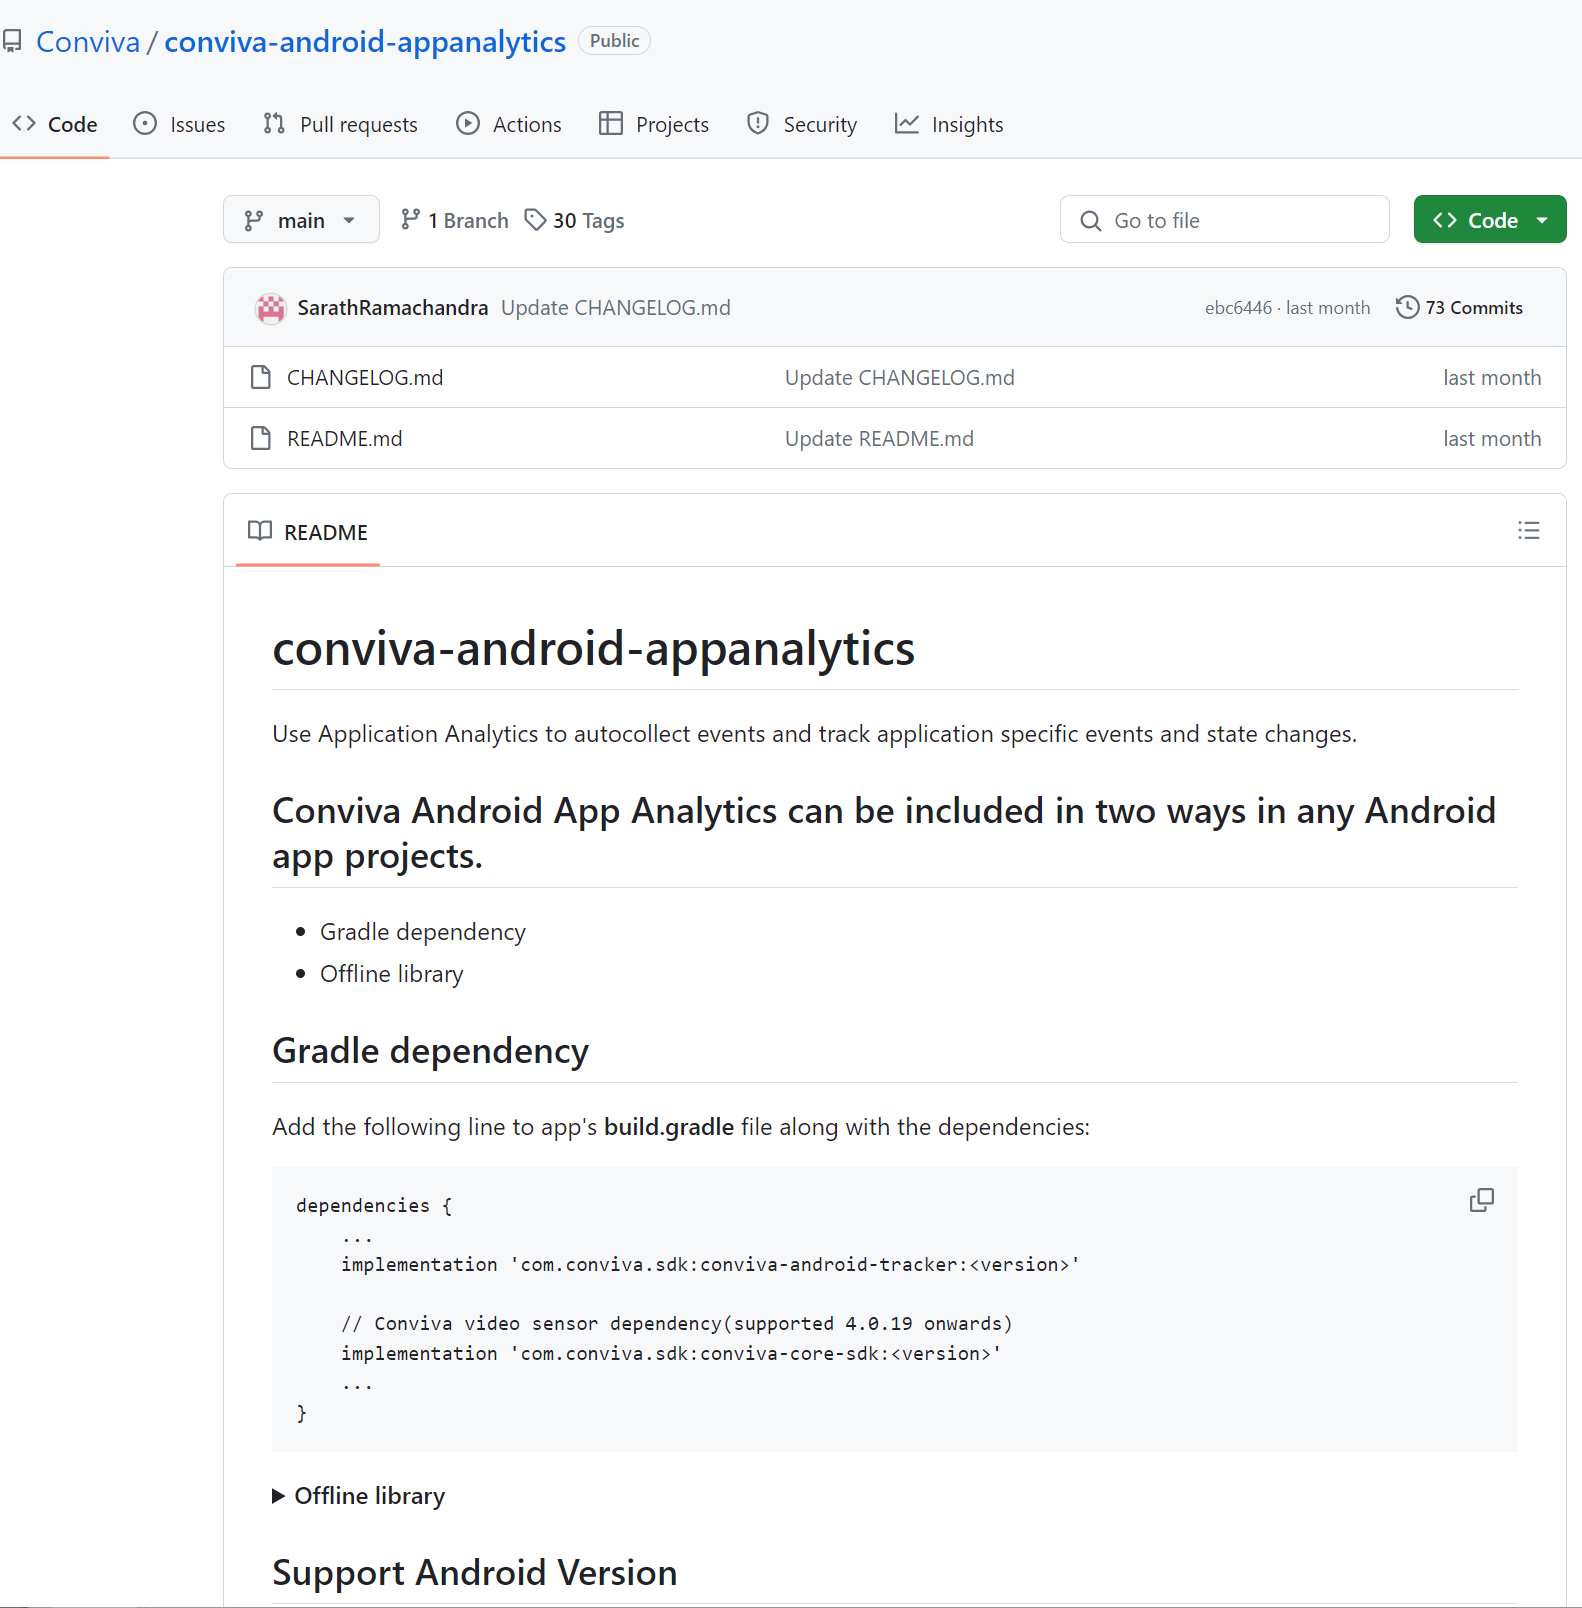
Readme Example
Conviva DPI Sensors Integration: Key Features
Conviva DPI Sensors Integration enables the following featutes for tracking useful events from the integrated application:
Network Requests
Network request tracking allows for the monitoring and collection of network requests triggered within an application using XMLHttpRequest, along with the API response data. This includes capturing both the header and body information of requests and responses, provided certain conditions are met. This feature ensures secure and efficient tracking of network activity while adhering to privacy and performance guidelines.
- Conviva DPI sensor for the Android platform supports OKHTTP3 execute/enqueue, OKHTTP3 retrofit execute/enqueue, and HTTPURLConnection/HTTPSURLconnections.
-
Collects the request/response Body if:
-
The size is less than 10KB and the content-length is available.
The response body is in JSON format.
The content-type is one of: "json", "text/plain", "text/javascript", or "application/javascript".
The response type is not "opaque".
-
Collects the request/response Header if:
The server includes the header "Access-Control-Expose-Headers:" in the response.
The response type is not "opaque".
-
The size is less than 10KB and the content-length is available.
- Conviva DPI sensor for the iOS platform supports NSURLSession and NSURLConnection. The sensor does not support any requests fired from WKWebView or any Playback requests using the default AVPlayer implementation (AVPlayers spawns a new process to send all playback requests).
GitHub Document for iOS.**- Conviva DPI sensors for the JS (WEB) platform supports XMLHttpRequest and fetch. The sensor also collects network request/response headers, body, and status, if the NWR includes response types other than “opaque.”
GitHub Document for JS (Web).
Screen/Page Views
The Screen/Page View Tracking feature enables the automatic collection of information when a user interacts with a screen, either on the first launch or during subsequent relaunches of an application. This feature ensures consistent screen or page view tracking across platforms, with options for customization and manual invocation where needed.
On the Android platform, the auto-collection of screen_view and application_install events may be temporarily affected during the initial launch after a fresh app install or a data clear. This is due to controlled ingestion by Conviva and remains in effect only until the Conviva Remote Config is available. Once available, auto-collection resumes as expected in later launches.
On the iOS platform, specifically with SwiftUI, screen_view events are not auto-collected. Instead, Conviva provides extension functions that developers can use to manually trigger screen view tracking.
On the JavaScript platform, calling the trackPageView() API automatically uses document.title as the page title. Developers can override this by passing a custom title as an argument.
Tracking Revenue
Use the trackRevenueEvent() API to track purchase and revenue events in the business applicationsusing Conviva DPI SDKs for Android, iOS, and JavaScript. The purchase events are collected as conviva_revenue_event and sent to Conviva Pulse for deriving Business/Revenue Metrics.
The trackRevenueEvent() API provides three required fields to collect revenue information:
totalOrderAmount: Total order amount. It must be a finite number.transactionId: Unique order/transaction identifier (non-null, non-empty after trim). If the backend uses orderId, pass that ID.currency: Currency code, for example, "USD", "EUR" (non-null, non-empty after trim)
The API also provides optional fields to capture additional purchase-related information, such as tax amount, shipping cost, discount or coupon value, number of items in the order, payment method, payment provider, order status, purchased line items, and other metadata.
For more information, see:
Custom Events
The Custom Event Tracking feature allows customers to define and track in-app events that are important to their business goals. These events may vary across the business vericals and hence not pre-defined in Conviva DPI sensor. Customers need to specify such events while setting up DPI sensor integration, allowing the sensor to capture customer-specific events relevant to application’s performance and user experience.
- To enable the Custom Event Tracking feature for Android platform, use the trackCustomEvent() API to track all kinds of events. This API provides 2 fields to describe the tracked events:
-
eventName: Name of the custom event.
- eventData: Data in a JSONObject or a JSON-formatted String.
// Set up the event properties JSONObject
JSONObject eventDataJSON = new JSONObject();
eventDataJSON.put("identifier1", intValue);
eventDataJSON.put("identifier2", boolValue);
eventDataJSON.put("identifier3", "stringValue");

String eventName = "your-event-name";

tracker.trackCustomEvent(eventName, eventDataJSON);
- To enable the Custom Event Tracking feature for iOS platform, use the two APIs to track custom events:
/**
* Track custom event.
* @param name Name of the custom event.
* @param data A JSON-formatted string.
*/
- (void)trackCustomEvent:(NSString *)name data:(nonnull NSString*)data;

/**
* Track custom event.
* @param name Name of the custom event.
* @param eventData Dictionary/Array of dictionaries.
*/
- (void)trackCustomEvent:(NSString *)name eventData:(nonnull id)eventData;
- To enable the Custom Event Tracking feature for JS (WEB) platform, use trackCustomEvent() API to track all kinds of events. This API provides 2 fields to describe the tracked events:
-
name: Name of the custom event. (Mandatory)
- data: Any type of data in JSON format.
let custom_data = {
"identifier1": "test",
"identifier2": 1,
"identifier3":true
};

window.apptracker('trackCustomEvent', {
name: "custom_event_name",
data: custom_data
});
Custom Tags
Custom Tags are global tags applied to all events and persist throughout the application lifespan, or until they are cleared.
- For the Android platform:
-
Set custom tags**```javascript
// Adds the custom tags
HashMap
- Clear some custom tags
// Clears custom tags key1 & key2 Set<String> clearTagKeysSet = new HashSet<>(); clearTagKeysSet.add("key1"); clearTagKeysSet.add("key2"); tracker.clearCustomTags(clearTagKeysSet);- Clear all custom tags
// Clears all the custom tags
tracker.clearAllCustomTags();
- For the iOS platform:
-
Set custom tags
// Swift: // Adds the custom tags let tags = ["Key1": "Value1", "Key2": "Value2"] tracker?.setCustomTags(tags) -------------------------------------------------- // ObjC: // Adds the custom tags NSDictionary* tags = @{ @"Key1": @"Value1", @"Key2": @"Value2", }; [tracker setCustomTags:tags];- Clear some custom tags
// Swift: // Clears custom tags Key1, Key2 & Key3 let keys = ["Key1", "Key2", "Key3"] tracker?.clearCustomTags(keys) --------------------------------------------------- // ObjC: // Clears custom tags Key1, Key2 & Key3 NSArray* keys = @[ @"Key1", @"Key2", @"Key3" ]; [tracker clearCustomTags:keys];- Clear all custom tags
// Swift:
// Clears all the custom tags
tracker?.clearAllCustomTags()

---------------------------------------

// ObjC:
// Clears all the custom tags
[tracker clearAllCustomTags];
- For the JS (WEB) platform:
-
Set custom tags
import { setCustomTags } from '@convivainc/conviva-js-appanalytics'; let customTagsData = { tagKey1: 'tagValue1', tagKey2: 1, tagKey3: true }; setCustomTags(customTagsData);- Clear custom tags
import { unsetCustomTags } from '@convivainc/conviva-js-appanalytics';

// Remove custom tags tagKey2 & tagKey3
let customTagsData = ['tagKey2', 'tagKey3'];
unsetCustomTags(customTagsData);
Errors/App Crashes
Conviva DPI enables efficient application error analysis to troubleshoot and resolve app errors impacting user experiences and app performance.
Errors displayed in metric widget time series and dimensional drill-downs Analyze auto-collected and custom errors in metric widget time series and dimensional drill-downs, including related stack traces.
Errors in metric and flow definitions Use auto-collected and custom errors (web only, trackError()) in metric and flow definitions for advance performance analytics
Web App Errors
For Web apps, Conviva DPI auto-collects the conviva_application_error event to capture uncaught run-time application issues that don’t cause app crashes, such as JavaScript exceptions and unhandled rejections/promises. Selecting the Web Errors metric, these error events appear in the Trends Web Errors metric widget time series, along with the Error Message and Stack Trace dimensions. Analyzing the Web Errors metric helps detect broken functionality due to uncaught errors especially useful for smart TVs, browsers, and web apps where silent failures impact user experiences.
Additionally, select the Web Errors metric widget and use the dimension tables to isolate error root causes across dimensions. If available, Conviva DPI sensor auto-collects the related errorReason and errorID data and display this data in dimension tables for additional analysis.
Android/iOS App Crashes
For Android and iOS apps, Conviva DPI provides two crash metrics:
- App Crashes (v2) (event: conviva_crash_v2) — uses system APIs for accurate crash count reporting, including OOM events, native (NDK) crashes, system-level freezes, and pre-initialization crashes. Reported on the next launch. Use for accurate crash count reporting and dashboards.
- App Crashes (v1) (event: conviva_application_error) — reported in real time before the application closes. Use only when you need real-time crash detection during an active flow; v1 undercounts relative to v2.
Selecting the App Crashes (v2) or App Crashes (v1) metric, these error events appear in the Trends metric widget time series. Analyzing these metrics helps detect fatal app exceptions and resource blockage. Additionally, select the metric widget and use the dimension tables to isolate crash related root causes, such as connection issues and under-resourced server processes.
Metrics for Crash to App Startup and Mins with Crash provide data to troubleshooting issues after which app restarted within 30 seconds. These related metrics are computed from App Crashes (v1). For more details, see App Crashes Explained and DPI Metrics.
Error Analysis in Trends Metric Widget and Dimension Tables
For web app errors, In the Trends Analysis tab select the Web Errors time series to the related error messages and stack trace data.
Selecting a specific error message creates an instant-filter to isolate related root causes across the other dimensions, such as app version. Open the stacktrace to examine the active stack frames at the time of the error.
For iOS/Android apps, in the Trends Analysis tab select the App Crashes (v2) or App Crashes (v1) time series to display the related error messages and stack trace data.
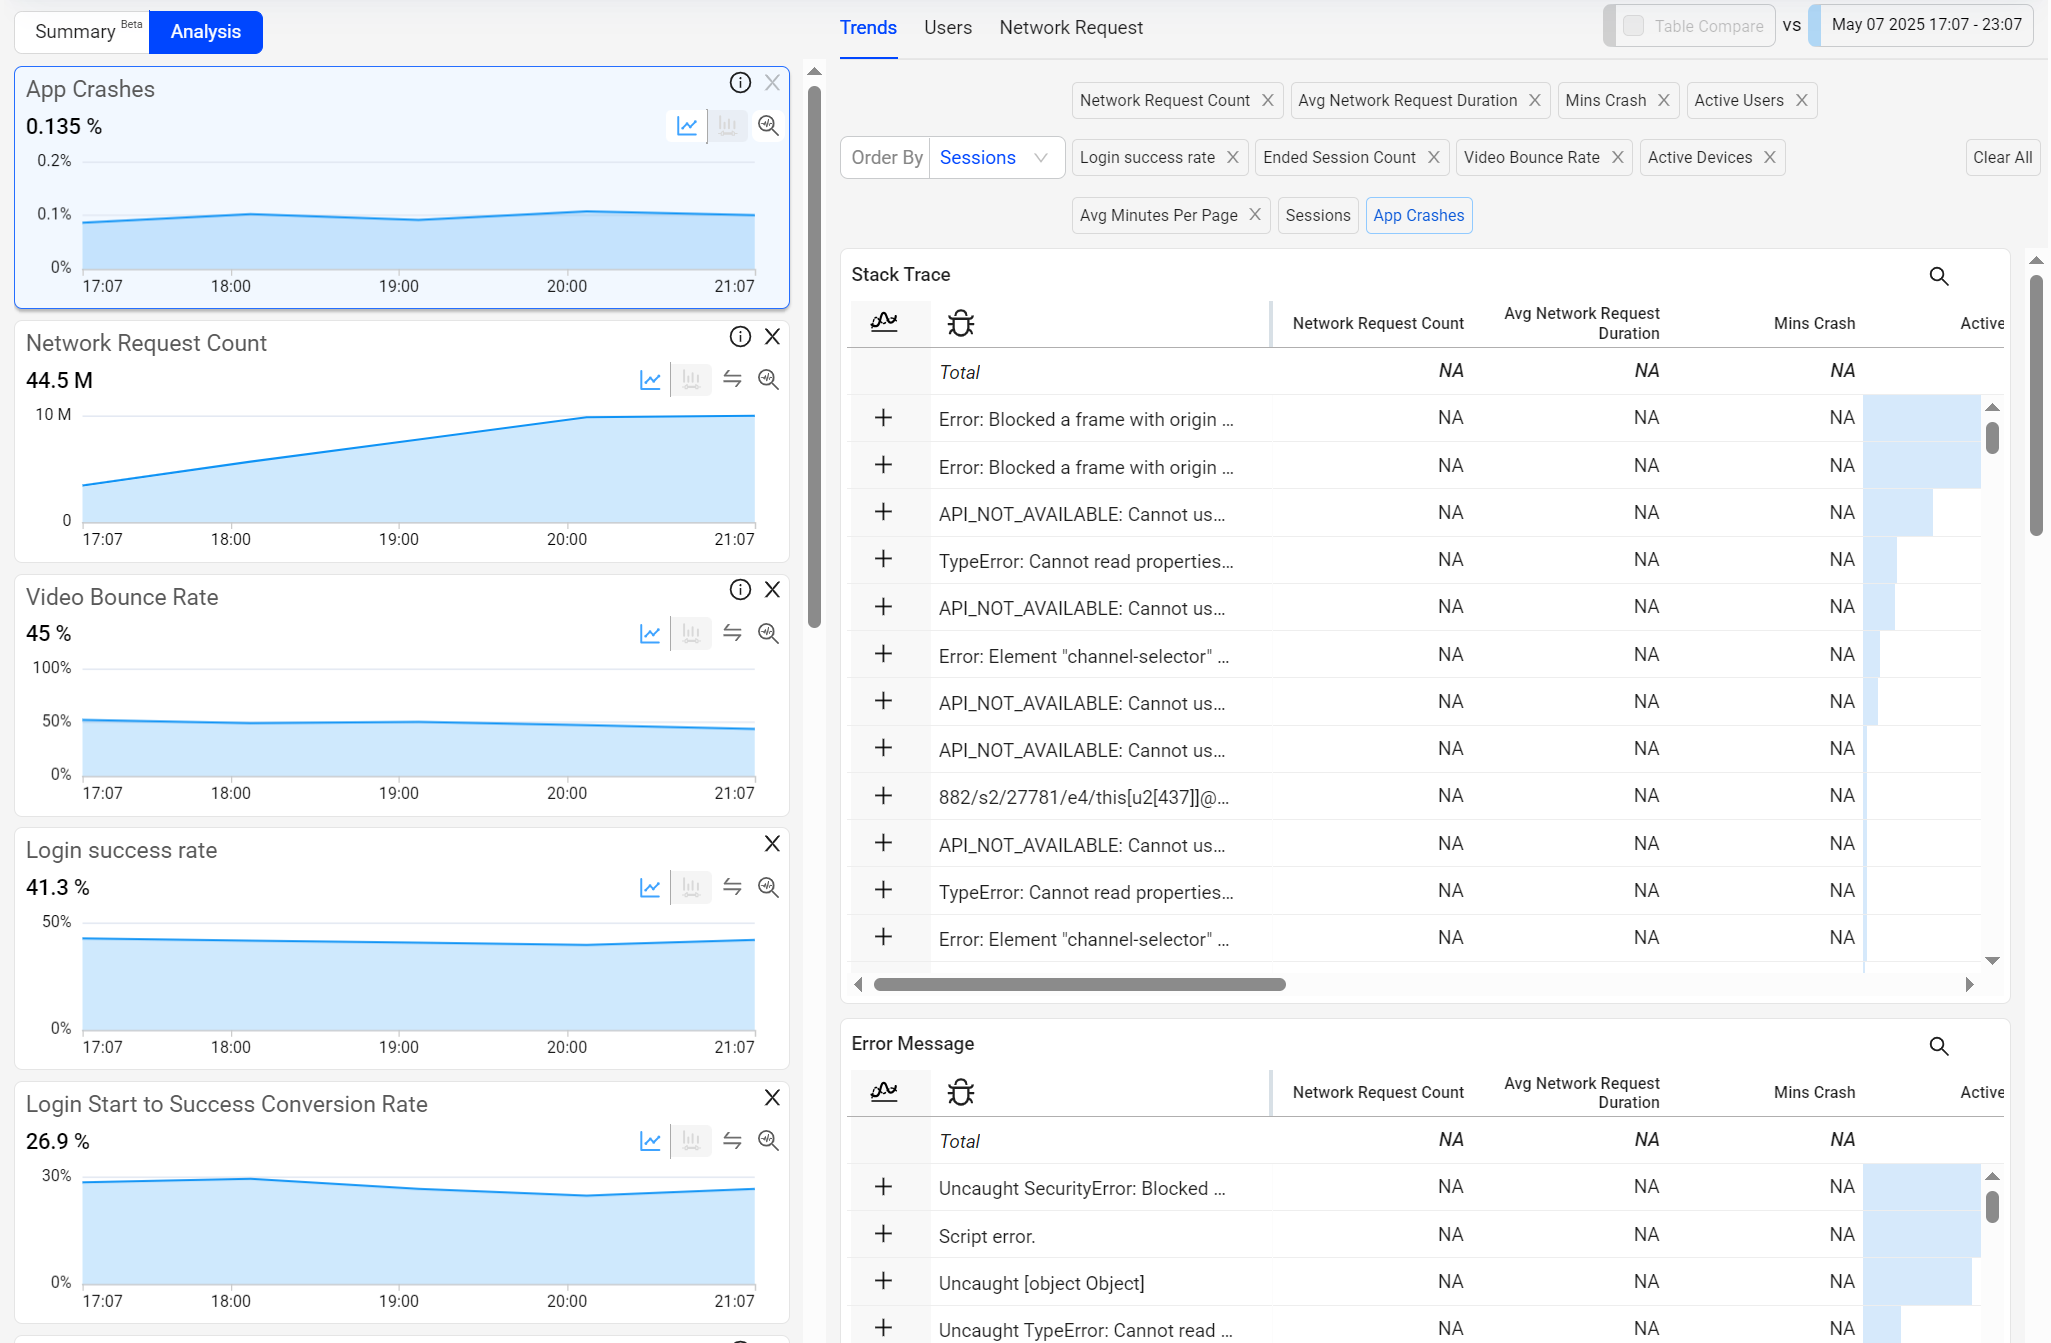
Selecting a specific app crash error message creates an instant-filter to isolate related root causes across the other dimensions, such as app version. Open the stacktrace to examine the active stack frames at the time of the app crash.
Custom Metrics Based on Application Errors and Event Data
To support advance performance analysis, Conviva DPI supports custom metrics based on the Conviva pre-defined conviva_application_error event as the initial or complete event for use in custom metric building and flow settings.
In the Activation settings for Metric Builder or Flow settings, select the conviva_application_error event as the initial or complete event and set the tag key for any specfic error identifier, such as error number or error message.
The Semantic Mapper enables customization of the error tag key and tag values to build specific app error events for use in custom error metrics.
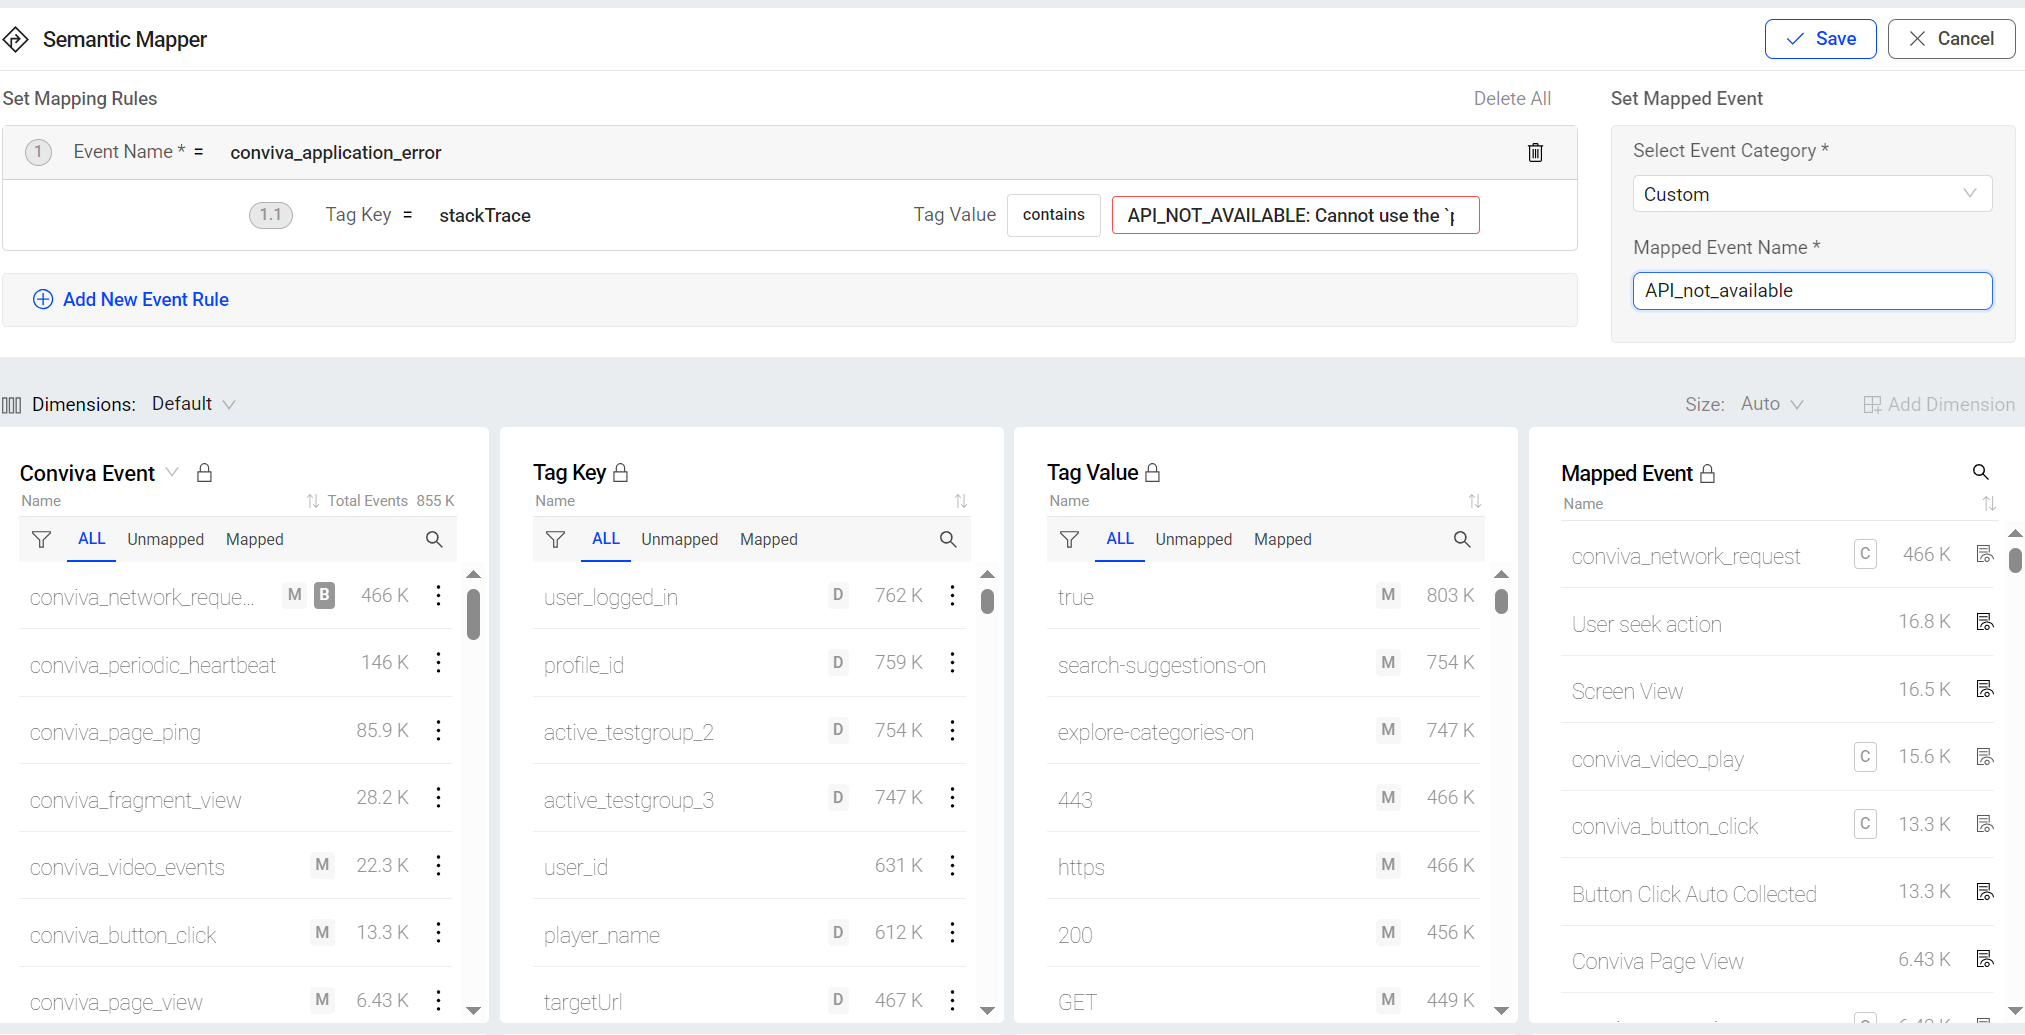
Examples error events for advanced performance analysis include custom metrics based on app backgrounding followed an app error or a series of user actions followed by app errors.
Activate Sensor and Customize Data Ingest
After integrating a Conviva DPI sensor, use Sensor Remote Control, Semantic Mapper, and Metric Builder in Activation to perform advanced integration for customized data ingestion as per the business needs.
Sensor Remote Control
Customize data ingestion by:
Blocking unwanted events collection: Prevent the sensor to collect irrelevant or meaningless events to ensure accuracy and relevancy of data ingestion. **For more information, see Blocked Events.
Filtering network requests: Define the collection rules for conviva_network_request events to enable sensor collecting network request events as per the matched rules. For more information, see Configured Network Request.
Customizing user-click tracking: Customize user-click tracking across the application, beyond tracking the click events for buttons and links to track user clicks for various purposes, such as defining Out-of-Box (OOB) metrics, resolving UX issues, and even creating meaningful user Flows. For more information, see Auto Collection of Clicks.
Configuring intelligent collections of network requests: Override the default URL blocklist with rules to optimize the volume of network request ingestion. Configure the rules using hostname, path, or scheme-based filters for collecting a specific set of network requests. For more information, see Intelligent Collection of Network Requests.
Enabling Cohort Replay: Reconstruct user navigations and actions within a customer's app to get direct visibility into how customers interact with digital platforms and analyze user behaviors based on a sample user sessions. For more information, see Cohort Replay.
Semantic Mapper
Use Semantic Mapper tab in Activation to map raw events using tag keys and values for metric creation.
For more information, see Semantic Mapper.
Metric Builder
Build flows and custom metrics associated with specified initial/follow-up events to analyze data for complex user actions and app performance scenarios, such as analyzing the amount of time spent between viewer login and the start of video playtime and the success rate of cart uploads to completed purchase.
For more information, see Metric Builder.
Validate Integration in LiveLens
Conviva Sensor validation automatically tests the data ingest for specific application events and displays the validation status for each event typer.
For more information, see LiveLens.