
Summary Panel enhances actionability with SPI, Good and Impacted Streams, Improvement Opportunities (similar to the Overview Dashboard), Aggregated Audience Summary, and Ad metrics. It allows you to select and display desired metric widgets through the edit option, offering significant customization providing a quick determination of performance startup and playback experience.
| Watch Summary Panel GIF to see the drill down from Summary Panel |

|
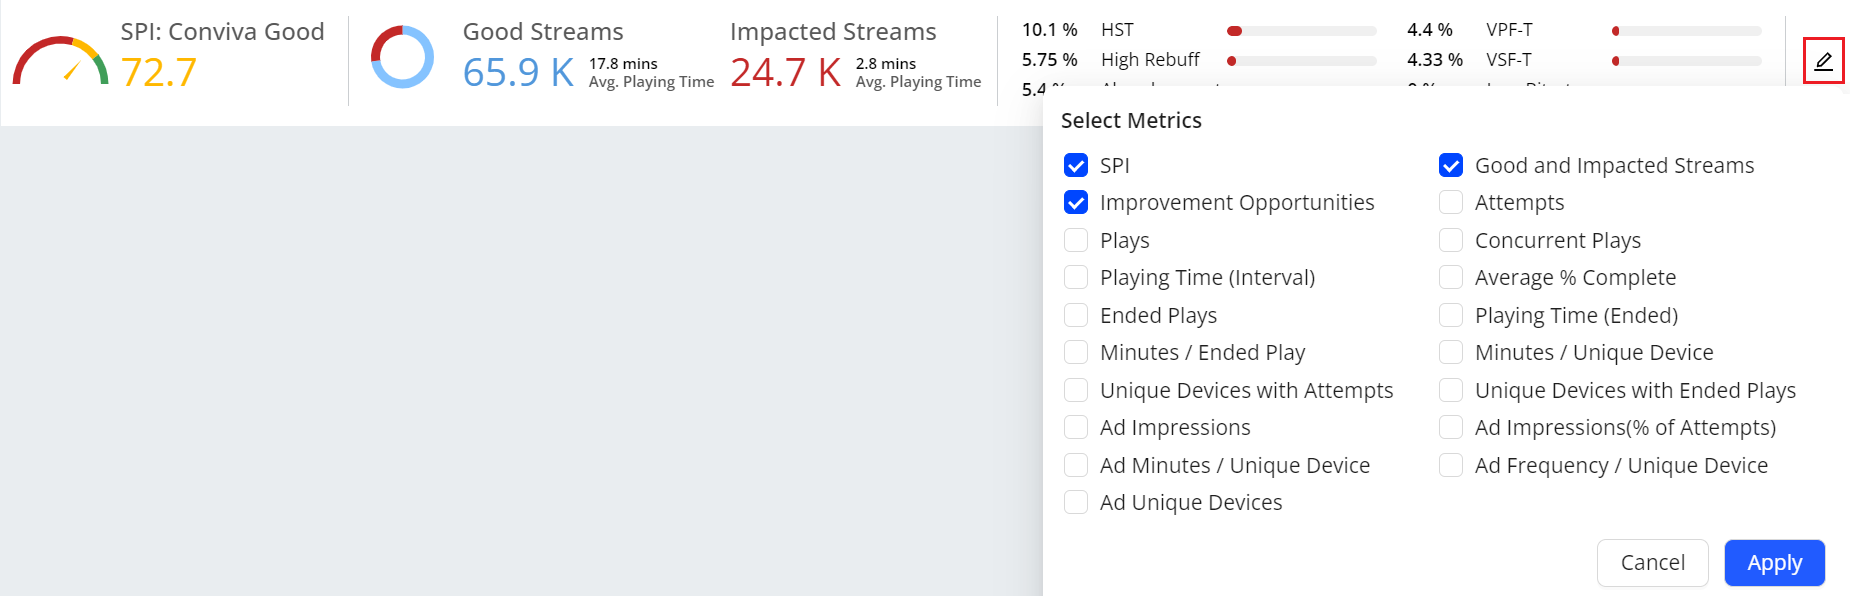
Summary Panel Metrics
SPI
The SPI allows you to visually observe the performance of your KPIs and metrics over the chosen period using the SPI streams. Additionally, you can swiftly determine the count and percentage of impacted streams. An impacted stream is a stream that does not meet one or more KPI settings. The specific KPI performance of streams is shown in Improvement Opportunities.
Good and Impacted Streams
Conviva formulates the Conviva Streaming Performance Index, which assesses the percentage of streaming sessions that provide a good or best viewing experience based on the SPI streams. This index takes into account various factors. Good streams performed above the SPI KPI threshold settings, while Impacted Streams did not meet these threshold settings and were performance impacted.
This is based on the condition:
GoodSessionAverageLifePlayingTimeMins > BadSessionAverageLifePlayingTimeMins * 1.1
For more information on the KPI settings to match your specific performance goals, refer Experience Overview.
Improvement Opportunities
The Improvement Opportunities performance measurements highlight the most common issues that impacted viewer experience in the selected period based on the SPI settings. For example, a high rebuffering ratio may indicate that better alignment of bitrate and buffer control settings could improve viewer experience.
Improvement Opportunities Metrics:
High Rebuffering (high CIRR or CIRT)
Abandonment
High Startup Time
Video Playback Failure
Video Start Failures (VSF-T)
Low Bitrate For information on the Improvement Opportunities Metrics, refer Experience Overview.
Audience Metrics
The Audience Metrics are:
Attempts
Plays
Concurrent Plays
Playing Time (Interval)
Ended Plays
Minutes/Ended Plays
Average%Complete
Playing Time (Ended)
Ad Metrics
The Ad metrics are:
Ad Impressions
Ad Impressions(% of Attempts)
Ad Minutes / Unique Device
Ad Frequency / Unique Device
Ad Unique Devices
For more information on the Ad metrics, see Ads Metrics.
Clicking the metric on the summary panel displays the selected metric widget and a metric column in the dimensional table. For example, high buffering - SPI threshold.