
This metric shows the sum of Attempts that ended before video start without a reported fatal error, within the selected interval.

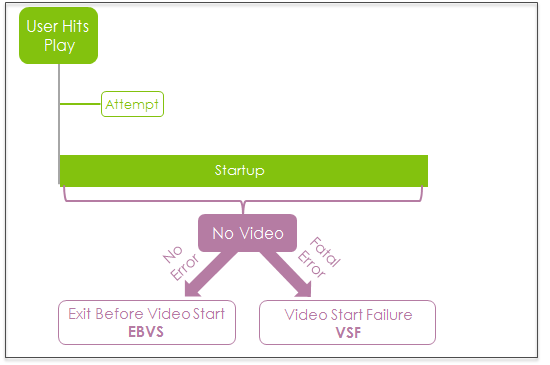
If a fatal error is reported when the video terminates before starting, the video termination is counted as a Video Start Failures (VSF) instead of EBVS.
With Client-Side Ad Insertion (CSAI), pre-roll ads are included in the video startup and exits during these ads contribute to EBVS.
With Server-Side Ad Insertion (SSAI), pre-roll ads are not included in the video startup and exits during these ads do not contribute to EBVS.
For more details about CSAI and SSAI sessions, see Metric Events.
As a percentage, this metric shows the percent of viewing Attempts that experienced EBVS.

EBVS is an 'Interval' type metric and is counted in the interval in which exit occurs. For more information about Conviva metric intervals, see the Metric Dictionary.
Exits Before Video Start is available in the following formats:
- Exits Before Video Start — the total number of EBVS during the selected time period.
- Exits Before Video Start summary — the total number of EBVS during the selected time period for the top content assets.
- Exits Before Video Start time series — a time series for the selected time period, where each point is the number of EBVS during that specific interval.
Abandonment
Abandonment occurs when a viewer exits a video before the video start with a wait time greater than the SPI threshold setting — 10 seconds for SPI Good and 8 seconds for SPI Best. Abandonment appears as an improvement opportunity in the Overview dashboard. Based on the SPI threshold setting and the EBVS Wait Time, Abandonment also appears as a metric in Trends and other dashboards. For more details about SPI settings for abandonment and analyzing these improvement opportunities, see the Overview dashboard and the SPI Introduction.
Abandonment can also be configured as an AI Alert through KPI-based Metrics (Beta).
Distribution
Wait Time Before Exit distribution: a distribution of the Attempts that resulted in wait times across a series of predefined buckets. The buckets represent different ranges of Wait Time (seconds), and each bucket displays the number of Attempts with EBVS for the wait-time ranges. You can use this distribution to help determine the amount of wait time users tolerated before exiting the video start.
You can use metric filtering to diagnose only the sessions that had a high percentage of dropped frames. For more details on metric filters, see Metric filtering.
Diagnostics Widgets
For a detailed definition of the metrics referenced below, see the Metric Dictionary.
The three drill-down widgets on the EBVS Diagnostic are connected to the main Exits Before Video Start widget at the top of the page. When you click a data point on the main widget the contents of the drill-down widgets are updated to show the detail for that data point.
- Exits Before Video Start
- Wait Time Before Exit
- Video Startup Time Distribution
- EBVS by CDN/Resource, Asset Name, ASN
Related Details
| Metric Details | Description |
|---|---|
| Dashboards and Metric Presentation | Overview, Real-Time, MetricLens, Viewer Sessions, Diagnostics |
| Dimensions | Use MetricLens dimensions to filter this metric by metadata segments for enhanced root cause analysis. For example, limiting data to specific ISP and player dimensions can narrow the root cause of higher EBVS to a known provider and player type. |
| Diagnostics | See Diagnostics Widgets above for the EBVS Diagnostic view. |
| Manual Alert Support | Yes. Configure alerts to receive proactive notification when EBVS issues occur. For more information, see Alerts. |
| AI Alert Support | Yes. AI Alerts offer proactive anomaly detection and instant alerting to help shorten time to resolution. Both Exits Before Video Start and Abandonment are supported for AI Alerts — Abandonment through KPI-based Metrics (Beta). For more information, see AI Alerts. |
| Metric Adjustments | None. |
For more metric definitions, see the Metric Dictionary.